


 |
市場調查報告書
商品編碼
1913309
加工蔬果市場機會、成長要素、產業趨勢分析及預測(2026-2035年)Processed Fruits and Vegetables Market Opportunity, Growth Drivers, Industry Trend Analysis, and Forecast 2026 - 2035 |
||||||
全球加工水果和蔬菜市場預計到 2025 年將達到 3,997 億美元,到 2035 年將達到 6,206 億美元,年複合成長率為 4.5%。
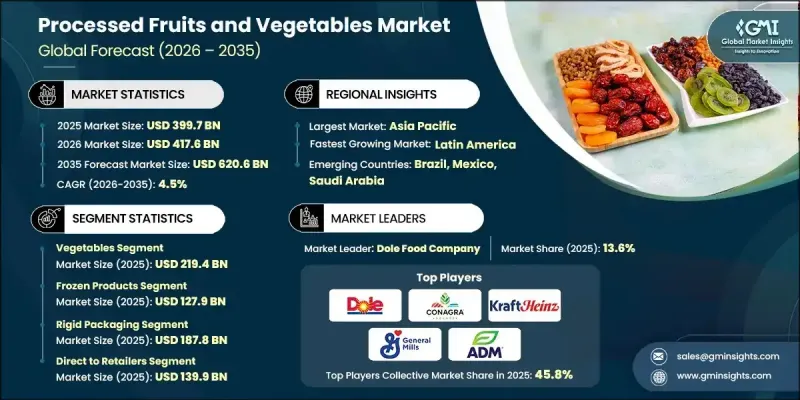
成長的驅動力在於消費模式的轉變,而這種轉變強調日常飲食的便利性和時間效率。都市化、工作時間延長以及家庭結構的改變持續減少人們用於準備膳食的時間,從而推動了對無需烹飪的即食食品的需求。加工蔬果滿足了這些需求,其優勢包括保存期限長、品質穩定以及在各種消費場景下易於使用。同時,人們對營養和均衡飲食的日益重視也提升了消費者對加工農產品的正面看法。許多消費者現在認為,只要營養價值得以維持,這些產品就可以作為新鮮食品的可行替代品。消費者對低加工食品、冷凍產品以及以植物性食物為主的飲食習慣的接受度不斷提高,正在擴大消費者群體,並鞏固零售和餐飲管道的長期市場擴張。
| 市場覆蓋範圍 | |
|---|---|
| 開始年份 | 2025 |
| 預測年份 | 2026-2035 |
| 起始值 | 3997億美元 |
| 預測金額 | 6206億美元 |
| 複合年成長率 | 4.5% |
預計到2025年,蔬菜市場規模將達到2,194億美元。蔬菜因其在家庭、餐飲服務和工業食品生產中的廣泛用途,已成為加工蔬果市場的主要產品系列。與水果相比,蔬菜保存期限長、天然糖分含量低,且能適應世界各地的烹飪風格,這些優勢支撐了其強勁而穩定的需求。
冷凍食品將在加工食品中佔據主導地位,到 2025 年市場規模將達到 1,279 億美元。這些產品因其保存期限長、營養價值、口感和風味得以保留而備受青睞,可滿足商業和消費者的各種需求。
預計到2025年,北美加工蔬果市場將佔據23%的市場佔有率,這主要得益於先進的加工技術、強大的低溫運輸基礎設施和嚴格的食品安全標準。美國憑藉其大規模的製造業基地、較高的人均加工食品消費量以及完善的零售和餐飲服務業網路,在區域生產中處於領先地位。
目錄
第1章調查方法和範圍
第2章執行摘要
第3章業界考察
- 生態系分析
- 供應商情況
- 利潤率
- 每個階段的附加價值
- 影響價值鏈的因素
- 中斷
- 產業影響因素
- 促進要素
- 消費者對簡便食品的需求不斷成長
- 人們越來越關注健康和保健
- 有組織的零售和電子商務的擴張
- 產業潛在風險與挑戰
- 對季節性原料的高度依賴
- 嚴格的食品安全和品質法規
- 市場機遇
- 拓展至植物來源及功能性產品領域
- 有可能出口到當地產量有限的地區。
- 促進要素
- 成長潛力分析
- 監管環境
- 北美洲
- 歐洲
- 亞太地區
- 拉丁美洲
- 中東和非洲
- 波特五力分析
- PESTEL 分析
- 價格趨勢
- 按地區
- 產品類型
- 未來市場趨勢
- 科技與創新趨勢
- 當前技術趨勢
- 新興技術
- 專利狀態
- 貿易統計(HS編碼)(註:僅提供主要國家的貿易統計)
- 主要進口國
- 主要出口國
- 永續性和環境方面
- 永續努力
- 減少廢棄物策略
- 生產中的能源效率
- 環保舉措
- 碳足跡考量
第4章 競爭情勢
- 介紹
- 公司市佔率分析
- 按地區
- 北美洲
- 歐洲
- 亞太地區
- 拉丁美洲
- 中東和非洲
- 按地區
- 企業矩陣分析
- 主要市場公司的競爭分析
- 競爭定位矩陣
- 重大進展
- 併購
- 夥伴關係與合作
- 新產品發布
- 擴張計劃
第5章 依產品類型分類的市場估算與預測,2022-2035年
- 水果
- 柑橘
- 莓果
- 核果
- 熱帶水果
- 其他水果
- 蔬菜
- 葉菜類和十字花科蔬菜
- 根莖類和球莖類蔬菜
- 其他蔬菜
第6章 按加工類型分類的市場估算與預測,2022-2035年
- 罐裝和瓶裝產品
- 冷凍產品
- 乾/脫水產品
- 新鮮切製/極簡加工
- 果汁和濃縮液
- 果醬和果凍
- 食物泥和醬汁
- 其他
7. 按包裝類型分類的市場估價與預測,2022-2035 年
- 硬包裝
- 金屬罐
- 玻璃瓶
- 硬質塑膠容器
- 軟包裝
- 立式袋
- 殺菌袋
- 包裝袋、薄膜和包裝紙
- 散裝包裝
- 桶和罐
- 噸桶/IBC容器
- 無菌散裝容器
- 其他
第8章 按分銷管道分類的市場估算與預測,2022-2035年
- 線上平台
- 直接銷售給零售商
- 批發商
- 其他
第9章 2022-2035年各地區市場估算與預測
- 北美洲
- 美國
- 加拿大
- 歐洲
- 德國
- 英國
- 法國
- 西班牙
- 義大利
- 其他歐洲地區
- 亞太地區
- 中國
- 印度
- 日本
- 澳洲
- 韓國
- 亞太其他地區
- 拉丁美洲
- 巴西
- 墨西哥
- 其他拉丁美洲地區
- 中東和非洲
- 沙烏地阿拉伯
- 南非
- 阿拉伯聯合大公國
- 其他中東和非洲地區
第10章:公司簡介
- Dole Food Company
- Conagra Brands, Inc.
- Del Monte Foods, Inc.
- Nestle SA
- The Kraft Heinz Company
- General Mills, Inc.
- B&G Foods, Inc.
- ADM
- ABC Fruits
- Conagra
- Vebzy Nature
- Grofresh Agrofoods Pvt Ltd
The Global Processed Fruits and Vegetables Market was valued at USD 399.7 billion in 2025 and is estimated to grow at a CAGR of 4.5% to reach USD 620.6 billion by 2035.
Growth is supported by changing consumption patterns that favor convenience and time efficiency in daily meals. Urbanization, longer working schedules, and evolving household structures continue to reduce time available for food preparation, strengthening demand for ready-to-use and ready-to-eat food options. Processed fruits and vegetables address these needs by offering extended shelf life, consistent quality, and ease of use across multiple consumption settings. At the same time, rising awareness of nutrition and balanced diets is supporting positive consumer perception of processed produce. Many consumers now view these products as practical alternatives to fresh options when nutritional value is preserved. Growing acceptance of minimally processed formats, frozen offerings, and plant-forward eating habits is widening the consumer base and reinforcing long-term market expansion across retail and foodservice channels.
| Market Scope | |
|---|---|
| Start Year | 2025 |
| Forecast Year | 2026-2035 |
| Start Value | $399.7 Billion |
| Forecast Value | $620.6 Billion |
| CAGR | 4.5% |
The vegetables category generated USD 219.4 billion in 2025. Vegetables represent the dominant product group within the processed fruits and vegetables market due to broad utilization across households, foodservice operations, and industrial food production. Their longer storage potential, lower natural sugar content compared to fruits, and adaptability across global cuisines contribute to strong and consistent demand.
The frozen formats segment accounted for USD 127.9 billion in 2025, holding a leading share within processing types. These products are favored for their ability to preserve nutritional content, texture, and taste while offering extended storage life, supporting both commercial and consumer use.
North America Processed Fruits and Vegetables Market held 23% share in 2025, supported by advanced processing capabilities, robust cold-chain infrastructure, and strong food safety standards. The United States leads regional production due to a large manufacturing base, high per-capita consumption of convenience foods, and well-developed retail and foodservice networks.
Key companies active in the Global Processed Fruits and Vegetables Market include Nestle S.A., Dole Food Company, The Kraft Heinz Company, General Mills, Inc., Del Monte Foods, Inc., Conagra Brands, Inc., B&G Foods, Inc., ADM, Grofresh Agrofoods Pvt Ltd, Vebzy Nature and ABC Fruits. Companies operating in the Global Processed Fruits and Vegetables Market strengthen their position through product innovation, supply chain efficiency, and geographic expansion. Leading players invest in processing technologies that maintain nutritional integrity while improving shelf stability. Portfolio diversification across formats and price points helps address varied consumer preferences. Firms also focus on sourcing optimization and long-term partnerships with growers to ensure consistent raw material supply. Expansion into emerging markets, along with enhanced distribution networks, supports volume growth.
Table of Contents
Chapter 1 Methodology & Scope
- 1.1 Market scope and definition
- 1.2 Research design
- 1.2.1 Research approach
- 1.2.2 Data collection methods
- 1.3 Data mining sources
- 1.3.1 Global
- 1.3.2 Regional/Country
- 1.4 Base estimates and calculations
- 1.4.1 Base year calculation
- 1.4.2 Key trends for market estimation
- 1.5 Primary research and validation
- 1.5.1 Primary sources
- 1.6 Forecast model
- 1.7 Research assumptions and limitations
Chapter 2 Executive Summary
- 2.1 Industry 360° synopsis
- 2.2 Key market trends
- 2.2.1 Regional
- 2.2.2 Product Type
- 2.2.3 Processing Form
- 2.2.4 Packaging Type
- 2.2.5 Distribution Channel
- 2.3 TAM Analysis, 2026-2035
- 2.4 CXO perspectives: Strategic imperatives
- 2.4.1 Executive decision points
- 2.4.2 Critical success factors
- 2.5 Future Outlook and Strategic Recommendations
Chapter 3 Industry Insights
- 3.1 Industry ecosystem analysis
- 3.1.1 Supplier Landscape
- 3.1.2 Profit Margin
- 3.1.3 Value addition at each stage
- 3.1.4 Factor affecting the value chain
- 3.1.5 Disruptions
- 3.2 Industry impact forces
- 3.2.1 Growth drivers
- 3.2.1.1 Rising consumer demand for convenience foods
- 3.2.1.2 Growing health & wellness consciousness
- 3.2.1.3 Expansion of organized retail & e-commerce
- 3.2.2 Industry pitfalls and challenges
- 3.2.2.1 High Dependency on Seasonal Raw Materials
- 3.2.2.2 Stringent Food Safety and Quality Regulations
- 3.2.3 Market opportunities
- 3.2.3.1 Expansion into Plant-Based and Functional Products
- 3.2.3.2 Export potential to regions with limited local production
- 3.2.1 Growth drivers
- 3.3 Growth potential analysis
- 3.4 Regulatory landscape
- 3.4.1 North America
- 3.4.2 Europe
- 3.4.3 Asia Pacific
- 3.4.4 Latin America
- 3.4.5 Middle East & Africa
- 3.5 Porter's analysis
- 3.6 PESTEL analysis
- 3.7 Price trends
- 3.7.1 By region
- 3.7.2 Product Type
- 3.8 Future market trends
- 3.9 Technology and Innovation Landscape
- 3.9.1 Current technological trends
- 3.9.2 Emerging technologies
- 3.10 Patent Landscape
- 3.11 Trade statistics (HS code) (Note: the trade statistics will be provided for key countries only)
- 3.11.1 Major importing countries
- 3.11.2 Major exporting countries
- 3.12 Sustainability and environmental aspects
- 3.12.1 Sustainable practices
- 3.12.2 Waste reduction strategies
- 3.12.3 Energy efficiency in production
- 3.12.4 Eco-friendly initiatives
- 3.13 Carbon footprint considerations
Chapter 4 Competitive Landscape, 2025
- 4.1 Introduction
- 4.2 Company market share analysis
- 4.2.1 By region
- 4.2.1.1 North America
- 4.2.1.2 Europe
- 4.2.1.3 Asia Pacific
- 4.2.1.4 LATAM
- 4.2.1.5 MEA
- 4.2.1 By region
- 4.3 Company matrix analysis
- 4.4 Competitive analysis of major market players
- 4.5 Competitive positioning matrix
- 4.6 Key developments
- 4.6.1 Mergers & acquisitions
- 4.6.2 Partnerships & collaborations
- 4.6.3 New product launches
- 4.6.4 Expansion plans
Chapter 5 Market Estimates and Forecast, By Product Type, 2022 - 2035 (USD Billion) (Kilo Tons)
- 5.1 Key trends
- 5.2 Fruits
- 5.2.1 Citrus fruits
- 5.2.2 Berries
- 5.2.3 Stone fruits
- 5.2.4 Tropical fruits
- 5.2.5 Other fruits
- 5.3 Vegetables
- 5.3.1 Leafy & cruciferous vegetables
- 5.3.2 Root & bulb vegetables
- 5.3.3 Other vegetables
Chapter 6 Market Estimates and Forecast, By Processing Form, 2022 - 2035 (USD Billion) (Kilo Tons)
- 6.1 Key trends
- 6.2 Canned / jarred products
- 6.3 Frozen products
- 6.4 Dried & dehydrated
- 6.5 Fresh-cut / minimally processed
- 6.6 Juices & concentrates
- 6.7 Preserves, jams & jellies
- 6.8 Purees & sauces
- 6.9 Others
Chapter 7 Market Estimates and Forecast, By Packaging Type, 2022 - 2035 (USD Billion) (Kilo Tons)
- 7.1 Key trends
- 7.2 Rigid packaging
- 7.2.1 Metal cans
- 7.2.2 Glass jars
- 7.2.3 Rigid plastic containers
- 7.3 Flexible packaging
- 7.3.1 Stand-up pouches
- 7.3.2 Retort pouches
- 7.3.3 Bags, films & wraps
- 7.4 Bulk packaging
- 7.4.1 Drums & pails
- 7.4.2 Totes & IBC containers
- 7.4.3 Aseptic bulk containers
- 7.5 Others
Chapter 8 Market Estimates and Forecast, By Distribution Channel, 2022 - 2035 (USD Billion) (Kilo Tons)
- 8.1 Key trends
- 8.2 Online platforms
- 8.3 Direct to retailers
- 8.4 Wholesalers
- 8.5 Others
Chapter 9 Market Estimates and Forecast, By Region, 2022 - 2035 (USD Billion) (Kilo Tons)
- 9.1 Key trends
- 9.2 North America
- 9.2.1 U.S.
- 9.2.2 Canada
- 9.3 Europe
- 9.3.1 Germany
- 9.3.2 UK
- 9.3.3 France
- 9.3.4 Spain
- 9.3.5 Italy
- 9.3.6 Rest of Europe
- 9.4 Asia Pacific
- 9.4.1 China
- 9.4.2 India
- 9.4.3 Japan
- 9.4.4 Australia
- 9.4.5 South Korea
- 9.4.6 Rest of Asia Pacific
- 9.5 Latin America
- 9.5.1 Brazil
- 9.5.2 Mexico
- 9.5.3 Rest of Latin America
- 9.6 Middle East and Africa
- 9.6.1 Saudi Arabia
- 9.6.2 South Africa
- 9.6.3 UAE
- 9.6.4 Rest of Middle East and Africa
Chapter 10 Company Profiles
- 10.1 Dole Food Company
- 10.2 Conagra Brands, Inc.
- 10.3 Del Monte Foods, Inc.
- 10.4 Nestle S.A.
- 10.5 The Kraft Heinz Company
- 10.6 General Mills, Inc.
- 10.7 B&G Foods, Inc.
- 10.8 ADM
- 10.9 ABC Fruits
- 10.10 Conagra
- 10.11 Vebzy Nature
- 10.12 Grofresh Agrofoods Pvt Ltd


