


 |
市場調查報告書
商品編碼
1913300
硫酸鈉市場機會、成長要素、產業趨勢分析及預測(2026年至2035年)Sodium Sulphate Market Opportunity, Growth Drivers, Industry Trend Analysis, and Forecast 2026 - 2035 |
||||||
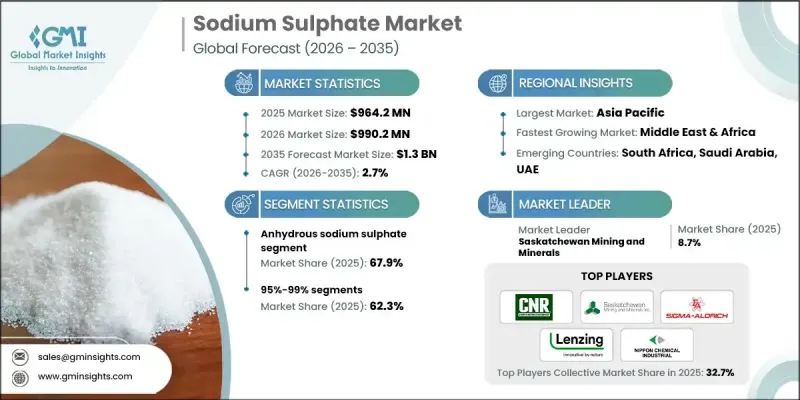
預計到 2025 年,全球硫酸鈉市場價值將達到 9.642 億美元,到 2035 年將達到 13 億美元,年複合成長率為 2.7%。
硫酸鈉是一種用途廣泛的無機化合物,廣泛應用於玻璃製造、清潔劑和製藥等眾多行業。其化學性質對於玻璃淨化和結腸清潔產品的生產至關重要。由於永續建築和工業能源管理中熱能能源儲存系統的日益普及,硫酸鈉優異的熱穩定性和保溫性能推動了市場需求。隨著能源效率成為全球優先事項,對儲能技術的投資正在加速成長。此外,包裝和綠色生產實踐(尤其是在玻璃產業)的永續性舉措也推動了市場成長。該化合物在減少碳足跡和支持新興技術方面發揮的作用,凸顯了其在工業應用中日益成長的重要性。
| 市場覆蓋範圍 | |
|---|---|
| 開始年份 | 2025 |
| 預測年份 | 2026-2035 |
| 起始值 | 9.642億美元 |
| 預測金額 | 13億美元 |
| 複合年成長率 | 2.7% |
無水硫酸鈉市場佔有率佔 67.9%,預計到 2035 年將以 2.7% 的複合年成長率成長。它廣泛應用於洗滌劑清潔劑、紡織品染色、玻璃精製和牛皮紙漿生產等領域,工業和出口導向活動確保了穩定的需求。
由於其雜質含量均衡且用途廣泛,預計到2025年,純度為95-99%的玻璃將佔據62.3%的市場佔有率。此等級的玻璃雜質含量品管,在容器玻璃和平板玻璃生產中至關重要。此外,在全球紡織業現代化進程的推動下,該等級的玻璃也為大規模紡織印染產業提供了支持。
預計2026年至2035年,北美硫酸鈉市場將以2.6%的複合年成長率成長。這一成長主要得益於工業流程、污水回收利用和循環經濟措施的技術創新。消費者對環保產品的需求不斷成長,以及生質能源和可生物分解包裝等領域的新興應用,正在推動各行業,尤其是清潔和個人護理行業,對硫酸鈉的採用。
目錄
第1章調查方法和範圍
第2章執行摘要
第3章業界考察
- 生態系分析
- 供應商情況
- 利潤率
- 每個階段的附加價值
- 影響價值鏈的因素
- 中斷
- 產業影響因素
- 促進要素
- 新興熱能儲存應用領域的需求日益成長
- 擴大玻璃生產,實現永續包裝
- 醫藥界對結腸清潔產品的需求不斷成長
- 產業潛在風險與挑戰
- 粉狀清潔劑需求結構性下降(轉向液體清潔劑)
- 高昂的運輸成本是市場擴張的障礙。
- 市場機遇
- 相變材料市場在建築節能領域的成長
- 擴大鈉離子電池生產
- 促進要素
- 成長潛力分析
- 監管環境
- 北美洲
- 歐洲
- 亞太地區
- 拉丁美洲
- 中東和非洲
- 波特五力分析
- PESTEL 分析
- 價格趨勢
- 按地區
- 按產品形式
- 未來市場趨勢
- 科技與創新趨勢
- 當前技術趨勢
- 新興技術
- 專利狀態
- 貿易統計(HS編碼)
(註:貿易統計數據僅涵蓋主要國家。)
- 主要進口國
- 主要出口國
- 永續性和環境方面
- 永續努力
- 減少廢棄物策略
- 生產中的能源效率
- 環保舉措
- 考慮到碳足跡
第4章 競爭情勢
- 介紹
- 公司市佔率分析
- 按地區
- 北美洲
- 歐洲
- 亞太地區
- 拉丁美洲
- 中東和非洲
- 按地區
- 企業矩陣分析
- 主要市場公司的競爭分析
- 競爭定位矩陣
- 重大進展
- 併購
- 夥伴關係與合作
- 新產品發布
- 業務拓展計劃
第5章 依產品類型分類的市場估算與預測,2022-2035年
- 無水硫酸鈉
- 十水合物
- 七水合物
第6章 依純度等級分類的市場估算與預測,2022-2035年
- 95%
- 95%~99%
- >=99.5%
7. 2022-2035年按最終用途產業分類的市場估算與預測
- 居家及個人護理
- 清潔劑和清潔用品
- 化妝品和個人保健產品
- 地毯清新劑和除臭劑
- 其他
- 建材
- 玻璃製造
- 混凝土添加劑
- 能源儲存系統
- 其他
- 紙漿和造紙
- 紡織服裝
- 食品/飲料
- 食品加工
- 飲料包裝
- 其他
- 製藥和醫療保健
- 製藥生產
- 醫療設備和實驗室應用
- 其他
- 其他
第8章 2022-2035年各地區市場估算與預測
- 北美洲
- 美國
- 加拿大
- 歐洲
- 德國
- 英國
- 法國
- 西班牙
- 義大利
- 其他歐洲地區
- 亞太地區
- 中國
- 印度
- 日本
- 澳洲
- 韓國
- 亞太其他地區
- 拉丁美洲
- 巴西
- 墨西哥
- 阿根廷
- 其他拉丁美洲地區
- 中東和非洲
- 沙烏地阿拉伯
- 南非
- 阿拉伯聯合大公國
- 其他中東和非洲地區
第9章:公司簡介
- Atul Limited
- Cooper Natural Resources Inc.
- Hemadri Chemicals
- Lenzing Group
- Nikunj Chemicals
- Nippon Chemical Industrial Co., Ltd.
- Saltex LLC
- Saskatchewan Mining and Minerals
- Shikoku Chemicals Corporation
- Sigma-Aldrich
- TCI Chemicals
The Global Sodium Sulphate Market was valued at USD 964.2 million in 2025 and is estimated to grow at a CAGR of 2.7% to reach USD 1.3 billion by 2035.
Sodium sulphate is a versatile inorganic compound widely used across industries, including glass manufacturing, detergents, and pharmaceuticals. Its chemical properties are essential for purifying glass and producing colon-cleansing products. The rising adoption of thermal energy storage systems in sustainable construction and industrial energy management is driving demand, as sodium sulphate offers excellent thermal stability and heat retention. With energy efficiency becoming a global priority, investments in storage technologies are accelerating, while sustainability initiatives in packaging and green production practices, particularly in glass, are further boosting market growth. The compound's role in minimizing carbon footprints and supporting emerging technologies highlights its increasing relevance across industrial applications.
| Market Scope | |
|---|---|
| Start Year | 2025 |
| Forecast Year | 2026-2035 |
| Start Value | $964.2 Million |
| Forecast Value | $1.3 billion |
| CAGR | 2.7% |
The anhydrous sodium sulphate segment held 67.9% share and is expected to grow at a CAGR of 2.7% through 2035. Its widespread application in powdered detergents, textile dyeing, glass fining, and kraft pulping ensures steady demand, driven by both industrial and export-oriented activities.
The 95-99% purity segment held a 62.3% share in 2025, owing to its balanced impurity levels and versatility. This grade is crucial in container and flat glass production, providing controlled impurities for quality output. It also supports large-scale textile dyeing and printing, benefiting from modernization in textile industries worldwide.
North America Sodium Sulphate Market is anticipated to grow at a CAGR of 2.6% between 2026 and 2035. Growth is fueled by innovations in industrial processes, wastewater recycling, and circular economy initiatives. Emerging applications in bioenergy and biodegradable packaging, combined with rising consumer demand for environmentally friendly products, are driving the adoption of sodium sulphate across industries, particularly in cleaning and personal care sectors.
Key players in the Global Sodium Sulphate Market include Nippon Chemical Industrial Co., Ltd., Sigma-Aldrich, Shikoku Chemicals Corporation, Lenzing Group, Atul Limited, Saltex LLC, Hemadri Chemicals, Cooper Natural Resources Inc., Nikunj Chemicals, Saskatchewan Mining and Minerals, and TCI Chemicals. Companies in the Global Sodium Sulphate Market are employing a mix of strategies to enhance their presence and market share. They are investing heavily in R&D to develop high-purity and application-specific products, expanding production capacities to meet rising global demand, and entering strategic partnerships with industrial end-users. Additionally, firms are emphasizing sustainable sourcing and eco-friendly processes to align with global environmental regulations.
Table of Contents
Chapter 1 Methodology & Scope
- 1.1 Market scope and definition
- 1.2 Research design
- 1.2.1 Research approach
- 1.2.2 Data collection methods
- 1.3 Data mining sources
- 1.3.1 Global
- 1.3.2 Regional/Country
- 1.4 Base estimates and calculations
- 1.4.1 Base year calculation
- 1.4.2 Key trends for market estimation
- 1.5 Primary research and validation
- 1.5.1 Primary sources
- 1.6 Forecast model
- 1.7 Research assumptions and limitations
Chapter 2 Executive Summary
- 2.1 Industry 360° synopsis
- 2.2 Key market trends
- 2.2.1 Regional
- 2.2.2 Product form
- 2.2.3 Purity grade
- 2.2.4 End use industry
- 2.3 TAM Analysis, 2026-2035
- 2.4 CXO perspectives: Strategic imperatives
- 2.4.1 Executive decision points
- 2.4.2 Critical success factors
- 2.5 Future Outlook and Strategic Recommendations
Chapter 3 Industry Insights
- 3.1 Industry ecosystem analysis
- 3.1.1 Supplier landscape
- 3.1.2 Profit margin
- 3.1.3 Value addition at each stage
- 3.1.4 Factor affecting the value chain
- 3.1.5 Disruptions
- 3.2 Industry impact forces
- 3.2.1 Growth drivers
- 3.2.1.1 Growing demand from emerging thermal energy storage applications
- 3.2.1.2 Increasing glass production for sustainable packaging
- 3.2.1.3 Rising pharmaceutical demand for colon cleansing products
- 3.2.2 Industry pitfalls and challenges
- 3.2.2.1 Structural decline in powdered detergent demand (shift to liquids)
- 3.2.2.2 High transportation costs limiting market expansion
- 3.2.3 Market opportunities
- 3.2.3.1 Phase change material market growth for building energy efficiency
- 3.2.3.2 Expansion in sodium-ion battery production
- 3.2.1 Growth drivers
- 3.3 Growth potential analysis
- 3.4 Regulatory landscape
- 3.4.1 North America
- 3.4.2 Europe
- 3.4.3 Asia Pacific
- 3.4.4 Latin America
- 3.4.5 Middle East & Africa
- 3.5 Porter's analysis
- 3.6 PESTEL analysis
- 3.7 Price trends
- 3.7.1 By region
- 3.7.2 By product form
- 3.8 Future market trends
- 3.9 Technology and innovation landscape
- 3.9.1 Current technological trends
- 3.9.2 Emerging technologies
- 3.10 Patent Landscape
- 3.11 Trade statistics (HS code)
( Note: the trade statistics will be provided for key countries only)
- 3.11.1 Major importing countries
- 3.11.2 Major exporting countries
- 3.12 Sustainability and environmental aspects
- 3.12.1 Sustainable practices
- 3.12.2 Waste reduction strategies
- 3.12.3 Energy efficiency in production
- 3.12.4 Eco-friendly initiatives
- 3.13 Carbon footprint consideration
Chapter 4 Competitive Landscape, 2025
- 4.1 Introduction
- 4.2 Company market share analysis
- 4.2.1 By region
- 4.2.1.1 North America
- 4.2.1.2 Europe
- 4.2.1.3 Asia Pacific
- 4.2.1.4 LATAM
- 4.2.1.5 MEA
- 4.2.1 By region
- 4.3 Company matrix analysis
- 4.4 Competitive analysis of major market players
- 4.5 Competitive positioning matrix
- 4.6 Key developments
- 4.6.1 Mergers & acquisitions
- 4.6.2 Partnerships & collaborations
- 4.6.3 New Product Launches
- 4.6.4 Expansion Plans
Chapter 5 Market Estimates and Forecast, By Product Form, 2022-2035 (USD Billion) (Kilo Tons)
- 5.1 Key trends
- 5.2 Anhydrous sodium sulphate
- 5.3 Decahydrate
- 5.4 Heptahydrate
Chapter 6 Market Estimates and Forecast, By Purity Grade, 2022-2035 (USD Billion) (Kilo Tons)
- 6.1 Key trends
- 6.2 95%
- 6.3 95%-99%
- 6.4 ≥ 99.5%
Chapter 7 Market Estimates and Forecast, By End Use Industry, 2022-2035 (USD Billion) (Kilo Tons)
- 7.1 Key trends
- 7.2 Household & personal care
- 7.2.1 Detergents & cleaning products
- 7.2.2 Cosmetics & personal care products
- 7.2.3 Carpet fresheners & deodorizers
- 7.2.4 Others
- 7.3 Construction & building materials
- 7.3.1 Glass manufacturing
- 7.3.2 Concrete additives
- 7.3.3 Thermal energy storage systems
- 7.3.4 Others
- 7.4 Pulp & paper
- 7.5 Textile & apparel
- 7.6 Food & beverage
- 7.6.1 Food processing
- 7.6.2 Beverage packaging
- 7.6.3 Others
- 7.7 Pharmaceutical & healthcare
- 7.7.1 Pharmaceutical manufacturing
- 7.7.2 Medical device & laboratory applications
- 7.7.3 Others
- 7.8 Others
Chapter 8 Market Estimates and Forecast, By Region, 2022-2035 (USD Billion) (Kilo Tons)
- 8.1 Key trends
- 8.2 North America
- 8.2.1 U.S.
- 8.2.2 Canada
- 8.3 Europe
- 8.3.1 Germany
- 8.3.2 UK
- 8.3.3 France
- 8.3.4 Spain
- 8.3.5 Italy
- 8.3.6 Rest of Europe
- 8.4 Asia Pacific
- 8.4.1 China
- 8.4.2 India
- 8.4.3 Japan
- 8.4.4 Australia
- 8.4.5 South Korea
- 8.4.6 Rest of Asia Pacific
- 8.5 Latin America
- 8.5.1 Brazil
- 8.5.2 Mexico
- 8.5.3 Argentina
- 8.5.4 Rest of Latin America
- 8.6 Middle East and Africa
- 8.6.1 Saudi Arabia
- 8.6.2 South Africa
- 8.6.3 UAE
- 8.6.4 Rest of Middle East and Africa
Chapter 9 Company Profiles
- 9.1 Atul Limited
- 9.2 Cooper Natural Resources Inc.
- 9.3 Hemadri Chemicals
- 9.4 Lenzing Group
- 9.5 Nikunj Chemicals
- 9.6 Nippon Chemical Industrial Co., Ltd.
- 9.7 Saltex LLC
- 9.8 Saskatchewan Mining and Minerals
- 9.9 Shikoku Chemicals Corporation
- 9.10 Sigma-Aldrich
- 9.11 TCI Chemicals
 硫酸鈉市場:2026-2032年全球市場預測(依產品類型、純度等級、形態、通路、應用及最終用途產業分類)
 全球硫酸鈉市場報告、表現及預測(2021-2032年)
 全球硫酸鈉市場規模、佔有率、趨勢和成長分析報告(2026-2034年)
 日本硫酸鈉市場規模、佔有率、趨勢和預測:按性質、應用和地區分類,2026-2034年
 硫酸鈉市場規模、佔有率及成長分析(按應用、產品、形態及地區分類)-2026-2033年產業預測
 硫酸鈉:全球市佔率及排名、總收入及需求預測(2025-2031 年)全球硫酸鈉市場規模(按產品、應用、地區和預測)
 全球硫酸鈉市場:市場規模、佔有率、趨勢分析(按特點、最終用途和地區)、細分市場預測(2025-2030 年)
 硫酸鈉市場報告:2031 年趨勢、預測與競爭分析
 硫酸鈉市場規模、佔有率和成長分析(按類型、特性、最終用戶和地區)- 產業預測 2025-2032