

 |
市場調查報告書
商品編碼
1913295
無伺服器架構市場機會、成長要素、產業趨勢分析及預測(2026-2035年)Serverless Architecture Market Opportunity, Growth Drivers, Industry Trend Analysis, and Forecast 2026 - 2035 |
||||||
全球無伺服器架構市場預計到 2025 年將達到 182 億美元,到 2035 年將達到 1,569 億美元,年複合成長率為 24.1%。
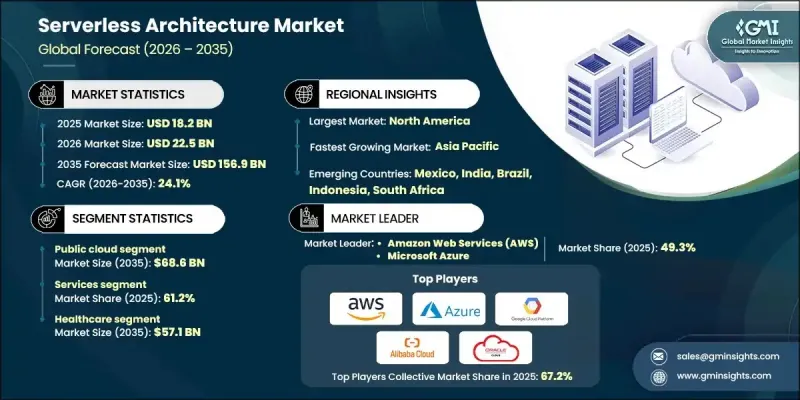
無伺服器架構市場的成長主要得益於人工智慧和機器學習的日益融合、即時分析的普及,以及金融、醫療保健和物聯網等產業對現代工作負載的廣泛應用。企業正在遷移到無伺服器技術,以利用其靈活且以營運成本主導的模式來最佳化營運效率。向微服務和雲端原生設計的轉變實現了敏捷開發、模組化應用部署、獨立服務擴展和更高的資源利用率,這些都與無伺服器執行模型相契合。企業現在正應用無伺服器框架來訓練複雜的人工智慧模型、運行生成式模擬、進行風險建模以及處理高效能運算任務。雲端原生架構與先進運算能力的無縫結合正在推動其廣泛應用,尤其是在那些需要自動化系統來運行次世代應用程式的企業中。
| 市場覆蓋範圍 | |
|---|---|
| 開始年份 | 2025 |
| 預測年份 | 2026-2035 |
| 起始值 | 182億美元 |
| 預測金額 | 1569億美元 |
| 複合年成長率 | 24.1% |
由於其柔軟性、成本效益以及與人工智慧、分析和事件驅動型工作負載的整合,預計到2035年,公共雲端市場規模將達到686億美元。企業越來越依賴公共雲端解決方案,因為它們使企業能夠快速部署應用程式,而無需大量的領先基礎設施投資。計量收費模式降低了營運成本,同時也使企業能夠根據需求動態擴展資源。
到2025年,服務領域將佔據61.2%的市場佔有率,這反映出市場對託管式無伺服器服務、諮詢和整合支援的需求不斷成長。服務供應商正致力於建立功能豐富的平台,以支援人工智慧、分析和多重雲端部署,從而推動技術應用並簡化營運。
預計到2025年,北美無伺服器架構市場將佔據33.5%的市場佔有率,並在2035年之前以24.9%的複合年成長率成長。該地區正經歷快速的普及,這主要得益於企業數位轉型、人工智慧/機器學習整合以及可擴展、具成本效益雲端解決方案的需求。對GPU加速的無伺服器平台的投資正在推動各行各業實現高效能、即時運算。
目錄
第1章調查方法
第2章執行摘要
第3章業界考察
- 生態系分析
- 供應商情況
- 利潤率分析
- 成本結構
- 每個階段的附加價值
- 影響價值鏈的因素
- 中斷
- 產業影響因素
- 促進要素
- 人工智慧/機器學習整合、即時數據處理和現代工作負載
- 各行各業(包括金融、醫療保健和物聯網)的跨領域應用需求推動了這一趨勢。
- 成本效益和資源最佳化(重點關注營運支出(OPEX)而非資本支出(CAPEX))
- 向微服務/雲端原生架構轉型
- 多重雲端和混合雲端的日益普及提高了柔軟性。
- 產業潛在風險與挑戰
- 對底層基礎設施的可見性和控制力有限
- 與主要雲端服務供應商的供應商鎖定風險
- 市場機遇
- 無伺服器技術在邊緣運算和分散式架構中的興起
- 以人工智慧代理程式和自動化為導向的 FaaS(函數即服務)解決方案的成長
- 對整合無伺服器後端的低程式碼和無程式碼平台的需求日益成長
- 在 DevOps 和 AIOps 管線中採用無伺服器架構以實現持續自動化
- 促進要素
- 成長潛力分析
- 監管環境
- 北美洲
- 歐洲
- 亞太地區
- 拉丁美洲
- 中東和非洲
- 波特五力分析
- PESTEL 分析
- 科技與創新趨勢
- 當前技術趨勢
- 新興技術
- 新興經營模式
- 合規要求
- 專利和智慧財產權分析
- 地緣政治和貿易趨勢
第4章 競爭情勢
- 介紹
- 公司市佔率分析
- 按地區
- 北美洲
- 歐洲
- 亞太地區
- 拉丁美洲
- 中東和非洲
- 按地區
- 主要企業的競爭標竿分析
- 財務績效比較
- 收入
- 利潤率
- 研究與開發
- 產品系列比較
- 產品線的廣度
- 科技
- 創新
- 按地區比較存在狀況
- 全球擴張分析
- 服務網路覆蓋
- 按地區分類的市場滲透率
- 競爭定位矩陣
- 領導企業
- 受讓人
- 追蹤者
- 小眾玩家
- 戰略展望矩陣
- 財務績效比較
- 2022-2025 年主要發展動態
- 併購
- 合作夥伴關係和合資企業
- 技術進步
- 擴張與投資策略
- 數位轉型計劃
- 新興/Start-Ups競賽的趨勢
第5章 依服務類型分類的市場估算與預測,2022-2035年
- Function as a Service(FaaS)
- 後端即服務 (BaaS)
第6章 依實施類型分類的市場估計與預測,2022-2035年
- 公共雲端
- 私有雲端
- 混合雲端
第7章 依公司規模分類的市場估計與預測,2022-2035年
- 中小企業
- 主要企業
第8章 按組件分類的市場估算與預測,2022-2035年
- 服務
- 專業服務
- 諮詢服務
- 培訓和教育
- 整合和測試服務
- 支援與維護
- 託管服務
- 專業服務
- 平台
第9章 2022-2035年各產業市場估算與預測
- 資訊科技和電信
- 衛生保健
- 零售與電子商務
- 銀行、金融服務和保險(BFSI)
- 政府
- 教育
- 其他
第10章 2022-2035年各地區市場估計與預測
- 北美洲
- 美國
- 加拿大
- 歐洲
- 德國
- 英國
- 法國
- 義大利
- 西班牙
- 荷蘭
- 亞太地區
- 中國
- 印度
- 日本
- 澳洲
- 韓國
- 拉丁美洲
- 巴西
- 墨西哥
- 阿根廷
- 中東和非洲
- 南非
- 沙烏地阿拉伯
- 阿拉伯聯合大公國
第11章:公司簡介
- 主要企業
- Amazon Web Services(AWS)
- Microsoft Azure
- Google Cloud Platform(GCP)
- Oracle Cloud
- 按地區分類的主要企業
- 北美洲
- IBM Cloud
- Red Hat(IBM)
- Salesforce
- 歐洲
- VMware
- TIBCO Software
- Deloitte
- 亞太地區
- Alibaba Cloud
- Fujitsu
- SAP
- 北美洲
- 小眾玩家/顛覆者
- DigitalOcean
- Akamai Technologies
- Netlify
- Cloudflare
- Couchbase
- Postman
- Tencent Cloud
- Hewlett Packard Enterprise(HPE)
The Global Serverless Architecture Market was valued at USD 18.2 billion in 2025 and is estimated to grow at a CAGR of 24.1% to reach USD 156.9 billion by 2035.
The growth of the serverless architecture market is being propelled by the increasing integration of AI and machine learning, real-time analytics, and the adoption of modern workloads across industries such as finance, healthcare, and IoT. Organizations are shifting toward serverless technologies to leverage flexible, OPEX-driven models that optimize operational efficiency. The move to microservices and cloud-native designs enables agile development, modular application deployment, independent service scaling, and better resource utilization, which aligns with serverless execution models. Enterprises are now applying serverless frameworks to train complex AI models, run generative simulations, perform risk modeling, and handle high-performance computing tasks. The seamless combination of cloud-native architecture and advanced computing capabilities is driving widespread adoption, particularly among businesses that require automated systems for next-generation applications.
| Market Scope | |
|---|---|
| Start Year | 2025 |
| Forecast Year | 2026-2035 |
| Start Value | $18.2 Billion |
| Forecast Value | $156.9 Billion |
| CAGR | 24.1% |
The public cloud segment is expected to reach USD 68.6 billion by 2035, driven by its flexibility, cost efficiency, and integration with AI, analytics, and event-driven workloads. Businesses are increasingly relying on public cloud solutions because they allow rapid deployment of applications without the need for heavy upfront infrastructure investments. The pay-as-you-go model reduces operational costs while enabling organizations to scale resources dynamically based on demand.
The services segment accounted for a 61.2% share in 2025, reflecting growing demand for managed serverless services, consulting, and integration support. Providers are focusing on creating feature-rich platforms that support AI, analytics, and multi-cloud deployments to facilitate adoption and operational efficiency.
North America Serverless Architecture Market held a 33.5% share in 2025 and is forecasted to grow at a CAGR of 24.9% through 2035. The region is witnessing rapid adoption due to enterprise digital transformation, AI/ML integration, and the need for scalable, cost-effective cloud solutions. Investments in GPU-accelerated serverless platforms are enabling high-performance, real-time computing for a range of industries.
Key players operating in the Global Serverless Architecture Market include Microsoft Azure, Amazon Web Services (AWS), Google Cloud Platform (GCP), IBM Cloud, Oracle Cloud, Alibaba Cloud, Red Hat (IBM), Salesforce, and Fujitsu. Companies in the Global Serverless Architecture Market are focusing on several strategies to strengthen their position. They are investing in research and development to enhance platform capabilities, including AI and analytics integration, multi-cloud support, and real-time processing features. Strategic partnerships with enterprise clients and cloud service providers help expand reach and market penetration. Firms are offering managed services, consulting, and integration support to simplify adoption for businesses.
Table of Contents
Chapter 1 Methodology
- 1.1 Market scope and definition
- 1.2 Research design
- 1.2.1 Research approach
- 1.2.2 Data collection methods
- 1.3 Data mining sources
- 1.3.1 Global
- 1.3.2 Regional/Country
- 1.4 Base estimates and calculations
- 1.4.1 Base year calculation
- 1.4.2 Key trends for market estimation
- 1.5 Primary research and validation
- 1.5.1 Primary sources
- 1.6 Forecast model
- 1.7 Research assumptions and limitations
Chapter 2 Executive Summary
- 2.1 Industry 360° synopsis, 2021 - 2034
- 2.2 Key market trends
- 2.2.1 Service type trends
- 2.2.2 Deployment mode trends
- 2.2.3 Platform trends
- 2.2.4 Organization Size trends
- 2.2.5 Component trends
- 2.2.6 Industry vertical trends
- 2.2.7 Regional trends
- 2.3 TAM analysis, 2025-2034
- 2.4 CXO perspectives: Strategic imperatives
- 2.4.1 Executive decision points
- 2.4.2 Critical success factors
- 2.5 Future outlook and strategic recommendations
Chapter 3 Industry Insights
- 3.1 Industry ecosystem analysis
- 3.1.1 Supplier landscape
- 3.1.2 Profit margin analysis
- 3.1.3 Cost structure
- 3.1.4 Value addition at each stage
- 3.1.5 Factor affecting the value chain
- 3.1.6 Disruptions
- 3.2 Industry impact forces
- 3.2.1 Growth drivers
- 3.2.1.1 Integration with AI/ML, real-time data processing and modern workloads
- 3.2.1.2 Demand from cross-industry adoption across sectors (e.g. finance, healthcare, IoT)
- 3.2.1.3 Cost efficiency and resource-optimization (OPEX over CAPEX)
- 3.2.1.4 Shift toward microservices / cloud-native architectures
- 3.2.1.5 Rising multi-cloud and hybrid-cloud adoption enabling flexibility
- 3.2.2 Industry pitfalls and challenges
- 3.2.2.1 Limited visibility and control over underlying infrastructure
- 3.2.2.2 Vendor lock-in risks across major cloud providers
- 3.2.3 Market opportunities
- 3.2.3.1 Expansion of serverless in edge computing and distributed architectures
- 3.2.3.2 Growth of function-as-a-service solutions for AI agents and automation
- 3.2.3.3 Rising demand for low-code and no-code platforms integrating serverless backends
- 3.2.3.4 Adoption of serverless in DevOps and AIOps pipelines for continuous automation
- 3.2.1 Growth drivers
- 3.3 Growth potential analysis
- 3.4 Regulatory landscape
- 3.4.1 North America
- 3.4.2 Europe
- 3.4.3 Asia Pacific
- 3.4.4 Latin America
- 3.4.5 Middle East & Africa
- 3.5 Porter's analysis
- 3.6 PESTEL analysis
- 3.7 Technology and innovation landscape
- 3.7.1 Current technological trends
- 3.7.2 Emerging technologies
- 3.8 Emerging business models
- 3.9 Compliance requirements
- 3.10 Patent and IP analysis
- 3.11 Geopolitical and trade dynamics
Chapter 4 Competitive Landscape, 2025
- 4.1 Introduction
- 4.2 Company market share analysis
- 4.2.1 By region
- 4.2.1.1 North America
- 4.2.1.2 Europe
- 4.2.1.3 Asia Pacific
- 4.2.1.4 Latin America
- 4.2.1.5 Middle East & Africa
- 4.2.1 By region
- 4.3 Competitive benchmarking of key players
- 4.3.1 Financial performance comparison
- 4.3.1.1 Revenue
- 4.3.1.2 Profit margin
- 4.3.1.3 R&D
- 4.3.2 Product portfolio comparison
- 4.3.2.1 Product range breadth
- 4.3.2.2 Technology
- 4.3.2.3 Innovation
- 4.3.3 Geographic presence comparison
- 4.3.3.1 Global footprint analysis
- 4.3.3.2 Service network coverage
- 4.3.3.3 Market penetration by region
- 4.3.4 Competitive positioning matrix
- 4.3.4.1 Leaders
- 4.3.4.2 Challengers
- 4.3.4.3 Followers
- 4.3.4.4 Niche players
- 4.3.5 Strategic outlook matrix
- 4.3.1 Financial performance comparison
- 4.4 Key developments, 2022-2025
- 4.4.1 Mergers and acquisitions
- 4.4.2 Partnerships and collaborations
- 4.4.3 Technological advancements
- 4.4.4 Expansion and investment strategies
- 4.4.5 Digital transformation initiatives
- 4.5 Emerging/ startup competitors landscape
Chapter 5 Market Estimates and Forecast, By Service Type, 2022 - 2035 (USD Million)
- 5.1 Key trends
- 5.2 Function as a service (FaaS)
- 5.3 Backend as a service (BaaS)
Chapter 6 Market Estimates and Forecast, By Deployment Mode, 2022 - 2035 (USD Million)
- 6.1 Key trends
- 6.2 Public cloud
- 6.3 Private cloud
- 6.4 Hybrid cloud
Chapter 7 Market Estimates and Forecast, By Organization Size, 2022 - 2035 (USD Million)
- 7.1 Key trends
- 7.2 Small and medium enterprises (SME)
- 7.3 Large enterprises
Chapter 8 Market Estimates and Forecast, By Component, 2022 - 2035 (USD Million)
- 8.1 Key trends
- 8.2 Services
- 8.2.1 Professional Services
- 8.2.1.1 Consulting Services
- 8.2.1.2 Training and Education
- 8.2.1.3 Integration and Testing Services
- 8.2.1.4 Support and Maintenance
- 8.2.2 Managed Services
- 8.2.1 Professional Services
- 8.3 Platform
Chapter 9 Market Estimates and Forecast, By Industry Vertical, 2022 - 2035 (USD Million)
- 9.1 Key trends
- 9.2 IT and Telecom
- 9.3 Healthcare
- 9.4 Retail and E-commerce
- 9.5 Banking, Financial Services, and Insurance (BFSI)
- 9.6 Government
- 9.7 Education
- 9.8 Others
Chapter 10 Market Estimates & Forecast, By Region, 2022 - 2035 (USD Million)
- 10.1 Key trends
- 10.2 North America
- 10.2.1 U.S.
- 10.2.2 Canada
- 10.3 Europe
- 10.3.1 Germany
- 10.3.2 UK
- 10.3.3 France
- 10.3.4 Italy
- 10.3.5 Spain
- 10.3.6 Netherlands
- 10.4 Asia Pacific
- 10.4.1 China
- 10.4.2 India
- 10.4.3 Japan
- 10.4.4 Australia
- 10.4.5 South Korea
- 10.5 Latin America
- 10.5.1 Brazil
- 10.5.2 Mexico
- 10.5.3 Argentina
- 10.6 MEA
- 10.6.1 South Africa
- 10.6.2 Saudi Arabia
- 10.6.3 UAE
Chapter 11 Company Profiles
- 11.1 Global Key Players
- 11.1.1 Amazon Web Services (AWS)
- 11.1.2 Microsoft Azure
- 11.1.3 Google Cloud Platform (GCP)
- 11.1.4 Oracle Cloud
- 11.2 Regional Key Players
- 11.2.1 North America
- 11.2.1.1 IBM Cloud
- 11.2.1.2 Red Hat (IBM)
- 11.2.1.3 Salesforce
- 11.2.2 Europe
- 11.2.2.1 VMware
- 11.2.2.2 TIBCO Software
- 11.2.2.3 Deloitte
- 11.2.3 APAC
- 11.2.3.1 Alibaba Cloud
- 11.2.3.2 Fujitsu
- 11.2.3.3 SAP
- 11.2.1 North America
- 11.3 Niche Players / Disruptors
- 11.3.1 DigitalOcean
- 11.3.2 Akamai Technologies
- 11.3.3 Netlify
- 11.3.4 Cloudflare
- 11.3.5 Couchbase
- 11.3.6 Postman
- 11.3.7 Tencent Cloud
- 11.3.8 Hewlett Packard Enterprise (HPE)
 無伺服器架構市場:2026-2032 年全球市場預測,按元件、服務類型、部署模型、組織規模和產業分類。
 2026年全球無伺服器容器市場報告2026年全球無伺服器架構市場報告
 無伺服器架構全球市場規模、佔有率、趨勢和成長分析報告(2026-2034)
 無伺服器架構市場規模、佔有率和成長分析(按部署類型、組織規模、垂直產業和地區分類)-2026年至2033年產業預測
 全球無伺服器架構市場規模、佔有率、趨勢分析報告(按組織規模、部署、服務、產業、地區、展望與預測,2024-2031 年)
 無伺服器架構市場規模、佔有率、趨勢分析報告:按服務、按部署、按組織規模、按行業、按地區、細分市場預測,2024-2030 年