


 |
市場調查報告書
商品編碼
1892913
自行車電腦市場機會、成長促進因素、產業趨勢分析及預測(2026-2035年)Bike Computer Market Opportunity, Growth Drivers, Industry Trend Analysis, and Forecast 2026 - 2035 |
||||||
2025 年全球自行車電腦市場價值為 7.252 億美元,預計到 2035 年將以 5.9% 的複合年成長率成長至 12.6 億美元。
人們對個人健身的興趣日益濃厚,科技也越來越融入日常生活,這持續推高了對能夠追蹤速度、踏頻、心率和其他運動指標的設備的需求。騎乘已成為全球注重健康人士的首選運動,尤其是在人們日益關注與生活方式相關的健康問題(例如糖尿病、心臟併發症和體重管理)的情況下,騎乘更成為一種積極的生活方式。環境因素也發揮重要作用,各國政府都在大力推廣騎行,以減少碳排放並緩解交通堵塞。數位系統的進步以及人工智慧和機器學習在行動應用領域日益廣泛的應用,有望為市場帶來更智慧、更直覺的自行車碼表,從而增強其吸引力。自行車賽事和公共健康計畫的日益普及,也進一步推動了能夠增強訓練和運動表現監測的設備的應用。隨著全球對健身科技的認知不斷提高,對互聯智慧自行車碼表的整體需求預計將加速成長。
| 市場範圍 | |
|---|---|
| 起始年份 | 2025 |
| 預測年份 | 2026-2035 |
| 起始值 | 7.252億美元 |
| 預測值 | 12.6億美元 |
| 複合年成長率 | 5.9% |
2024年,基於GPS的導航設備市佔率達到55.2%。這些設備已經遠遠超越了早期的導航工具,如今能夠提供騎乘者期望的即時詳細騎乘數據。其卓越的地圖功能使其成為比非GPS導航設備更受歡迎的選擇,這與全球範圍內騎行在休閒、通勤和鍛煉方面的蓬勃發展趨勢相契合。隨著消費者期望的不斷提高,騎乘者也持續尋求更精確的距離、速度及相關數據追蹤。
到2034年,高階自行車碼表市場將以7.1%的複合年成長率成長,這主要得益於人工智慧增強分析、高階健康追蹤和智慧電池最佳化等功能。各大品牌正密切關注用戶偏好趨勢,不斷改進產品並推出更多整合功能。隨著消費者可支配收入的增加,他們越來越傾向於選擇功能更強大的高階設備,這也推動了該細分市場的成長。
受互聯騎乘技術的快速發展和自行車使用者群體不斷擴大的推動,美國自行車電腦市場預計到2025年將達到1.852億美元。多家公司透過推出新一代功能和樹立產品創新標桿,持續引領美國市場的發展趨勢。
目錄
第1章:方法論
第2章:執行概要
第3章:行業洞察
- 產業生態系分析
- 供應商格局
- 利潤率
- 成本結構
- 每個階段的價值增加
- 影響價值鏈的因素
- 中斷
- 產業影響因素
- 成長促進因素
- 全球自行車參與人數成長與健康意識趨勢
- 電動自行車市場擴張及整合顯示需求
- 職業自行車運動的影響及UCI世界巡迴賽技術應用
- 智慧城市基礎建設與自行車融合
- 產業陷阱與挑戰
- 智慧型手機替代品的威脅及免費應用程式替代方案
- 城市市場中的盜竊風險和設備安全問題
- 市場機遇
- 新興市場滲透
- 電動自行車整合及OEM合作夥伴關係拓展
- 礫石路和探險騎行細分市場擴張
- 智慧城市與市政自行車資料平台整合
- 成長促進因素
- 成長潛力分析
- 監管環境
- 北美洲
- 歐洲
- 亞太地區
- 拉丁美洲
- 中東和非洲
- 波特的分析
- PESTEL 分析
- 技術與創新格局
- 當前技術趨勢
- 新興技術
- 技術路線圖與演進
- 技術採納生命週期分析
- 價格趨勢
- 按地區
- 依產品
- 專利分析
- 智慧城市與基礎建設一體化
- 用於交通管理的自行車偵測技術
- 自行車電腦與交通基礎建設的整合
- 市政自行車資料平台
- 製造商在智慧城市合作的機會
- 感測器生態系統及配件市場
- 感測器及收入貢獻
- 速度和踏頻感測器
- 心率監測器
- 功率計
- 新興感測器類別
- 消費者行為與購買決策分析
- 購買決策因素及功能優先排序
- 品牌忠誠度與轉換行為模式
- 職業自行車運動和運動員代言的影響
- 線上購物偏好與線下購物偏好
- 消費者趨勢與偏好演變
- 轉向觸控螢幕介面而非按鍵介面
- 導航功能重要性成長
- 智慧型手機整合預期
- 電池續航力是關鍵的購買因素
- 零售通路動態與經銷策略
- 專業自行車零售市佔率及趨勢
- 在線直接面對消費者 (DTC) 的成長
- 大眾市場零售滲透
- OEM自行車捆綁銷售
- 產品生命週期及使用模式分析
- 平均產品壽命和耐用性
- 韌體更新頻率和長期支持
- 按使用者群體分類的使用強度
- 季節性使用變化和天氣影響
- 未來展望與機遇
第4章:競爭格局
- 介紹
- 公司市佔率分析
- 北美洲
- 歐洲
- 亞太地區
- 拉丁美洲
- MEA
- 主要市場參與者的競爭分析
- 競爭定位矩陣
- 戰略展望矩陣
- 關鍵進展
- 併購
- 合作夥伴關係與合作
- 新產品發布
- 擴張計劃和資金
- 供應商選擇標準
第5章:市場估算與預測:依產品分類,2022-2035年
- 有線
- 無線的
- 基於GPS的
- 太陽能驅動
- 其他
第6章:市場估算與預測:依價格區間分類,2022-2035年
- 基本的
- 中檔
- 優質的
第7章:市場估算與預測:依感測器類型分類,2022-2035年
- 後輪感應器
- 速度/踏頻感測器
- 梯度感測器
- 心率感測器
第8章:市場估算與預測:以連結方式分類,2022-2035年
- 藍牙
- 無線上網
- ANT+
- 其他
第9章:市場估價與預測:依自行車類型分類,2022-2035年
- 登山車
- 公路自行車
- 城市自行車
- 電動自行車
- 礫石自行車
第10章:市場估價與預測:依配銷通路分類,2022-2035年
- 線上
- 離線
第11章:市場估計與預測:依應用領域分類,2022-2035年
- 體育運動
- 健身與通勤
- 休閒/娛樂
第12章:市場估算與預測:依最終用途分類,2022-2035年
- 個人消費者
- 自行車租賃/車隊營運商
- 職業球隊/俱樂部
第13章:市場估計與預測:依地區分類,2022-2035年
- 北美洲
- 美國
- 加拿大
- 歐洲
- 德國
- 英國
- 法國
- 義大利
- 西班牙
- 俄羅斯
- 北歐
- 比荷盧經濟聯盟
- 亞太地區
- 中國
- 印度
- 日本
- 韓國
- 澳新銀行
- 新加坡
- 馬來西亞
- 印尼
- 越南
- 泰國
- 拉丁美洲
- 巴西
- 墨西哥
- 阿根廷
- 哥倫比亞
- MEA
- 南非
- 沙烏地阿拉伯
- 阿拉伯聯合大公國
第14章:公司簡介
- 全球公司
- Garmin
- Wahoo Fitness
- Polar Electro Oy
- Hammerhead
- Stages Cycling
- Lezyne
- 區域公司
- SIGMA
- Bryton
- CatEye
- Giant Manufacturing
- Specialized Bicycle Components
- Bosch eBike Systems
- Shimano
- Mio Technology
- 新興公司
- Coospo
- iGPSPORT
- Magene
- Coros
- Suunto
- Omata
- Beeline
- Xplova
- Cycplus
- Trek Bicycle Corporation
- Cannondale
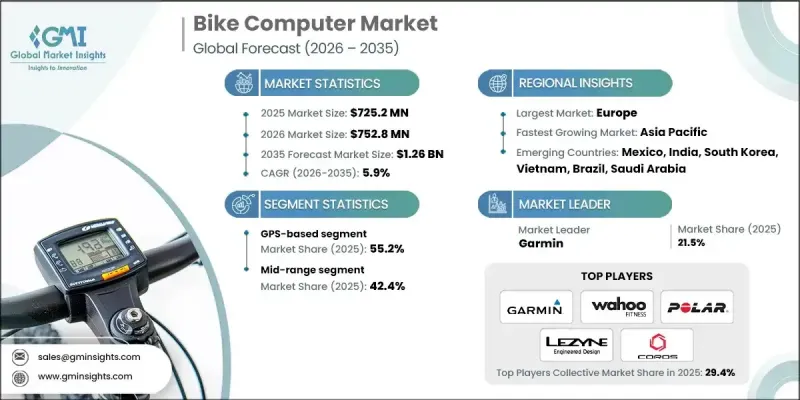
The Global Bike Computer Market was valued at USD 725.2 million in 2025 and is estimated to grow at a CAGR of 5.9% to reach USD 1.26 billion by 2035.
Growing interest in personal fitness and increasing integration of technology into everyday routines continue to elevate demand for devices that track speed, cadence, heart rate, and other performance indicators. Cycling has become a preferred activity for health-conscious individuals around the world, especially as concerns linked to lifestyle-related conditions, including diabetes, heart complications, and weight management, drive people toward more active habits. Environmental priorities also play a major role, as governments across multiple regions promote cycling to help lower carbon emissions and ease traffic congestion. Advancements in digital systems and the expanding role of AI and machine learning across mobility applications are expected to bring smarter, more intuitive bike computers to the market, strengthening their appeal. The growing adoption of cycling events and public wellness programs further supports the use of devices that enhance training and performance monitoring. As global awareness around fitness technology continues to rise, the overall demand for connected and intelligent bike computers is expected to accelerate.
| Market Scope | |
|---|---|
| Start Year | 2025 |
| Forecast Year | 2026-2035 |
| Start Value | $725.2 Million |
| Forecast Value | $1.26 Billion |
| CAGR | 5.9% |
The GPS-based segment held a 55.2% share in 2024. These devices have evolved far beyond earlier navigation tools and now provide detailed ride metrics that cyclists expect in real time. Their superior mapping capabilities make them the preferred choice compared with non-GPS alternatives, aligning with the worldwide growth of cycling for recreation, commuting, and exercise. As consumer expectations increase, riders consistently seek more accurate tracking of distance, speed, and related metrics.
The premium-priced bike computers segment will grow at a CAGR of 7.1% by 2034, owing to features such as AI-enhanced analytics, advanced health tracking, and smart battery optimization. Brands are concentrating on user preference trends to refine their offerings and introduce more integrated functions. This segment benefits from rising disposable incomes as buyers increasingly choose higher-end devices with extended capabilities.
U.S Bike Computer Market reached USD 185.2 million in 2025, supported by rapid growth in connected cycling technologies and an expanding population of bicycle users. Several companies continue to influence trends in the country by introducing next-generation features and setting benchmarks in product innovation.
Leading companies in the Bike Computer Market include Bryton, CatEye, COROS Wearables, Garmin, Hammerhead, Lezyne, Magene, Polar, Sigma, and Wahoo Fitness. Manufacturers in the bike computer industry are strengthening their market foothold by emphasizing innovation in data analytics, connectivity, and sensor technology. Many companies are deepening the integration of AI-driven insights to offer more accurate performance tracking and personalized ride analysis. Expanding product ecosystems through companion apps and wireless accessories helps brands build long-term engagement with cyclists. Firms are also focusing on lightweight designs, improved battery efficiency, and enhanced durability to appeal to both recreational and performance-oriented users. Strategic partnerships with cycling communities and professional teams help boost brand visibility, while targeted investments in premium product lines cater to consumers shifting toward high-end devices.
Table of Contents
Chapter 1 Methodology
- 1.1 Market scope and definition
- 1.2 Research design
- 1.2.1 Research approach
- 1.2.2 Data collection methods
- 1.3 Data mining sources
- 1.3.1 Global
- 1.3.2 Regional/Country
- 1.4 Base estimates and calculations
- 1.4.1 Base year calculation
- 1.4.2 Key trends for market estimation
- 1.5 Primary research and validation
- 1.5.1 Primary sources
- 1.6 Forecast
- 1.7 Research assumptions and limitations
Chapter 2 Executive Summary
- 2.1 Industry 3600 synopsis
- 2.2 Key market trends
- 2.2.1 Regional
- 2.2.2 Product
- 2.2.3 Price Range
- 2.2.4 Sensor
- 2.2.5 Connectivity
- 2.2.6 Bike
- 2.2.7 Distribution Channel
- 2.2.8 Application
- 2.2.9 End Use
- 2.3 TAM analysis, 2026-2035
- 2.4 CXO perspectives: Strategic imperatives
- 2.4.1 Executive decision points
- 2.4.2 Critical success factors
- 2.5 Future outlook and recommendations
Chapter 3 Industry Insights
- 3.1 Industry ecosystem analysis
- 3.1.1 Supplier landscape
- 3.1.2 Profit margin
- 3.1.3 Cost structure
- 3.1.4 Value addition at each stage
- 3.1.5 Factor affecting the value chain
- 3.1.6 Disruptions
- 3.2 Industry impact forces
- 3.2.1 Growth drivers
- 3.2.1.1 Global cycling participation growth & health consciousness trends
- 3.2.1.2 E-bike market expansion & integrated display demand
- 3.2.1.3 Professional cycling influence & UCI worldtour technology adoption
- 3.2.1.4 Smart city infrastructure development & cycling integration
- 3.2.2 Industry pitfalls and challenges
- 3.2.2.1 Smartphone substitution threat & free app alternatives
- 3.2.2.2 Theft risk & device security concerns in urban markets
- 3.2.3 Market opportunities
- 3.2.3.1 Emerging market penetration
- 3.2.3.2 E-bike integration & OEM partnership expansion
- 3.2.3.3 Gravel & adventure cycling segment expansion
- 3.2.3.4 Smart city & municipal cycling data platform integration
- 3.2.1 Growth drivers
- 3.3 Growth potential analysis
- 3.4 Regulatory landscape
- 3.4.1 North America
- 3.4.2 Europe
- 3.4.3 Asia Pacific
- 3.4.4 Latin America
- 3.4.5 Middle East & Africa
- 3.5 Porter's analysis
- 3.6 PESTEL analysis
- 3.7 Technology and innovation landscape
- 3.7.1 Current technological trends
- 3.7.2 Emerging technologies
- 3.7.3 Technology roadmaps & evolution
- 3.7.4 Technology adoption lifecycle analysis
- 3.8 Price trends
- 3.8.1 By region
- 3.8.2 By product
- 3.9 Patent analysis
- 3.10 Smart city & infrastructure integration
- 3.10.1 Bicycle detection technologies for traffic management
- 3.10.2 Bike computer integration with traffic infrastructure
- 3.10.3 Municipal cycling data platforms
- 3.10.4 Smart city partnership opportunities for manufacturers
- 3.11 Sensor ecosystem & accessory market
- 3.11.1 Sensor market overview & revenue contribution
- 3.11.2 Speed & cadence sensors
- 3.11.3 Heart rate monitors
- 3.11.4 Power meters
- 3.11.5 Emerging sensor categories
- 3.12 Consumer behavior & purchase decision analysis
- 3.12.1 Purchase decision factors & feature prioritization
- 3.12.2 Brand loyalty & switching behavior patterns
- 3.12.3 Influence of professional cycling & athlete endorsements
- 3.12.4 Online vs in-store purchase preferences
- 3.13 Consumer trends & preference evolution
- 3.13.1 Shift toward touchscreen vs button interfaces
- 3.13.2 Navigation feature importance growth
- 3.13.3 Smartphone integration expectations
- 3.13.4 Battery life as critical purchase factor
- 3.14 Retail channel dynamics & distribution strategies
- 3.14.1 Specialty cycling retail market share & trends
- 3.14.2 Online direct-to-consumer (DTC) growth
- 3.14.3 Mass market retail penetration
- 3.14.4 OEM bundling with bicycle purchases
- 3.15 Product lifecycle & usage pattern analysis
- 3.15.1 Average product lifespan & durability
- 3.15.2 Firmware update frequency & long-term support
- 3.15.3 Usage intensity by user segment
- 3.15.4 Seasonal usage variations & weather impact
- 3.16 Future outlook & opportunities
Chapter 4 Competitive Landscape, 2025
- 4.1 Introduction
- 4.2 Company market share analysis
- 4.2.1 North America
- 4.2.2 Europe
- 4.2.3 Asia Pacific
- 4.2.4 LATAM
- 4.2.5 MEA
- 4.3 Competitive analysis of major market players
- 4.4 Competitive positioning matrix
- 4.5 Strategic outlook matrix
- 4.6 Key developments
- 4.6.1 Mergers & acquisitions
- 4.6.2 Partnerships & collaborations
- 4.6.3 New product launches
- 4.6.4 Expansion plans and funding
- 4.7 Vendor selection criteria
Chapter 5 Market Estimates & Forecast, By Product, 2022 - 2035 ($Mn, Units)
- 5.1 Key trends
- 5.2 Wired
- 5.3 Wireless
- 5.4 GPS-based
- 5.4.1 Solar-powered
- 5.4.2 Others
Chapter 6 Market Estimates & Forecast, By Price Range, 2022 - 2035 ($Mn, Units)
- 6.1 Key trends
- 6.2 Basic
- 6.3 Mid-range
- 6.4 Premium
Chapter 7 Market Estimates & Forecast, By Sensor, 2022 - 2035 ($Mn, Units)
- 7.1 Key trends
- 7.2 Rear Wheel Sensor
- 7.3 Speed/Cadence Sensor
- 7.4 Gradient Sensor
- 7.5 Heart Rate Sensor
Chapter 8 Market Estimates & Forecast, By Connectivity, 2022 - 2035 ($Mn, Units)
- 8.1 Key trends
- 8.2 Bluetooth
- 8.3 Wi-Fi
- 8.4 ANT+
- 8.5 Others
Chapter 9 Market Estimates & Forecast, By Bike, 2022 - 2035 ($Mn, Units)
- 9.1 Key trends
- 9.2 Mountain bike
- 9.3 Road bike
- 9.4 Urban bike
- 9.5 E-bike
- 9.6 Gravel bike
Chapter 10 Market Estimates & Forecast, By Distribution Channel, 2022 - 2035 ($Mn, Units)
- 10.1 Key trends
- 10.2 Online
- 10.3 Offline
Chapter 11 Market Estimates & Forecast, By Application, 2022 - 2035 ($Mn, Units)
- 11.1 Key trends
- 11.2 Athletics & sports
- 11.3 Fitness & commuting
- 11.4 Recreational/leisure
Chapter 12 Market Estimates & Forecast, By End Use, 2022 - 2035 ($Mn, Units)
- 12.1 Key trends
- 12.2 Individual consumers
- 12.3 Bike rental/fleet operators
- 12.4 Professional teams/clubs
Chapter 13 Market Estimates & Forecast, By Region, 2022 - 2035 ($Mn, Units)
- 13.1 Key trends
- 13.2 North America
- 13.2.1 US
- 13.2.2 Canada
- 13.3 Europe
- 13.3.1 Germany
- 13.3.2 UK
- 13.3.3 France
- 13.3.4 Italy
- 13.3.5 Spain
- 13.3.6 Russia
- 13.3.7 Nordics
- 13.3.8 Benelux
- 13.4 Asia Pacific
- 13.4.1 China
- 13.4.2 India
- 13.4.3 Japan
- 13.4.4 South Korea
- 13.4.5 ANZ
- 13.4.6 Singapore
- 13.4.7 Malaysia
- 13.4.8 Indonesia
- 13.4.9 Vietnam
- 13.4.10 Thailand
- 13.5 Latin America
- 13.5.1 Brazil
- 13.5.2 Mexico
- 13.5.3 Argentina
- 13.5.4 Colombia
- 13.6 MEA
- 13.6.1 South Africa
- 13.6.2 Saudi Arabia
- 13.6.3 UAE
Chapter 14 Company Profiles
- 14.1 Global companies
- 14.1.1 Garmin
- 14.1.2 Wahoo Fitness
- 14.1.3 Polar Electro Oy
- 14.1.4 Hammerhead
- 14.1.5 Stages Cycling
- 14.1.6 Lezyne
- 14.2 Regional companies
- 14.2.1 SIGMA
- 14.2.2 Bryton
- 14.2.3 CatEye
- 14.2.4 Giant Manufacturing
- 14.2.5 Specialized Bicycle Components
- 14.2.6 Bosch eBike Systems
- 14.2.7 Shimano
- 14.2.8 Mio Technology
- 14.3 Emerging companies
- 14.3.1 Coospo
- 14.3.2 iGPSPORT
- 14.3.3 Magene
- 14.3.4 Coros
- 14.3.5 Suunto
- 14.3.6 Omata
- 14.3.7 Beeline
- 14.3.8 Xplova
- 14.3.9 Cycplus
- 14.3.10 Trek Bicycle Corporation
- 14.3.11 Cannondale
 2026年全球智慧後視鏡電子產品市場報告2026年全球汽車行動工業處理器介面(MIPI)相機模組市場報告2026年全球自行車攝影機市場報告
 汽車熱感儀市場:按技術、解析度、應用、最終用戶和分銷管道分類 - 全球預測(2026-2032年)
 車載攝影機市場規模、佔有率及成長分析(按攝影機類型、車輛類型、技術、最終用戶和地區分類)-2026-2033年產業預測車輛B柱臉部辨識技術市場:依應用、車輛類別、車輛類型、技術及安裝方式分類-2026-2032年全球預測
 汽車攝影機市場-全球產業規模、佔有率、趨勢、機會和預測,按攝影機類型、應用類型、車輛類型、地區和競爭格局分類,2021-2031年預測
 行車記錄器市場規模、佔有率及成長分析(按技術、產品、影像品質、應用、分銷和地區分類)-2026-2033年產業預測
 汽車攝影機市場規模、佔有率和成長分析(按技術、視覺類型、自動駕駛等級、應用、車輛類型、電動汽車類型和地區分類)-2026-2033年產業預測
 汽車攝影機及相機模組:全球市佔率及排名、總收入及需求預測(2025-2031年)