

 |
市場調查報告書
商品編碼
1892902
碼頭調度軟體市場機會、成長促進因素、產業趨勢分析及預測(2026-2035年)Dock Scheduling Software Market Opportunity, Growth Drivers, Industry Trend Analysis, and Forecast 2026 - 2035 |
||||||
2025 年全球碼頭調度軟體市場價值為 58 億美元,預計到 2035 年將以 12.2% 的複合年成長率成長至 181 億美元。
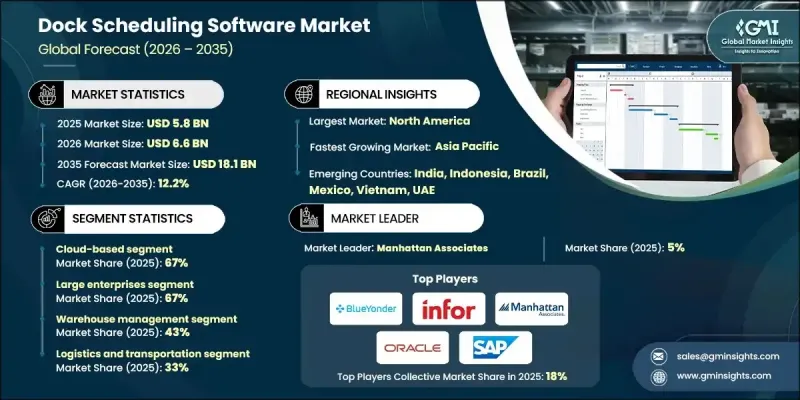
對營運效率日益成長的需求正在推動相關軟體的普及,因為最大限度地減少卡車在碼頭停留的時間對於降低成本和縮短週轉時間至關重要。碼頭調度軟體能夠幫助企業最佳化裝卸貨門的使用,並安排預約,從而減少車輛閒置時間,並提升為零售、食品雜貨和電子商務等行業的大批量貨運承運商提供的服務水平。勞動力短缺和不斷上漲的招募成本迫使倉庫更加重視人員配置。調度軟體能夠根據預期的貨運量預測人員需求,並將員工分配到最繁忙的碼頭。此外,該軟體還支援合規性和行業安全標準,能夠追蹤駕駛員的工作時間,報告違規行為,並確保遵守服務時間規定,同時保障駕駛員安全和營運效率。
| 市場範圍 | |
|---|---|
| 起始年份 | 2025 |
| 預測年份 | 2026-2035 |
| 起始值 | 58億美元 |
| 預測值 | 181億美元 |
| 複合年成長率 | 12.2% |
到 2025 年,基於雲端的細分市場將佔據 67% 的市場佔有率,預計到 2035 年將以 12.5% 的複合年成長率成長。雲端部署透過 SaaS 訂閱模式實現了即時營運商整合、行動存取和更低的預付成本,同時減輕了 IT 管理負擔。
大型企業在2025年佔據了67%的市場佔有率,這主要得益於其龐大的倉儲網路、多個裝卸貨平台以及複雜的多承運商營運模式。這些企業利用人工智慧支援的最佳化、多站點可視性以及與WMS和TMS系統的深度整合,以確保區域和全國配送中心流程的一致性。
預計2025年,美國碼頭調度軟體市場規模將達47.6億美元。卡車運力緊張、貨運速度加快以及對滯留時間的監管日益嚴格,是推動市場成長的主要因素。自動化、物聯網設備和自助服務入口網站提高了營運效率,並提升了配送中心產品收貨的及時性。
目錄
第1章:方法論
第2章:執行概要
第3章:行業洞察
- 產業生態系分析
- 供應商格局
- 利潤率
- 成本結構
- 每個階段的價值增加
- 影響價值鏈的因素
- 中斷
- 產業影響因素
- 成長促進因素
- 需要減少停留時間
- 勞動力最佳化
- 監理與合規壓力
- 現代供應鏈的複雜性
- 產業陷阱與挑戰
- 整合複雜度
- 營運商和員工對採用的抵觸情緒
- 市場機遇
- 拓展中小企業市場
- 電子商務與全通路物流
- 新興市場(亞太地區、拉丁美洲、中東和非洲)
- 自動化與機器人整合
- 成長促進因素
- 成長潛力分析
- 監管環境
- 全球的
- 安全與性能標準
- 環境與永續發展法規
- 資料隱私和跨境資料傳輸
- 運輸和貨運法規
- 產業特定合規性
- 北美洲
- 歐洲
- 亞太地區
- 拉丁美洲
- 中東和非洲
- 全球的
- 波特的分析
- PESTEL 分析
- 技術與創新格局
- 當前技術趨勢
- 調度引擎和最佳化演算法
- 車載資訊和預計到達時間數據
- 即時場地/拖車位置
- 行動司機應用程式和營運商入口網站
- 新興技術
- 人工智慧驅動的預測性調度和異常檢測
- 用於堆場/碼頭流程規劃的數位孿生和仿真
- 用於預約溯源和審計追蹤的區塊鏈
- 自主式堆場車輛與機器人裝卸
- 當前技術趨勢
- 定價分析
- 按部署模式定價
- 按單位指標定價
- 按功能等級定價
- 專業服務及整合費用
- 成本細分分析
- 供應商成本結構
- 成本構成要素的實施
- 持續營運成本
- 間接客戶成本
- 專利分析
- 主要供應商的專利所有權
- 自由實施權和智慧財產權訴訟趨勢
- 永續性和環境方面
- 永續實踐
- 減少廢棄物策略
- 生產中的能源效率
- 環保舉措
- 碳足跡考量
- 風險評估與緩解框架
- 供應鏈風險
- 金融和經濟風險
- 監理與合規風險
- 營運風險
- 技術與創新風險
- 最終使用者行為與消費分析
- 最終用戶細分框架
- 第三方物流及物流供應商的行為及多租戶需求
- 零售與電子商務採用模式
- 製造與準時制用戶行為
第4章:競爭格局
- 介紹
- 公司市佔率分析
- 北美洲
- 歐洲
- 亞太地區
- 拉丁美洲
- MEA
- 主要市場參與者的競爭分析
- 競爭定位矩陣
- 戰略展望矩陣
- 關鍵進展
- 併購
- 合作夥伴關係與合作
- 新產品發布
- 擴張計劃和資金
第5章:市場估算與預測:依部署模式分類,2022-2035年
- 基於雲端的
- 現場
- 混合
第6章:市場估算與預測:依企業規模分類,2022-2035年
- 大型企業
- 中小企業
第7章:市場估算與預測:依應用領域分類,2022-2035年
- 倉庫管理
- 交通運輸管理
- 場地管理
- 交叉轉運作業
- 其他
第8章:市場估算與預測:依解法分類,2022-2035年
- 獨立式碼頭調度軟體
- 整合供應鏈管理解決方案
- 碼頭調度堆場管理系統
第9章:市場估算與預測:依組件分類,2022-2035年
- 軟體
- 服務
第10章:市場估計與預測:依最終用途分類,2022-2035年
- 物流和運輸
- 零售與電子商務
- 製造業
- 餐飲
- 醫療保健和製藥
- 批發和分銷
- 其他
第11章:市場估計與預測:按地區分類,2022-2035年
- 北美洲
- 美國
- 加拿大
- 歐洲
- 德國
- 英國
- 法國
- 義大利
- 西班牙
- 北歐
- 俄羅斯
- 波蘭
- 羅馬尼亞
- 亞太地區
- 中國
- 印度
- 日本
- 韓國
- 澳新銀行
- 越南
- 印尼
- 拉丁美洲
- 巴西
- 墨西哥
- 阿根廷
- MEA
- 南非
- 沙烏地阿拉伯
- 阿拉伯聯合大公國
第12章:公司簡介
- 全球公司
- Blue Yonder
- C3 Solutions
- Descartes Systems
- FourKites
- Infor
- Korber Supply Chain
- Manhattan Associates
- Oracle
- project44
- SAP
- Zebra Technologies
- 區域玩家
- SIGHT Connect
- Alpega
- Dock411
- E2 open
- GoRamp
- Kale Logistics Solutions
- Opendock
- Softeon
- Transporeon
- Trimble Transportation
- Velostics
- YardView
- 新興玩家
- Arrivy
- Conduit
- DataDocks
- Epicor Software
- Extensiv (formerly 3 PL Central)
- LoadingCalendar
The Global Dock Scheduling Software Market was valued at USD 5.8 billion in 2025 and is estimated to grow at a CAGR of 12.2% to reach USD 18.1 billion by 2035.
The rising demand for operational efficiency is driving adoption, as minimizing the time trucks spend at docks is essential for reducing costs and turnaround times. Dock scheduling software enables companies to optimize door usage and arrange appointments, decreasing idle time and improving service levels for carriers handling high-volume shipments across retail, grocery, and e-commerce sectors. Labor shortages and rising hiring costs are compelling warehouses to allocate personnel more strategically. Scheduling software predicts staffing requirements based on expected shipment volumes and assigns employees to the busiest docks. Additionally, regulatory compliance and industry safety standards are supported, with the software tracking driver hours, reporting violations, and ensuring adherence to hours-of-service regulations while maintaining driver safety and operational efficiency.
| Market Scope | |
|---|---|
| Start Year | 2025 |
| Forecast Year | 2026-2035 |
| Start Value | $5.8 Billion |
| Forecast Value | $18.1 Billion |
| CAGR | 12.2% |
The cloud-based segment held a 67% share in 2025 and is expected to grow at a CAGR of 12.5% through 2035. Cloud deployment allows real-time carrier integration, mobile access, and lower upfront costs via the SaaS subscription model, while reducing IT management burdens.
The large enterprises segment held a 67% market share in 2025, driven by extensive warehouse networks, multiple dock doors, and complex multi-carrier operations. These enterprises leverage AI-supported optimization, multi-site visibility, and deep integration with WMS and TMS systems to maintain consistent processes across regional and national distribution centers.
U.S. Dock Scheduling Software Market generated USD 4.76 billion in 2025. Growth is fueled by tight trucking capacity, faster freight movement, and stricter regulatory scrutiny on detention times. Automation, IoT devices, and self-service portals enhance operational accuracy and improve the timeliness of product reception at distribution centers.
Key players in the Global Dock Scheduling Software Market include Descartes Systems, Manhattan Associates, Oracle, SAP, Epicor Software, Infor, Blue Yonder, Zebra Technologies, 4SIGHT Connect, and C3 Solutions. Companies in the dock scheduling software market are focusing on several strategies to strengthen their market presence. Providers are investing in AI and machine learning capabilities to enhance predictive scheduling and real-time dock optimization. Cloud deployment is being expanded to offer scalable, mobile-accessible solutions that reduce IT complexity for clients. Strategic partnerships with WMS, TMS, and ERP providers enhance platform integration, providing seamless operational workflows. Companies are also targeting large enterprises and multi-site distribution networks, offering advanced analytics, multi-carrier management, and AI-powered insights.
Table of Contents
Chapter 1 Methodology
- 1.1 Market scope and definition
- 1.2 Research design
- 1.2.1 Research approach
- 1.2.2 Data collection methods
- 1.3 Data mining sources
- 1.3.1 Global
- 1.3.2 Regional/Country
- 1.4 Base estimates and calculations
- 1.4.1 Base year calculation
- 1.4.2 Key trends for market estimation
- 1.5 Primary research and validation
- 1.5.1 Primary sources
- 1.6 Forecast model
- 1.7 Research assumptions and limitations
Chapter 2 Executive Summary
- 2.1 Industry 360° synopsis
- 2.2 Key market trends
- 2.2.1 Regional
- 2.2.2 Deployment mode
- 2.2.3 Enterprise size
- 2.2.4 Solution
- 2.2.5 Application
- 2.2.6 Component
- 2.2.7 End Use
- 2.3 TAM analysis, 2026-2035
- 2.4 CXO perspectives: Strategic imperatives
- 2.4.1 Executive decision points
- 2.4.2 Critical success factors
- 2.5 Future outlook
- 2.6 Strategic recommendations
Chapter 3 Industry Insights
- 3.1 Industry ecosystem analysis
- 3.1.1 Supplier landscape
- 3.1.2 Profit margin
- 3.1.3 Cost structure
- 3.1.4 Value addition at each stage
- 3.1.5 Factor affecting the value chain
- 3.1.6 Disruptions
- 3.2 Industry impact forces
- 3.2.1 Growth drivers
- 3.2.1.1 Need to reduce dwell time
- 3.2.1.2 Labor optimization
- 3.2.1.3 Regulatory & compliance pressures
- 3.2.1.4 Complexity of modern supply chains
- 3.2.2 Industry pitfalls and challenges
- 3.2.2.1 Integration complexity
- 3.2.2.2 Carrier & staff adoption resistance
- 3.2.3 Market opportunities
- 3.2.3.1 Expansion into SMB segment
- 3.2.3.2 E-commerce & omnichannel logistics
- 3.2.3.3 Emerging markets (APAC, LATAM, MEA)
- 3.2.3.4 Automation & robotics integration
- 3.2.1 Growth drivers
- 3.3 Growth potential analysis
- 3.4 Regulatory landscape
- 3.4.1 Global
- 3.4.1.1 Safety & performance standards
- 3.4.1.2 Environmental & sustainability regulations
- 3.4.1.3 Data privacy & cross-border data transfer
- 3.4.1.4 Transport & freight regulations
- 3.4.1.5 Industry-specific compliance
- 3.4.2 North America
- 3.4.3 Europe
- 3.4.4 Asia Pacific
- 3.4.5 Latin America
- 3.4.6 Middle East & Africa
- 3.4.1 Global
- 3.5 Porter's analysis
- 3.6 PESTEL analysis
- 3.7 Technology and innovation landscape
- 3.7.1 Current technological trends
- 3.7.1.1 Scheduling engines & optimization algorithms
- 3.7.1.2 Telematics & ETA feeds
- 3.7.1.3 Real-time yard/trailer location
- 3.7.1.4 Mobile driver apps & carrier portals
- 3.7.2 Emerging technologies
- 3.7.2.1 AI-driven predictive scheduling and anomaly detection
- 3.7.2.2 Digital twins and simulation for yard/dock flow planning
- 3.7.2.3 Blockchain for appointment provenance and audit trails
- 3.7.2.4 Autonomous yard vehicles and robotic dock handling
- 3.7.1 Current technological trends
- 3.8 Pricing analysis
- 3.8.1.1 Pricing by deployment mode
- 3.8.1.2 Pricing by unit metrics
- 3.8.1.3 Pricing by functionality tier
- 3.8.1.4 Professional services & integration costs
- 3.9 Cost breakdown analysis
- 3.9.1 Vendor cost structure
- 3.9.2 Implementation of cost components
- 3.9.3 Ongoing operational costs
- 3.9.4 Indirect customer costs
- 3.10 Patent analysis
- 3.10.1 Patent ownership by major vendors
- 3.10.2 Freedom-to-operate and IP litigation trends
- 3.11 Sustainability and environmental aspects
- 3.11.1 Sustainable practices
- 3.11.2 Waste reduction strategies
- 3.11.3 Energy efficiency in production
- 3.11.4 Eco-friendly initiatives
- 3.11.5 Carbon footprint considerations
- 3.12 Risk assessment & mitigation framework
- 3.12.1 Supply chain risks
- 3.12.2 Financial & economic risks
- 3.12.3 Regulatory & compliance risks
- 3.12.4 Operational risks
- 3.12.5 Technology & innovation risks
- 3.13 End use behavior & consumption analysis
- 3.13.1 End use segmentation framework
- 3.13.2. 3 PL & logistics provider behavior and multi-tenant needs
- 3.13.3 Retail & e-commerce adoption patterns
- 3.13.4 Manufacturing & JIT user behavior
Chapter 4 Competitive Landscape, 2025
- 4.1 Introduction
- 4.2 Company market share analysis
- 4.2.1 North America
- 4.2.2 Europe
- 4.2.3 Asia Pacific
- 4.2.4 LATAM
- 4.2.5 MEA
- 4.3 Competitive analysis of major market players
- 4.4 Competitive positioning matrix
- 4.5 Strategic outlook matrix
- 4.6 Key developments
- 4.6.1 Mergers & acquisitions
- 4.6.2 Partnerships & collaborations
- 4.6.3 New product launches
- 4.6.4 Expansion plans and funding
Chapter 5 Market Estimates & Forecast, By Deployment mode, 2022 - 2035 ($Mn)
- 5.1 Key trends
- 5.2 Cloud-based
- 5.3 On-premises
- 5.4 Hybrid
Chapter 6 Market Estimates & Forecast, By Enterprise Size, 2022 - 2035 ($Mn)
- 6.1 Key trends
- 6.2 Large enterprises
- 6.3 SMEs
Chapter 7 Market Estimates & Forecast, By Application, 2022 - 2035 ($Mn)
- 7.1 Key trends
- 7.2 Warehouse management
- 7.3 Transportation management
- 7.4 Yard management
- 7.5 Cross-docking operations
- 7.6 Others
Chapter 8 Market Estimates & Forecast, By Solution, 2022 - 2035 ($Mn)
- 8.1 Key trends
- 8.2 Standalone dock scheduling software
- 8.3 Integrated supply chain management solution
- 8.4 Yard management system with dock scheduling
Chapter 9 Market Estimates & Forecast, By Component, 2022 - 2035 ($Mn)
- 9.1 Key trends
- 9.2 Software
- 9.3 Services
Chapter 10 Market Estimates & Forecast, By End Use, 2022 - 2035 ($Mn)
- 10.1 Key trends
- 10.2 Logistics and transportation
- 10.3 Retail and e-commerce
- 10.4 Manufacturing
- 10.5 Food and beverage
- 10.6 Healthcare and pharmaceuticals
- 10.7 Wholesale and distribution
- 10.8 Others
Chapter 11 Market Estimates & Forecast, By Region, 2022 - 2035 ($Mn)
- 11.1 Key trends
- 11.2 North America
- 11.2.1 US
- 11.2.2 Canada
- 11.3 Europe
- 11.3.1 Germany
- 11.3.2 UK
- 11.3.3 France
- 11.3.4 Italy
- 11.3.5 Spain
- 11.3.6 Nordics
- 11.3.7 Russia
- 11.3.8 Poland
- 11.3.9 Romania
- 11.4 Asia Pacific
- 11.4.1 China
- 11.4.2 India
- 11.4.3 Japan
- 11.4.4 South Korea
- 11.4.5 ANZ
- 11.4.6 Vietnam
- 11.4.7 Indonesia
- 11.5 Latin America
- 11.5.1 Brazil
- 11.5.2 Mexico
- 11.5.3 Argentina
- 11.6 MEA
- 11.6.1 South Africa
- 11.6.2 Saudi Arabia
- 11.6.3 UAE
Chapter 12 Company Profiles
- 12.1 Global companies
- 12.1.1 Blue Yonder
- 12.1.2 C3 Solutions
- 12.1.3 Descartes Systems
- 12.1.4 FourKites
- 12.1.5 Infor
- 12.1.6 Korber Supply Chain
- 12.1.7 Manhattan Associates
- 12.1.8 Oracle
- 12.1.9 project44
- 12.1.10 SAP
- 12.1.11 Zebra Technologies
- 12.2 Regional players
- 12.2.1. SIGHT Connect
- 12.2.2 Alpega
- 12.2.3 Dock411
- 12.2.4. E2 open
- 12.2.5 GoRamp
- 12.2.6 Kale Logistics Solutions
- 12.2.7 Opendock
- 12.2.8 Softeon
- 12.2.9 Transporeon
- 12.2.10 Trimble Transportation
- 12.2.11 Velostics
- 12.2.12 YardView
- 12.3 Emerging players
- 12.3.1 Arrivy
- 12.3.2 Conduit
- 12.3.3 DataDocks
- 12.3.4 Epicor Software
- 12.3.5. Extensiv (formerly 3 PL Central)
- 12.3.6 LoadingCalendar
 2026年全球辦公室自動化市場報告2026年全球自動化軟體市場報告2026年全球行動表單自動化軟體市場報告2026年全球廣播自動化軟體市場報告
 AI辦公室軟體市場按類型、部署模式、組織規模和最終用戶分類-全球預測(2026-2032年)調度自動化軟體市場:按元件、部署模式、組織規模、業務功能、垂直產業和全球預測(2026-2032 年)
 向軟體定義自動化轉型:推動因素與挑戰
 人工智慧驅動的自動化市場預測至2032年:按自動化類型、技術、應用、最終用戶和地區分類的全球分析
 廣播自動化軟體市場-全球產業規模、佔有率、趨勢、機會和預測,依產品、應用、地區和競爭格局分類,2020-2030年預測低程式碼自動化平台市場預測至 2032 年:按組件、部署類型、組織規模、應用程式、最終用戶和地區進行的全球分析