


 |
市場調查報告書
商品編碼
1892890
稀土金屬市場機會、成長促進因素、產業趨勢分析及預測(2025-2034年)Rare Earth Metals Market Opportunity, Growth Drivers, Industry Trend Analysis, and Forecast 2025 - 2034 |
||||||
2024年全球稀土金屬市場價值為182億美元,預計到2034年將以7.6%的複合年成長率成長至367億美元。
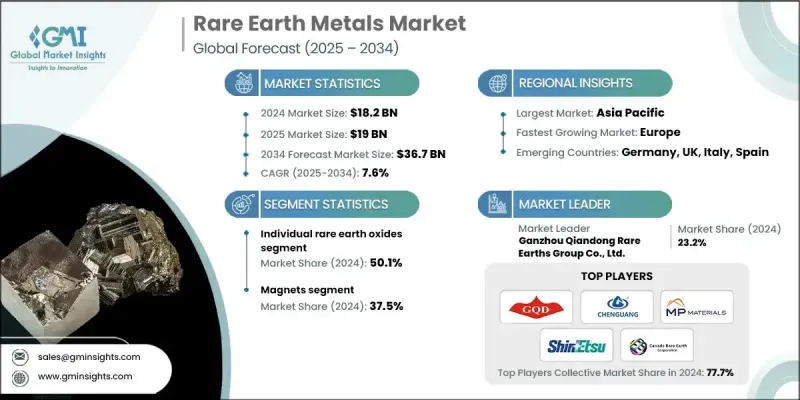
全球對高性能材料的依賴日益增強,推動了市場擴張,這些材料廣泛應用於電動車、再生能源技術、先進電子產品和現代國防系統等領域。稀土金屬以其卓越的磁性、熱學和光學性能而聞名,在電機、電池、感測器、催化劑和通訊系統的動力供應中發揮著不可或缺的作用。隨著各行業積極向清潔能源和電氣化轉型,對這些關鍵礦物的需求持續成長。此外,世界各國政府日益重視供應鏈安全,鼓勵新的採礦投資、回收計畫和戰略儲備,以減少對有限地理資源的依賴。
| 市場範圍 | |
|---|---|
| 起始年份 | 2024 |
| 預測年份 | 2025-2034 |
| 起始值 | 182億美元 |
| 預測值 | 367億美元 |
| 複合年成長率 | 7.6% |
2024年,稀土氧化物細分市場佔比達到50.1%,預計到2034年將以7.7%的複合年成長率成長。隨著稀土金屬在先進技術領域的應用不斷拓展,市場對其需求正迅速成長。釹、镨和鏑等元素的需求尤其強勁,因為它們在高性能永久磁鐵中發揮關鍵作用,而這些永久磁鐵廣泛應用於電動車、風能系統和電子設備等領域。
按應用領域分類,磁體在2024年佔據37.5%的市場佔有率,這主要得益於清潔能源技術和工業自動化領域的快速應用。磁體卓越的磁強度、耐久性和能源效率使其在現代馬達、渦輪機、醫療設備和精密儀器中不可或缺。
到2034年,亞太地區稀土金屬市場將以8.3%的複合年成長率成長,鞏固其作為全球稀土金屬開採、加工和製造中心的地位。中國龐大的產能,加上電子、汽車和再生能源產業的強勁需求,推動了該地區的領先地位。此外,電動車製造的快速擴張、離岸風電項目的開發以及半導體生產的穩定成長,也推動了稀土元素消費量的成長。
目錄
第1章:方法論與範圍
第2章:執行概要
第3章:行業洞察
- 產業生態系分析
- 供應商格局
- 利潤率
- 每個階段的價值增加
- 影響價值鏈的因素
- 中斷
- 產業影響因素
- 成長促進因素
- 產業陷阱與挑戰
- 市場機遇
- 成長潛力分析
- 監管環境
- 北美洲
- 歐洲
- 亞太地區
- 拉丁美洲
- 中東和非洲
- 波特的分析
- PESTEL 分析
- 價格趨勢
- 按地區
- 依產品類型
- 未來市場趨勢
- 技術與創新格局
- 當前技術趨勢
- 新興技術
- 專利格局
- 貿易統計(HS編碼)(註:僅提供重點國家的貿易統計資料)
- 主要進口國
- 主要出口國
- 永續性和環境方面
- 永續實踐
- 減少廢棄物策略
- 生產中的能源效率
- 環保舉措
- 碳足跡考量
第4章:競爭格局
- 介紹
- 公司市佔率分析
- 按地區
- 北美洲
- 歐洲
- 亞太地區
- 拉丁美洲
- MEA
- 按地區
- 公司矩陣分析
- 主要市場參與者的競爭分析
- 競爭定位矩陣
- 關鍵進展
- 併購
- 合作夥伴關係與合作
- 新產品發布
- 擴張計劃
第5章:市場估算與預測:依產品類型分類,2021-2034年
- 混合稀土氧化物(MREO)
- 輕稀土氧化物混合物
- 重稀土氧化物混合物
- 平衡的 LREO-HREO 混合物
- 單一稀土氧化物
- 輕稀土氧化物
- 重稀土氧化物
- 釔族氧化物
- 單一稀土金屬
- 鈰
- 鎝
- 鉺
- 钆
- 鑭
- 釹
- 镨
- 鈸
- 鈧
- 铽
- 鐿
- 釔
- 其他(銪、钬、镥、钷和鉥)
第6章:市場估算與預測:依應用領域分類,2021-2034年
- 磁鐵
- 著色劑
- 合金
- 光學儀器
- 催化劑
- 其他
第7章:市場估計與預測:依地區分類,2021-2034年
- 北美洲
- 美國
- 加拿大
- 歐洲
- 德國
- 英國
- 法國
- 西班牙
- 義大利
- 歐洲其他地區
- 亞太地區
- 中國
- 印度
- 日本
- 澳洲
- 韓國
- 亞太其他地區
- 拉丁美洲
- 巴西
- 墨西哥
- 阿根廷
- 拉丁美洲其他地區
- 中東和非洲
- 沙烏地阿拉伯
- 南非
- 阿拉伯聯合大公國
- 中東和非洲其他地區
第8章:公司簡介
- American Elements
- Arafura Rare Earths
- Australian Strategic Materials (ASM)
- Canada Rare Earth Corporation
- Energy Fuels Inc
- Ganzhou Chenguang Rare Earths New Material Co., Ltd.
- Ganzhou Qiandong Rare Earths Group Co., Ltd.
- Iluka Resources Limited
- Indian Rare Earths Limited
- Lynas Rare Earths Ltd
- MP Materials
- Neo Performance Materials
- Northern Minerals Limited
- Rio Tinto
- Shin-Etsu Chemical Co., Ltd.
- Western Minmetals (SC) Corporation
The Global Rare Earth Metals Market was valued at USD 18.2 billion in 2024 and is estimated to grow at a CAGR of 7.6% to reach USD 36.7 billion by 2034.
Market expansion is driven by rising global dependence on high-performance materials required for electric vehicles, renewable energy technologies, advanced electronics, and modern defense systems. Rare earth metals, known for their exceptional magnetic, thermal, and optical properties, play an indispensable role in powering motors, batteries, sensors, catalysts, and communication systems. With industries aggressively transitioning toward clean energy and electrification, demand for these critical minerals continues to accelerate. Additionally, governments worldwide are increasingly prioritizing supply chain security, encouraging new mining investments, recycling initiatives, and strategic reserves to reduce dependence on limited geographical sources.
| Market Scope | |
|---|---|
| Start Year | 2024 |
| Forecast Year | 2025-2034 |
| Start Value | $18.2 Billion |
| Forecast Value | $36.7 Billion |
| CAGR | 7.6% |
The individual rare earth oxides segment accounted for 50.1% in 2024 and is projected to grow at a CAGR of 7.7% through 2034. Demand for these individual rare earth metals is rising rapidly as their applications in advanced technologies continue to expand. Elements such as neodymium, praseodymium, and dysprosium are experiencing particularly strong demand due to their critical role in high-performance permanent magnets used in electric vehicles, wind energy systems, and electronic devices.
By application, the magnets segment held a 37.5% share in 2024, driven by rapid adoption in clean energy technologies and industrial automation. Their superior magnetic strength, durability, and energy efficiency make them irreplaceable in modern motors, turbines, medical devices, and precision equipment.
Asia Pacific Rare Earth Metals Market will grow at a CAGR of 8.3% by 2034, reinforcing its position as the global hub for rare earth metals mining, processing, and manufacturing activities. China's extensive production capacity, combined with strong demand from electronics, automotive, and renewable energy industries, drives the region's leadership. Moreover, the rapid expansion of EV manufacturing, the development of offshore wind projects, and the steady growth of semiconductor production are fueling increased consumption of rare earth elements.
Key players operating in the Global Rare Earth Metals Market include China Northern Rare Earth Group, Lynas Rare Earths, MP Materials, Iluka Resources, Arafura Resources, Alkane Resources, Ucore Rare Metals, Rare Element Resources, Texas Mineral Resources, Avalon Advanced Materials, Greenland Minerals, Rainbow Rare Earths, Defence Metals Corp., Neo Performance Materials, and China Minmetals Rare Earth Co. Ltd. Companies in the rare earth metals market are strengthening their market position by expanding mining capacities, developing advanced separation technologies, and enhancing value-added processing to reduce reliance on external suppliers. Many firms are focusing on long-term supply agreements with EV manufacturers, wind turbine producers, and electronics companies to secure stable revenue streams. Innovation in recycling technologies is also gaining momentum, enabling companies to reclaim rare earths from magnets, batteries, and electronic waste, lowering environmental impact and improving supply resilience.
Table of Contents
Chapter 1 Methodology & Scope
- 1.1 Market scope and definition
- 1.2 Research design
- 1.2.1 Research approach
- 1.2.2 Data collection methods
- 1.3 Data mining sources
- 1.3.1 Global
- 1.3.2 Regional/Country
- 1.4 Base estimates and calculations
- 1.4.1 Base year calculation
- 1.4.2 Key trends for market estimation
- 1.5 Primary research and validation
- 1.5.1 Primary sources
- 1.6 Forecast model
- 1.7 Research assumptions and limitations
Chapter 2 Executive Summary
- 2.1 Industry 360° synopsis
- 2.2 Key market trends
- 2.2.1 Regional
- 2.2.2 Product type
- 2.2.3 Application
- 2.3 TAM Analysis, 2025-2034
- 2.4 CXO perspectives: Strategic imperatives
- 2.4.1 Executive decision points
- 2.4.2 Critical success factors
- 2.5 Future Outlook and Strategic Recommendations
Chapter 3 Industry Insights
- 3.1 Industry ecosystem analysis
- 3.1.1 Supplier landscape
- 3.1.2 Profit margin
- 3.1.3 Value addition at each stage
- 3.1.4 Factor affecting the value chain
- 3.1.5 Disruptions
- 3.2 Industry impact forces
- 3.2.1 Growth drivers
- 3.2.2 Industry pitfalls and challenges
- 3.2.3 Market opportunities
- 3.3 Growth potential analysis
- 3.4 Regulatory landscape
- 3.4.1 North America
- 3.4.2 Europe
- 3.4.3 Asia Pacific
- 3.4.4 Latin America
- 3.4.5 Middle East & Africa
- 3.5 Porter's analysis
- 3.6 PESTEL analysis
- 3.7 Price trends
- 3.7.1 By region
- 3.7.2 By Product type
- 3.8 Future market trends
- 3.9 Technology and Innovation landscape
- 3.9.1 Current technological trends
- 3.9.2 Emerging technologies
- 3.10 Patent Landscape
- 3.11 Trade statistics (HS code) ( Note: the trade statistics will be provided for key countries only)
- 3.11.1 Major importing countries
- 3.11.2 Major exporting countries
- 3.12 Sustainability and environmental aspects
- 3.12.1 Sustainable practices
- 3.12.2 Waste reduction strategies
- 3.12.3 Energy efficiency in production
- 3.12.4 Eco-friendly initiatives
- 3.13 Carbon footprint consideration
Chapter 4 Competitive Landscape, 2024
- 4.1 Introduction
- 4.2 Company market share analysis
- 4.2.1 By region
- 4.2.1.1 North America
- 4.2.1.2 Europe
- 4.2.1.3 Asia Pacific
- 4.2.1.4 LATAM
- 4.2.1.5 MEA
- 4.2.1 By region
- 4.3 Company matrix analysis
- 4.4 Competitive analysis of major market players
- 4.5 Competitive positioning matrix
- 4.6 Key developments
- 4.6.1 Mergers & acquisitions
- 4.6.2 Partnerships & collaborations
- 4.6.3 New Product Launches
- 4.6.4 Expansion Plans
Chapter 5 Market Estimates and Forecast, By Product Type, 2021-2034 (USD Billion) (Tons)
- 5.1 Key trends
- 5.2 Mixed Rare Earth Oxides (MREO)
- 5.2.1 Light REE Oxides Mix
- 5.2.2 Heavy REE Oxides Mix
- 5.2.3 Balanced LREO-HREO Mix
- 5.3 Individual Rare Earth Oxides
- 5.3.1 Light REE Oxides
- 5.3.2 Heavy REE Oxides
- 5.3.3 Yttrium Group Oxides
- 5.4 Individual Rare Earth Metals
- 5.4.1 Cerium
- 5.4.2 Dysprosium
- 5.4.3 Erbium
- 5.4.4 Gadolinium
- 5.4.5 Lanthanum
- 5.4.6 Neodymium
- 5.4.7 Praseodymium
- 5.4.8 Samarium
- 5.4.9 Scandium
- 5.4.10 Terbium
- 5.4.11 Ytterbium
- 5.4.12 Yttrium
- 5.4.13 Others (Europium, Holmium, Lutetium, Promethium, and Thulium)
Chapter 6 Market Estimates and Forecast, By Application, 2021-2034 (USD Billion) (Tons)
- 6.1 Key trends
- 6.2 Magnets
- 6.3 Colorants
- 6.4 Alloys
- 6.5 Optical instruments
- 6.6 Catalysts
- 6.7 Others
Chapter 7 Market Estimates and Forecast, By Region, 2021-2034 (USD Billion) (Tons)
- 7.1 Key trends
- 7.2 North America
- 7.2.1 U.S.
- 7.2.2 Canada
- 7.3 Europe
- 7.3.1 Germany
- 7.3.2 UK
- 7.3.3 France
- 7.3.4 Spain
- 7.3.5 Italy
- 7.3.6 Rest of Europe
- 7.4 Asia Pacific
- 7.4.1 China
- 7.4.2 India
- 7.4.3 Japan
- 7.4.4 Australia
- 7.4.5 South Korea
- 7.4.6 Rest of Asia Pacific
- 7.5 Latin America
- 7.5.1 Brazil
- 7.5.2 Mexico
- 7.5.3 Argentina
- 7.5.4 Rest of Latin America
- 7.6 Middle East and Africa
- 7.6.1 Saudi Arabia
- 7.6.2 South Africa
- 7.6.3 UAE
- 7.6.4 Rest of Middle East and Africa
Chapter 8 Company Profiles
- 8.1 American Elements
- 8.2 Arafura Rare Earths
- 8.3 Australian Strategic Materials (ASM)
- 8.4 Canada Rare Earth Corporation
- 8.5 Energy Fuels Inc
- 8.6 Ganzhou Chenguang Rare Earths New Material Co., Ltd.
- 8.7 Ganzhou Qiandong Rare Earths Group Co., Ltd.
- 8.8 Iluka Resources Limited
- 8.9 Indian Rare Earths Limited
- 8.10 Lynas Rare Earths Ltd
- 8.11 MP Materials
- 8.12 Neo Performance Materials
- 8.13 Northern Minerals Limited
- 8.14 Rio Tinto
- 8.15 Shin-Etsu Chemical Co., Ltd.
- 8.16 Western Minmetals (SC) Corporation
 稀土元素回收市場:2026-2032年全球市場預測(依產品類型、製程、來源及最終用途產業分類)稀土元素市場:按類型、產品類型、提取製程、純度、應用、終端用戶產業和銷售管道分類-2026-2032年全球市場預測
 稀土元素回收市場預測(電子業至2034年)-按金屬類型、電子廢棄物來源、技術、應用、最終用戶和地區分類的全球分析
 全球稀土元素市場規模、佔有率、趨勢和成長分析報告(2026-2034年)稀土元素浸出化學品市場:依化學品類型、萃取製程、形態、應用、終端用戶產業及通路分類-2026-2032年全球市場預測
 鈰箔市場規模、佔有率和成長分析:按產品類型、形態、厚度、純度、應用、終端用戶產業和地區分類 - 2026-2033年產業預測
 稀土金屬市場:依類型、形態和應用劃分 - 至2036年的全球預測2026-2034年全球稀土金屬浸出化學品市場規模、佔有率、趨勢和成長分析報告
 2026年全球稀土元素市場報告2026年全球稀土金屬稀土元素市場報告