


 |
市場調查報告書
商品編碼
1892880
操作員訓練模擬器 (OTS) 市場機會、成長促進因素、產業趨勢分析及預測(2026-2035 年)Operator Training Simulator (OTS) Market Opportunity, Growth Drivers, Industry Trend Analysis, and Forecast 2026 - 2035 |
||||||
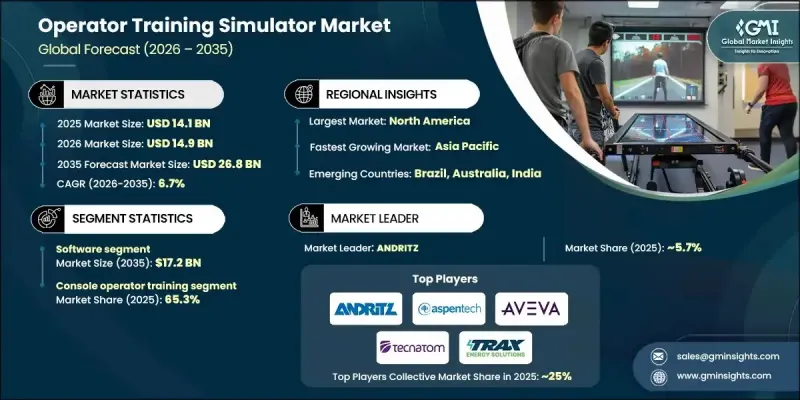
2025 年全球操作員訓練模擬器市場價值為 141 億美元,預計到 2035 年將以 6.7% 的複合年成長率成長至 268 億美元。
虛擬實境 (VR) 和擴增實境 (AR) 等沉浸式技術正在透過提供高度逼真的3D互動式環境,革新傳統的員工培訓方式。這些技術使學習者能夠與周圍環境互動,從而提高知識保留率並降低危險操作的風險。操作員培訓模擬器對於高風險行業尤其重要,因為在這些行業中,任何失誤都可能造成嚴重後果。除了安全之外,VR 和 AR 還有助於克服傳統訓練的後勤挑戰,從而減少訓練時間、成本和危險環境暴露時間。隨著各行業採用更先進的數位化解決方案,對沉浸式操作員培訓平台的需求持續成長,推動全球市場的整體發展。
| 市場範圍 | |
|---|---|
| 起始年份 | 2025 |
| 預測年份 | 2026-2035 |
| 起始值 | 141億美元 |
| 預測值 | 268億美元 |
| 複合年成長率 | 6.7% |
2025年軟體市場規模為86億美元,預計2035年將達172億美元。軟體解決方案憑藉其透過複雜的模擬引擎、高保真圖形和互動式介面模擬物理作用力和操作流程的能力,佔據了市場主導地位。對引人入勝、身臨其境的模擬體驗的需求,加速了創新VR和AR軟體解決方案的開發。
2024年,控制台操作員培訓市場規模達92億美元,約佔市佔率的65.3%。該市場仍佔據主導地位,因為大多數高風險操作都在集中控制室進行,操作員需要在控制室中監控多個系統、分析資料並快速做出決策。模擬器訓練可確保操作員在緊急情況下能夠正確應對、採取糾正措施並安全地管理複雜系統。
2025年美國操作員訓練模擬器市場規模為41億美元,預計2026年至2035年將以7%的複合年成長率成長。美國嚴格的工作場所安全法規推動了對能夠模擬緊急應變和操作風險的高級操作員培訓解決方案的需求。監管機構的措施和政府安全促進專案為企業部署高保真模擬器平台提供了強力的動力。
目錄
第1章:方法論與範圍
第2章:執行概要
第3章:行業洞察
- 產業生態系分析
- 供應商格局
- 利潤率
- 每個階段的價值增加
- 影響價值鏈的因素
- 產業影響因素
- 成長促進因素
- 產業陷阱與挑戰
- 機會
- 成長潛力分析
- 未來市場趨勢
- 價格趨勢
- 區域和組件
- 原料成本
- 原物料供應中的實際產能限制與感知產能限制
- 供應商價格上漲驗證
- 監理框架
- 按地區
- 波特五力分析
- PESTEL 分析
第4章:競爭格局
- 介紹
- 公司市佔率分析
- 按地區
- 公司矩陣分析
- 主要市場參與者的競爭分析
- 競爭定位矩陣
- 產品組合基準測試
- 關鍵進展
- 併購
- 合作夥伴關係與合作
- 新產品發布
- 擴張計劃
第5章:市場估算與預測:依組件分類,2022-2035年
- 硬體
- 軟體
- 控制仿真
- 過程模擬
- 沉浸式模擬
- 服務
- 諮詢
- 安裝與環境模擬
- 維護與支援
第6章:市場估算與預測:基於模擬環境,2022-2035年
- 控制台操作員培訓
- 現場操作員培訓
第7章:市場估算與預測:依最終用途分類,2022-2035年
- 航太與國防
- 化學
- 能源與電力
- 衛生保健
- 工業的
- 石油和天然氣
- 紙漿和造紙
- 其他
第8章:市場估算與預測:依配銷通路分類,2022-2035年
- 直銷
- 間接銷售
第9章:市場估計與預測:依地區分類,2022-2035年
- 北美洲
- 美國
- 加拿大
- 歐洲
- 德國
- 英國
- 法國
- 義大利
- 西班牙
- 亞太地區
- 中國
- 印度
- 日本
- 韓國
- 澳洲
- 拉丁美洲
- 巴西
- 墨西哥
- 阿根廷
- MEA
- 阿拉伯聯合大公國
- 沙烏地阿拉伯
- 南非
第10章:公司簡介
- ABB Ltd.
- ANDRITZ
- Aspen Technology Inc.
- AVEVA Group Limited
- Designing Digitally Inc.
- DNV AS
- DuPont
- EON Reality
- ESI Group
- Hyperion Group
- Schneider Electric
- Siemens
- Tecnatom
- TRAX Energy Solutions
- Yokogawa Electric Corporation
The Global Operator Training Simulator Market was valued at USD 14.1 billion in 2025 and is estimated to grow at a CAGR of 6.7% to reach USD 26.8 billion by 2035.
Immersive technologies such as Virtual Reality (VR) and Augmented Reality (AR) are transforming traditional employee training by providing interactive, three-dimensional environments that closely replicate real-world conditions. These technologies allow learners to engage with their surroundings, improving knowledge retention and reducing risk during hazardous operations. Operator training simulators are particularly critical for high-stakes industries where mistakes can have serious consequences. In addition to safety, VR and AR help overcome logistical challenges of conventional training, reducing time, cost, and exposure to dangerous conditions. As industries adopt more advanced digital solutions, the demand for immersive operator training platforms continues to rise, driving the overall growth of the market globally.
| Market Scope | |
|---|---|
| Start Year | 2025 |
| Forecast Year | 2026-2035 |
| Start Value | $14.1 Billion |
| Forecast Value | $26.8 Billion |
| CAGR | 6.7% |
The software segment held USD 8.6 billion in 2025 and is expected to reach USD 17.2 billion by 2035. Software solutions dominate the market due to their ability to replicate physical forces and operational processes through sophisticated simulation engines, high-fidelity graphics, and interactive interfaces. The demand for engaging and hands-on simulated experiences accelerates the development of innovative VR and AR software solutions.
The console operator training segment generated USD 9.2 billion in 2024, representing approximately 65.3% of the market. This segment remains dominant as most high-risk operations occur in centralized control rooms where operators monitor multiple systems, analyze data, and make rapid decisions. Simulator training ensures operators can respond correctly in emergencies, take corrective actions, and manage complex systems safely.
U.S. Operator Training Simulator Market was valued at USD 4.1 billion in 2025 and is anticipated to grow at a CAGR of 7% from 2026 to 2035. Stringent workplace safety regulations in the U.S. drive demand for advanced operator training solutions that simulate emergency responses and operational hazards. Regulatory initiatives and government programs promoting safety create strong incentives for companies to implement high-fidelity simulator platforms.
Key players in the Operator Training Simulator Market include Schneider Electric, Aspen Technology Inc., ABB Ltd., DNV AS, EON Reality, AVEVA Group Limited, TRAX Energy Solutions, Hyperion Group, Siemens, Tecnatom, Yokogawa Electric Corporation, Designing Digitally Inc., DuPont, and ESI Group. Market leaders focus on strategies such as continuous R&D to enhance software realism and simulation accuracy. Companies invest in VR and AR technology, expand platform capabilities for multiple industry applications, and integrate cloud-based solutions for remote training. Collaborations with industrial partners, customization of training modules, and after-sales support improve client retention. In addition, firms emphasize compliance with safety regulations, develop predictive analytics features, and adopt subscription-based or service-oriented pricing models to strengthen their market presence and maintain long-term competitiveness.
Table of Contents
Chapter 1 Methodology & Scope
- 1.1 Market scope and definition
- 1.2 Research design
- 1.2.1 Research approach
- 1.2.2 Data collection methods
- 1.3 Data mining sources
- 1.3.1 Global
- 1.3.2 Regional/Country
- 1.4 Base estimates and calculations
- 1.4.1 Base year calculation
- 1.4.2 Key trends for market estimation
- 1.5 Primary research and validation
- 1.5.1 Primary sources
- 1.6 Forecast model
- 1.7 Research assumptions and limitations
Chapter 2 Executive Summary
- 2.1 Industry 360° synopsis
- 2.2 Key market trends
- 2.2.1 Regional trends
- 2.2.2 Component trends
- 2.2.3 Simulation environment trends
- 2.2.4 End Use trends
- 2.2.5 Distribution channel trends
- 2.3 CXO perspective: Strategic imperatives
- 2.3.1 Key decision points for industry executives
- 2.3.2 Critical success factors for market players
- 2.4 Future outlook and strategic recommendations
- 2.5 Strategic recommendations
- 2.5.1 Supply chain diversification strategy
- 2.5.2 Product portfolio enhancement
- 2.5.3 Partnership and alliance opportunities
- 2.5.4 Cost management and pricing strategy
- 2.6 Decision framework
- 2.6.1 Investment priority matrix
- 2.6.2 ROI analysis
Chapter 3 Industry Insights
- 3.1 Industry ecosystem analysis
- 3.1.1 Supplier landscape
- 3.1.2 Profit margin
- 3.1.3 Value addition at each stage
- 3.1.4 Factor affecting the value chain
- 3.2 Industry impact forces
- 3.2.1 Growth drivers
- 3.2.2 Industry pitfalls & challenges
- 3.2.3 Opportunities
- 3.3 Growth potential analysis
- 3.4 Future market trends
- 3.5 Price trends
- 3.5.1 Region and component
- 3.5.2 Raw material cost
- 3.5.3 Real vs. perceived capacity constraints in supply of raw materials
- 3.5.4 Supplier price increase validation
- 3.6 Regulatory framework
- 3.6.1 By region
- 3.7 Porter's five forces analysis
- 3.8 PESTEL analysis
Chapter 4 Competitive Landscape, 2025
- 4.1 Introduction
- 4.2 Company market share analysis
- 4.2.1 By region
- 4.3 Company matrix analysis
- 4.4 Competitive analysis of major market players
- 4.5 Competitive positioning matrix
- 4.6 Product portfolio benchmarking
- 4.7 Key developments
- 4.7.1 Mergers & acquisitions
- 4.7.2 Partnerships & collaborations
- 4.7.3 New product launches
- 4.7.4 Expansion Plans
Chapter 5 Market Estimates & Forecast, By Component, 2022 - 2035 (USD Billion)
- 5.1 Key trends
- 5.2 Hardware
- 5.3 Software
- 5.3.1 Control simulation
- 5.3.2 Process simulation
- 5.3.3 Immersive simulation
- 5.4 Services
- 5.4.1 Consulting
- 5.4.2 Installation & environmental simulation
- 5.4.3 Maintenance & support
Chapter 6 Market Estimates & Forecast, By Simulation Environment, 2022 - 2035 (USD Billion)
- 6.1 Key trends
- 6.2 Console operator training
- 6.3 Field operator training
Chapter 7 Market Estimates & Forecast, By End Use, 2022 - 2035 (USD Billion)
- 7.1 Key trends
- 7.2 Aerospace & defense
- 7.3 Chemical
- 7.4 Energy & power
- 7.5 Healthcare
- 7.6 Industrial
- 7.7 Oil & gas
- 7.8 Pulp & paper
- 7.9 Others
Chapter 8 Market Estimates & Forecast, By Distribution Channel, 2022 - 2035, (USD Billion)
- 8.1 Key trends
- 8.2 Direct sales
- 8.3 Indirect sales
Chapter 9 Market Estimates & Forecast, By Region, 2022 - 2035, (USD Billion)
- 9.1 Key trends
- 9.2 North America
- 9.2.1 U.S.
- 9.2.2 Canada
- 9.3 Europe
- 9.3.1 Germany
- 9.3.2 U.K.
- 9.3.3 France
- 9.3.4 Italy
- 9.3.5 Spain
- 9.4 Asia Pacific
- 9.4.1 China
- 9.4.2 India
- 9.4.3 Japan
- 9.4.4 South Korea
- 9.4.5 Australia
- 9.5 Latin America
- 9.5.1 Brazil
- 9.5.2 Mexico
- 9.5.3 Argentina
- 9.6 MEA
- 9.6.1 UAE
- 9.6.2 Saudi Arabia
- 9.6.3 South Africa
Chapter 10 Company Profiles (Business Overview, Financial Data, Product Landscape, Strategic Outlook, SWOT Analysis)
- 10.1 ABB Ltd.
- 10.2 ANDRITZ
- 10.3 Aspen Technology Inc.
- 10.4 AVEVA Group Limited
- 10.5 Designing Digitally Inc.
- 10.6 DNV AS
- 10.7 DuPont
- 10.8 EON Reality
- 10.9 ESI Group
- 10.10 Hyperion Group
- 10.11 Schneider Electric
- 10.12 Siemens
- 10.13 Tecnatom
- 10.14 TRAX Energy Solutions
- 10.15 Yokogawa Electric Corporation
 全球操作員訓練模擬器市場規模、佔有率、趨勢和成長分析報告(2026-2034年)
 2026年全球操作員訓練模擬器市場報告
 操作員訓練模擬器市場規模、佔有率、趨勢分析報告:按組件、按營運商、按最終用途、按地區、細分市場預測,2024-2030 年