


 |
市場調查報告書
商品編碼
1892842
泵浦市場機會、成長促進因素、產業趨勢分析及預測(2026-2035年)Pumps Market Opportunity, Growth Drivers, Industry Trend Analysis, and Forecast 2026 - 2035 |
||||||
2025年全球泵浦市場價值為809億美元,預計到2035年將以4.3%的複合年成長率成長至1,248億美元。
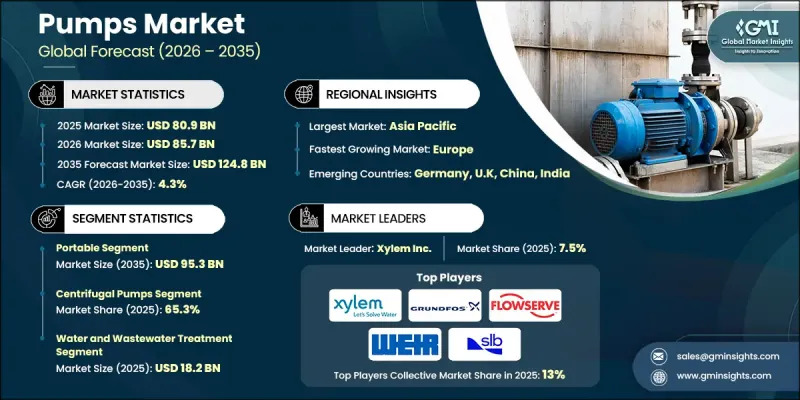
快速的工業化和城市化進程推動了市場擴張,全球對可靠泵送解決方案的需求日益成長。新興經濟體的基礎設施建設快速發展,對生活供水、污水處理和工業流程中的泵浦提出了更高的要求。泵浦技術的進步提高了效率和永續性,使製造商能夠在滿足全球環境標準的同時降低能耗。節能設計和創新解決方案有助於終端用戶節省營運成本,並與全球節能減排的努力相契合。市政服務、工業設施和能源密集型行業等領域對泵浦的日益普及,鞏固了泵浦市場在預測期內的穩定成長。石油和天然氣行業仍然是泵浦的主要終端用戶,因為這些設備對於開採、提煉和運輸活動至關重要。即使在市場波動和營運需求不斷變化的情況下,泵浦也能提供可靠的性能。
| 市場範圍 | |
|---|---|
| 起始年份 | 2025 |
| 預測年份 | 2026-2035 |
| 起始值 | 809億美元 |
| 預測值 | 1248億美元 |
| 複合年成長率 | 4.3% |
2025年,攜帶式幫浦市場規模達到605億美元,預計2035年將達953億美元。攜帶式泵浦具有移動性、適應性和易用性等優點,因此在建築、農業、採礦、石油和天然氣、市政服務和消防等各個行業都發揮著重要作用。
到 2025 年,離心泵市場佔有率將達到 65.3%,這得益於其高效、多功能以及能夠處理各種流體和流量,使其成為工業和市政應用中不可或缺的工具。
2025年,美國泵浦市場預計將佔據85.7%的佔有率,這主要得益於對水和廢水處理基礎設施的投資以及包括氫氣生產和碳捕獲在內的能源技術的進步。在這些項目中,高性能泵浦正被擴大用於處理低溫和化學流體。
目錄
第1章:方法論與範圍
第2章:執行概要
第3章:行業洞察
- 產業生態系分析
- 供應商格局
- 利潤率
- 每個階段的價值增加
- 影響價值鏈的因素
- 產業影響因素
- 成長促進因素
- 工業成長
- 水和廢水管理
- 基礎設施建設
- 產業陷阱與挑戰
- 高初始投資
- 營運成本
- 機會
- 水和污水處理基礎設施的成長
- 能源轉型與工業脫碳
- 成長促進因素
- 成長潛力分析
- 未來市場趨勢
- 技術與創新格局
- 當前技術趨勢
- 新興技術
- 價格趨勢
- 按類型
- 按地區
- 監管環境
- 標準和合規要求
- 區域監理框架
- 認證標準
- 貿易統計(HS編碼8431)
- 主要進口國
- 主要出口國
- 差距分析
- 風險評估與緩解
- 波特的分析
- PESTEL 分析
第4章:競爭格局
- 介紹
- 公司市佔率分析
- 按地區
- 公司矩陣分析
- 主要市場參與者的競爭分析
- 競爭定位矩陣
- 關鍵進展
- 併購
- 合作夥伴關係與合作
- 新產品發布
- 擴張計劃
第5章:市場估算與預測:依類型分類,2022-2035年
- 便攜的
- 文具
第6章:市場估算與預測:依市場定位分類,2022-2035年
- 潛水器
- 非潛水式
- 表面安裝式泵浦
- 直列泵浦
- 底座式抽水機
第7章:市場估算與預測:以驅動力分類,2022-2035年
- 引擎驅動
- 電動
第8章:市場估算與預測:依技術分類,2022-2035年
- 離心泵
- 軸流泵
- 徑向流泵
- 混流泵
- 懸臂式葉輪泵
- 軸承幫浦之間
- 直立式懸掛泵浦
- 容積式泵
- 互惠
- 旋轉
- 蠕動幫浦
- 專業和新興技術
- 無密封磁力驅動泵
- 罐式馬達泵
- 氣動雙隔膜泵
- 可控制容積計量泵
- 再生式渦輪泵
- 智慧型幫浦和物聯網系統
第9章:市場估計與預測:依產能與壓力範圍分類,2022-2035年
- 流量容量
- 低流量
- 中等流量
- 高流量
- 流量非常高
- 壓力範圍
- 低壓
- 中壓
- 高壓
- 超高壓
第10章:市場估計與預測:依最終用途分類,2022-2035年
- 礦業
- 建築施工
- 石油和天然氣
- 一般工業
- 水和廢水處理
- 化學品
- 發電
- 其他(農業等)
第11章:市場估價與預測:依配銷通路分類,2022-2035年
- 直銷
- 間接銷售
第12章:市場估算與預測:依地區分類,2022-2035年
- 北美洲
- 美國
- 加拿大
- 歐洲
- 德國
- 法國
- 英國
- 義大利
- 西班牙
- 亞太地區
- 中國
- 印度
- 日本
- 韓國
- 澳洲
- 拉丁美洲
- 巴西
- 墨西哥
- 阿根廷
- MEA
- 南非
- 沙烏地阿拉伯
- 阿拉伯聯合大公國
第13章:公司簡介
- Alfa Laval
- Atlas Copco
- Baker Hughes
- Ebara
- Flowserve
- Grundfos
- ITT
- Kirloskar
- KSB
- Pentair
- SLB
- Sulzer
- Weir Group
- Wilo
- Xylem
The Global Pumps Market was valued at USD 80.9 billion in 2025 and is estimated to grow at a CAGR of 4.3% to reach USD 124.8 billion by 2035.
Market expansion is driven by rapid industrialization and urbanization, which are increasing the demand for reliable pumping solutions worldwide. Emerging economies are witnessing significant infrastructure development, creating heightened requirements for pumps in domestic water supply, wastewater treatment, and industrial processes. Advances in pump technologies are enhancing efficiency and sustainability, enabling manufacturers to reduce energy consumption while meeting global environmental standards. Energy-efficient designs and innovative solutions are supporting operational cost savings for end-users and aligning with global efforts to reduce energy consumption. Increasing adoption across sectors such as municipal services, industrial facilities, and energy-intensive industries reinforces the steady growth of the pumps market over the forecast period. The oil & gas sector remains a key end-user of pumps, as these devices are essential for extraction, refining, and transportation activities. Pumps provide reliable performance even under fluctuating market conditions and evolving operational requirements.
| Market Scope | |
|---|---|
| Start Year | 2025 |
| Forecast Year | 2026-2035 |
| Start Value | $80.9 Billion |
| Forecast Value | $124.8 Billion |
| CAGR | 4.3% |
The portable pump segment generated USD 60.5 billion in 2025 and is projected to reach USD 95.3 billion by 2035. Their mobility, adaptability, and ease of use make portable pumps essential across industries, including construction, agriculture, mining, oil and gas, municipal services, and firefighting.
The centrifugal pump segment held 65.3% share in 2025, driven by their high efficiency, versatility, and ability to handle a wide range of fluids and flow rates, making them indispensable in industrial and municipal applications.
U.S. Pumps Market held an 85.7% share in 2025, supported by investments in water and wastewater treatment infrastructure and advancements in energy technologies, including hydrogen production and carbon capture. High-performance pumps are increasingly deployed for handling cryogenic and chemical fluids across these initiatives.
Key players in the Global Pumps Market include Xylem, KSB, Atlas Copco, Alfa Laval, Flowserve, SLB, Sulzer, ITT, Pentair, Wilo, Baker Hughes, Ebara, Kirloskar, Grundfos, and Weir Group. Companies in the Global Pumps Market strengthen their market presence by focusing on product innovation, including energy-efficient, durable, and high-capacity pumps. Expanding global manufacturing and distribution networks enables wider market reach and faster delivery to end-users. Strategic collaborations with industrial and municipal clients ensure long-term contracts and repeat business. R&D investments allow companies to develop solutions that meet evolving regulatory standards and sustainability goals. After-sales service, training programs, and digital monitoring solutions improve customer satisfaction and loyalty. Targeted marketing campaigns and participation in infrastructure development projects further consolidate their foothold and maintain competitiveness in regional and global markets.
Table of Contents
Chapter 1 Methodology & Scope
- 1.1 Market scope and definition
- 1.2 Research design
- 1.2.1 Research approach
- 1.2.2 Data collection methods
- 1.3 Data mining sources
- 1.3.1 Global
- 1.3.2 Regional/Country
- 1.4 Base estimates and calculations
- 1.4.1 Base year calculation
- 1.4.2 Key trends for market estimation
- 1.5 Primary research and validation
- 1.5.1 Primary sources
- 1.6 Forecast model
- 1.7 Research assumptions and limitations
Chapter 2 Executive Summary
- 2.1 Industry 3600 synopsis
- 2.2 Key market trends
- 2.2.1 Regional
- 2.2.2 Type
- 2.2.3 Position
- 2.2.4 Driving force
- 2.2.5 Technology
- 2.2.6 Capacity and pressure range
- 2.2.7 End use
- 2.2.8 Distribution channel
- 2.3 CXO perspectives: Strategic imperatives
- 2.3.1 Key decision points for industry executives
- 2.3.2 Critical success factors for market players
- 2.4 Future outlook and strategic recommendations
Chapter 3 Industry Insights
- 3.1 Industry ecosystem analysis
- 3.1.1 Supplier landscape
- 3.1.2 Profit margin
- 3.1.3 Value addition at each stage
- 3.1.4 Factor affecting the value chain
- 3.2 Industry impact forces
- 3.2.1 Growth drivers
- 3.2.1.1 Industrial growth
- 3.2.1.2 Water and wastewater management
- 3.2.1.3 Infrastructure development
- 3.2.2 Industry pitfalls & challenges
- 3.2.2.1 High initial investment
- 3.2.2.2 Operational costs
- 3.2.3 Opportunities
- 3.2.3.1 Growth in water & wastewater infrastructure
- 3.2.3.2 Energy transition & industrial decarbonization
- 3.2.1 Growth drivers
- 3.3 Growth potential analysis
- 3.4 Future market trends
- 3.5 Technology and innovation landscape
- 3.5.1 Current technological trends
- 3.5.2 Emerging technologies
- 3.6 Price trends
- 3.6.1 By Type
- 3.6.2 By Region
- 3.7 Regulatory landscape
- 3.7.1 Standards and compliance requirements
- 3.7.2 Regional regulatory frameworks
- 3.7.3 Certification standards
- 3.8 Trade statistics (HS code 8431)
- 3.8.1 Major importing countries
- 3.8.2 Major exporting countries
- 3.9 Gap analysis
- 3.10 Risk assessment and mitigation
- 3.11 Porter's analysis
- 3.12 PESTEL analysis
Chapter 4 Competitive Landscape, 2025
- 4.1 Introduction
- 4.2 Company market share analysis
- 4.2.1 By region
- 4.2.1.1 North America
- 4.2.1.2 Europe
- 4.2.1.3 Asia Pacific
- 4.2.1.4 Latin America
- 4.2.1.5 Middle East and Africa
- 4.2.1 By region
- 4.3 Company matrix analysis
- 4.4 Competitive analysis of major market players
- 4.5 Competitive positioning matrix
- 4.6 Key developments
- 4.6.1 Mergers & acquisitions
- 4.6.2 Partnerships & collaborations
- 4.6.3 New product launches
- 4.6.4 Expansion plans
Chapter 5 Market Estimates & Forecast, By Type, 2022-2035 (USD Billion) (Thousand Units)
- 5.1 Portable
- 5.2 Stationary
Chapter 6 Market Estimates & Forecast, By Position, 2022-2035 (USD Billion) (Thousand Units)
- 6.1 Key trends
- 6.2 Submersible
- 6.3 Non-submersible
- 6.3.1 Surface-mounted pumps
- 6.3.2 Inline pumps
- 6.3.3 Base-mounted pumps
Chapter 7 Market Estimates & Forecast, By Driving Force, 2022-2035 (USD Billion) (Thousand Units)
- 7.1 Key trends
- 7.2 Engine-driven
- 7.3 Electric-driven
Chapter 8 Market Estimates & Forecast, By Technology, 2022-2035 (USD Billion) (Thousand Units)
- 8.1 Key trends
- 8.2 Centrifugal pump
- 8.2.1 Axial flow pump
- 8.2.2 Radial flow pump
- 8.2.3 Mixed flow pump
- 8.2.4 Overhung impeller pumps
- 8.2.5 Between bearing pumps
- 8.2.6 Vertically suspended pumps
- 8.3 Positive displacement pump
- 8.3.1 Reciprocating
- 8.3.2 Rotary
- 8.3.3 Peristaltic pumps
- 8.4 Specialty and emerging technologies
- 8.4.1 Sealless and magnetic drive pumps
- 8.4.2 Canned motor pumps
- 8.4.3 Air-operated double diaphragm (AODD) pumps
- 8.4.4 Controlled-volume metering pumps
- 8.4.5 Regenerative turbine pumps
- 8.4.6 Smart pumps and IoT-enabled systems
Chapter 9 Market Estimates & Forecast, By Capacity And Pressure Range, 2022-2035 (USD Billion) (Thousand Units)
- 9.1 Key trends
- 9.2 Flow rate capacity
- 9.2.1 Low flow
- 9.2.2 Medium flow
- 9.2.3 High flow
- 9.2.4 Very high flow
- 9.3 Pressure range
- 9.3.1 Low pressure
- 9.3.2 Medium pressure
- 9.3.3 High pressure
- 9.3.4 Ultra-high pressure
Chapter 10 Market Estimates & Forecast, By End Use, 2022-2035 (USD Billion) (Thousand Units)
- 10.1 Key trends
- 10.2 Mining
- 10.3 Building & construction
- 10.4 Oil & gas
- 10.5 General industries
- 10.6 Water & wastewater treatment
- 10.7 Chemicals
- 10.8 Power generation
- 10.9 Others (agriculture etc.)
Chapter 11 Market Estimates & Forecast, By Distribution Channel, 2022-2035 (USD Billion) (Thousand Units)
- 11.1 Key trends
- 11.2 Direct sales
- 11.3 Indirect sales
Chapter 12 Market Estimates & Forecast, By Region, 2022-2035 (USD Billion) (Thousand Units)
- 12.1 Key trends
- 12.2 North America
- 12.2.1 U.S.
- 12.2.2 Canada
- 12.3 Europe
- 12.3.1 Germany
- 12.3.2 France
- 12.3.3 UK
- 12.3.4 Italy
- 12.3.5 Spain
- 12.4 Asia Pacific
- 12.4.1 China
- 12.4.2 India
- 12.4.3 Japan
- 12.4.4 South Korea
- 12.4.5 Australia
- 12.5 Latin America
- 12.5.1 Brazil
- 12.5.2 Mexico
- 12.5.3 Argentina
- 12.6 MEA
- 12.6.1 South Africa
- 12.6.2 Saudi Arabia
- 12.6.3 UAE
Chapter 13 Company Profiles
- 13.1 Alfa Laval
- 13.2 Atlas Copco
- 13.3 Baker Hughes
- 13.4 Ebara
- 13.5 Flowserve
- 13.6 Grundfos
- 13.7 ITT
- 13.8 Kirloskar
- 13.9 KSB
- 13.10 Pentair
- 13.11 SLB
- 13.12 Sulzer
- 13.13 Weir Group
- 13.14 Wilo
- 13.15 Xylem
 植入式渦流幫浦市場:依產品類型、額定功率、材料類型、技術、密封類型、流量、應用、最終用戶、通路分類,全球預測(2026-2032)垂直排水泵組市場:按泵浦類型、流量、揚程、馬達功率、驅動系統、材質、銷售管道、最終用戶和應用分類-全球預測,2026-2032年碳酸化泵浦市場:按泵浦類型、材質、驅動系統、輸出功率、應用及最終用戶產業分類-全球預測,2026-2032年小型分離式冷凝水泵市場按產品類型、材料、用途、最終用戶應用和分銷管道分類,全球預測(2026-2032年)按級數、材質、流量、驅動類型和最終用途行業分類的嵌入式葉輪泵市場—全球預測,2026-2032年氣動雙向隔膜幫浦市場依產品類型、流量、幫浦材料、終端用戶產業和銷售管道,全球預測,2026-2032年全球高流量氣泵市場(按產品類型、分銷管道、應用和終端用戶產業分類)預測(2026-2032年)微型蠕動幫浦市場按幫浦類型、驅動技術、材料、管徑、流量範圍、配置、壓力範圍、客製化程度、終端用戶產業和應用進行分類-全球預測,2026-2032年臥式磁力驅動攪拌機市場:依容量範圍、額定功率、終端用戶產業、應用和銷售管道,全球預測(2026-2032年)
 全球校準泵市場規模、佔有率、趨勢和成長分析報告(2026-2034年)