


 |
市場調查報告書
商品編碼
1892839
自行車功率計市場機會、成長促進因素、產業趨勢分析及預測(2026-2035年)Cycling Power Meter Market Opportunity, Growth Drivers, Industry Trend Analysis, and Forecast 2026 - 2035 |
||||||
2025 年全球自行車功率計市場價值為 4.182 億美元,預計到 2035 年將以 6.1% 的複合年成長率成長至 7.401 億美元。
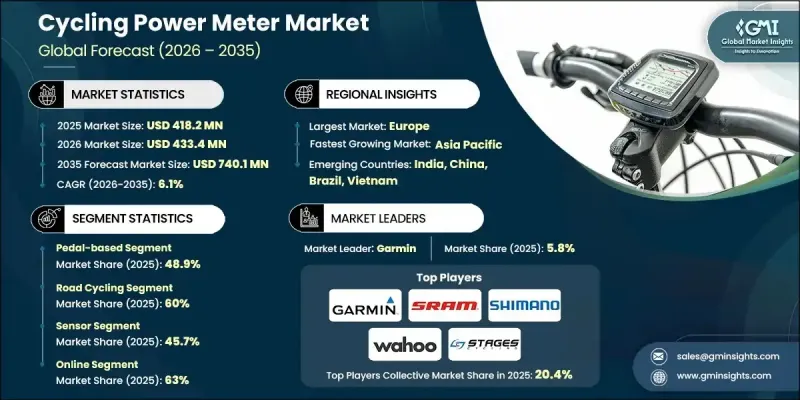
人們對健身、耐力訓練和性能最佳化的日益關注,持續推動著自行車功率計在休閒騎行者和競技騎行者中的廣泛應用。騎乘者將精準的功率監測放在首位,以提高效率、降低受傷風險並維持結構化的訓練計畫。隨著健身文化的普及和越來越多的人參與有組織的活動和長距離比賽,對可靠功率測量工具的需求也在穩步成長。快速的創新進一步提升了功率計的市場吸引力,使其能夠惠及精英運動員以外的更廣泛用戶群。更優質的材料、更完善的校準系統和更持久的電池,都增強了產品的可靠性和易用性。這些進步反映了消費者對精準、即時資料的需求不斷變化,這些數據有助於衡量騎乘表現的提升。隨著技術的普及和方便用戶使用性的提高,功率計正逐漸從專業的訓練工具轉變為專業騎乘者的主流性能配件。
| 市場範圍 | |
|---|---|
| 起始年份 | 2025 |
| 預測年份 | 2026-2035 |
| 起始值 | 4.182億美元 |
| 預測值 | 7.401億美元 |
| 複合年成長率 | 6.1% |
2025年,腳踏式功率計市佔率達到48.9%,預計2035年將以4.4%的複合年成長率成長。其市場主導地位歸功於安裝簡單、便於攜帶以及兼容多種自行車。雙面腳踏式功率計可提供更詳細的生物力學數據,而目前的創新重點在於提高精度、延長電池續航力和降低堆疊高度。儘管成熟市場的普及率趨於穩定,但擁有多輛自行車的騎乘者持續保持對功率計的需求。
2025年,公路車市場佔據了60%的佔有率,預計到2035年將達到3.605億美元。公路自行車騎乘者高度依賴穩定的功率資料進行訓練,受益於可預測的騎乘環境和成熟的性能框架。職業級別的曝光度有助於維持品牌知名度,而未來的成長預計將來自尋求便捷易用的功率解決方案的休閒騎乘者。
預計到2025年,美國自行車功率計市場規模將達到1.075億美元。美國地形多樣,自行車社群龐大,且廣泛參與競技和耐力賽等活動,這些因素持續支撐著市場需求。憑藉全年適宜的騎乘條件和成熟的自行車文化,美國仍然是北美地區功率計普及應用的核心市場。
目錄
第1章:方法論
第2章:執行概要
第3章:行業洞察
- 產業生態系分析
- 供應商格局
- 利潤率分析
- 成本結構
- 每個階段的價值增加
- 影響價值鏈的因素
- 中斷
- 產業影響因素
- 成長促進因素
- 以績效為基礎的培訓方式日益普及
- 感測器精度和連接性的進步
- 擴大競技自行車賽事
- 可支配收入增加和高階健身支出成長
- 與智慧訓練和人工智慧分析的整合
- 產業陷阱與挑戰
- 初始成本高,維護負擔重。
- 技術複雜性和使用者認知度低
- 市場機遇
- 對智慧室內訓練設備的需求不斷成長
- 拓展新興自行車市場
- 輕量化和模組化設計的開發
- 以永續發展為導向的製造方式的發展
- 成長潛力分析
- 監管環境
- 全球監管概覽
- 北美監理框架
- 歐洲監管框架
- 亞太地區監理框架
- 拉丁美洲監管框架
- 中東和非洲監管框架
- 安全標準與認證
- 網路安全和資料隱私法規
- 環境與排放法規
- 監理合規成本分析
- 全球監管概覽
- 波特的分析
- PESTEL 分析
- 技術與創新格局
- 當前技術趨勢
- 踏板式功率計
- 曲柄式功率計
- 基於集線器的功率計
- 基於鏈輪/蜘蛛爪的功率計
- 新興技術
- 人工智慧驅動的預測訓練系統
- 光學/雷射傳動系統感測器
- 具有整合功率測量功能的智慧騎行鞋
- 電動自行車整合功率計
- 當前技術趨勢
- 價格趨勢
- 按地區
- 依產品
- 生產統計
- 生產中心
- 消費中心
- 進出口
- 定價分析與市場經濟學
- 價格趨勢概述
- 按車輛類型定價
- 區域定價差異
- 總擁有成本 (TCO) 分析
- 政府激勵措施和補貼的影響
- 未來價格展望
- 成本細分分析
- 製造成本結構
- 研發成本分析
- 監理合規成本
- 分銷和物流成本
- 行銷和銷售成本
- 保固及售後成本
- 成本削減路線圖
- 專利分析
- 永續性和環境方面
- 永續實踐
- 減少廢棄物策略
- 生產中的能源效率
- 環保舉措
- 碳足跡考量
- 最終使用者行為分析
- 消費者採納模式
- 品牌忠誠度與轉換行為
- 未來行為趨勢
- 風險評估與緩解框架
- 技術風險
- 監理與合規風險
- 供應鏈風險
- 市場和競爭風險
- 財務風險
- 風險優先矩陣
- 未來展望與機遇
第4章:競爭格局
- 介紹
- 公司市佔率分析
- 北美洲
- 歐洲
- 亞太地區
- 拉丁美洲
- MEA
- 主要市場參與者的競爭分析
- 競爭定位矩陣
- 戰略展望矩陣
- 關鍵進展
- 併購
- 合作夥伴關係與合作
- 新產品發布
- 擴張計劃和資金
第5章:市場估算與預測:依電錶分類,2022-2035年
- 基於踏板
- 曲柄式
- 基於中心的
- 五通
- 其他
第6章:市場估算與預測:依應用領域分類,2022-2035年
- 公路自行車
- 登山車
- 室內訓練
- 其他
第7章:市場估算與預測:依配銷通路分類,2022-2035年
- 線上
- 離線
第8章:市場估算與預測:依技術分類,2022-2035年
- 感應器
- 功率測量
- 電源
- 數據連接
- ANT+
- 藍牙智慧/BLE
第9章:市場估計與預測:依地區分類,2022-2035年
- 北美洲
- 美國
- 加拿大
- 歐洲
- 德國
- 英國
- 法國
- 義大利
- 西班牙
- 俄羅斯
- 北歐
- 葡萄牙
- 克羅埃西亞
- 亞太地區
- 中國
- 印度
- 日本
- 澳洲
- 韓國
- 新加坡
- 泰國
- 印尼
- 越南
- 拉丁美洲
- 巴西
- 墨西哥
- 阿根廷
- MEA
- 南非
- 沙烏地阿拉伯
- 阿拉伯聯合大公國
- 土耳其
第10章:公司簡介
- 全球參與者
- Garmin
- SRAM / Quarq
- Stages Cycling
- Favero
- SRM
- Power2 Max
- Innovations
- Wahoo Fitness
- Shimano
- Campagnolo
- Pioneer Electronics
- 區域玩家
- Magene
- Sigeyi
- XCADEY
- INPEAK
- Elite
- Bryton
- Polar Electro
- Easton Cycling
- Specialized
- Praxis Works
- Giant
- TBS Group
- PowerTap
- Emerging Technology Innovators
- BMC Switzerland
- bePRO (Healthcare Tech)
- CycleOps (Saris)
- Arofly
- Xplova
- IQSquare
- WatTeam
The Global Cycling Power Meter Market was valued at USD 418.2 million in 2025 and is estimated to grow at a CAGR of 6.1% to reach USD 740.1 million by 2035.
Rising interest in fitness, endurance training, and performance optimization continues to drive widespread adoption of cycling power meters among both recreational and competitive riders. Cyclists are prioritizing accurate workload monitoring to enhance efficiency, reduce injury risks, and maintain structured training programs. As fitness culture expands and more individuals participate in organized events and long-distance competitions, the demand for reliable power measurement tools grows steadily. Rapid innovation is further accelerating market appeal, enabling the technology to reach a broader user base beyond elite athletes. Enhanced materials, improved calibration systems, and longer-lasting batteries have strengthened product reliability and usability. These advancements mirror shifting consumer expectations for precise, real-time data that supports measurable performance improvement. With technology becoming more accessible and user-friendly, power meters are steadily transitioning from a specialized training tool to a mainstream performance accessory for dedicated cyclists.
| Market Scope | |
|---|---|
| Start Year | 2025 |
| Forecast Year | 2026-2035 |
| Start Value | $418.2 Million |
| Forecast Value | $740.1 Million |
| CAGR | 6.1% |
The pedal-based power meter segment held 48.9% share in 2025 and is expected to grow at a CAGR of 4.4% through 2035. Its dominance is attributed to straightforward installation, portability, and compatibility across multiple bikes. Dual-sided pedal options provide detailed biomechanical insights, and current innovation focuses on enhanced accuracy, longer battery performance, and reduced stack height. Although adoption levels in established markets are stabilizing, continued interest among multi-bike riders sustains demand.
The road cycling category accounted for a 60% share in 2025 and is projected to reach USD 360.5 million by 2035. Road riders rely heavily on consistent power data for training, benefiting from predictable riding environments and established performance frameworks. Professional-level visibility helps maintain brand awareness, and future growth is expected to come from recreational cyclists seeking accessible, simplified power solutions.
US Cycling Power Meter Market was valued at USD 107.5 million in 2025. The country's diverse terrain, extensive cycling communities, and widespread participation in competitive and endurance events continue to support sustained demand. With year-round riding opportunities and a mature cycling culture, the US remains a central hub for power meter adoption across North America.
Key players in the Global Cycling Power Meter Market include 4iiii Innovations, Favero, Garmin, Pioneer Cycle Sports, Power2max, Shimano, SRAM, Stages Cycling, and Wahoo. Companies within the Cycling Power Meter Market are using several strategies to strengthen their competitive position. Many brands are prioritizing continual sensor refinement to improve accuracy and responsiveness, ensuring consistent performance across varied riding environments. Manufacturers are expanding compatibility with major cycling ecosystems, including head units, training apps, and smart indoor platforms, to enhance user integration. Partnerships with professional athletes, teams, and coaches serve as influential marketing tools that boost product credibility among consumers. Firms are also improving durability, reducing device weight, and extending battery life to meet the expectations of high-performance users.
Table of Contents
Chapter 1 Methodology
- 1.1 Market scope and definition
- 1.2 Research design
- 1.2.1 Research approach
- 1.2.2 Data collection methods
- 1.3 Data mining sources
- 1.3.1 Global
- 1.3.2 Regional/Country
- 1.4 Base estimates and calculations
- 1.4.1 Base year calculation
- 1.4.2 Key trends for market estimation
- 1.5 Primary research and validation
- 1.5.1 Primary sources
- 1.6 Forecast model
- 1.7 Research assumptions and limitations
Chapter 2 Executive Summary
- 2.1 Industry 360° synopsis, 2022 - 2035
- 2.2 Key market trends
- 2.2.1 Regional
- 2.2.2 Power meter type
- 2.2.3 Application
- 2.2.4 Distribution channel
- 2.2.5 Technology
- 2.3 TAM Analysis, 2026-2035
- 2.4 CXO perspectives: Strategic imperatives
- 2.4.1 Executive decision points
- 2.4.2 Critical success factors
- 2.5 Future outlook and strategic recommendations
Chapter 3 Industry Insights
- 3.1 Industry ecosystem analysis
- 3.1.1 Supplier landscape
- 3.1.2 Profit margin analysis
- 3.1.3 Cost structure
- 3.1.4 Value addition at each stage
- 3.1.5 Factor affecting the value chain
- 3.1.6 Disruptions
- 3.2 Industry impact forces
- 3.2.1.1 Growth drivers
- 3.2.1.2 Growing adoption of performance-based training
- 3.2.1.3 Advancements in sensor accuracy and connectivity
- 3.2.1.4 Expansion of competitive cycling events
- 3.2.1.5 Rising disposable income and premium fitness spending
- 3.2.1.6 Integration with smart training and AI analytics
- 3.2.2 Industry pitfalls and challenges
- 3.2.2.1 High initial cost and maintenance burden
- 3.2.2.2 Technical complexity and low user awareness
- 3.2.3 Market opportunities
- 3.2.3.1 Rising demand for smart indoor training equipment
- 3.2.3.2 Expansion into emerging cycling markets
- 3.2.3.3 Development of lightweight and modular designs
- 3.2.3.4 Growth in sustainability-focused manufacturing approaches
- 3.3 Growth potential analysis
- 3.4 Regulatory landscape
- 3.4.1 Global regulatory overview
- 3.4.1.1 North America regulatory framework
- 3.4.1.2 Europe regulatory framework
- 3.4.1.3 Asia Pacific regulatory framework
- 3.4.1.4 Latin America regulatory framework
- 3.4.1.5 Middle East & Africa regulatory framework
- 3.4.2 Safety standards & certifications
- 3.4.3 Cybersecurity & data privacy regulations
- 3.4.4 Environmental & emissions regulations
- 3.4.5 Regulatory compliance cost analysis
- 3.4.1 Global regulatory overview
- 3.5 Porter's analysis
- 3.6 PESTEL analysis
- 3.7 Technology and innovation landscape
- 3.7.1 Current technological trends
- 3.7.1.1 Pedal-based power meters
- 3.7.1.2 Crank-based power meters
- 3.7.1.3 Hub-based power meters
- 3.7.1.4 Chainring/Spider-based power meters
- 3.7.2 Emerging technologies
- 3.7.2.1 AI-powered predictive training systems
- 3.7.2.2 Optical/laser drivetrain sensors
- 3.7.2.3 Smart cycling shoes with integrated power measurement
- 3.7.2.4 E-bike integrated power meters
- 3.7.1 Current technological trends
- 3.8 Price trends
- 3.8.1 By region
- 3.8.2 By product
- 3.9 Production statistics
- 3.9.1 Production hubs
- 3.9.2 Consumption hubs
- 3.9.3 Export and import
- 3.10 Pricing analysis & market economics
- 3.10.1 Pricing trends overview
- 3.10.2 Pricing by vehicle type
- 3.10.3 Regional pricing variations
- 3.10.4 Total cost of ownership (TCO) analysis
- 3.10.5 Government incentives & subsidies impact
- 3.10.6 Future pricing outlook
- 3.11 Cost breakdown analysis
- 3.11.1 Manufacturing cost structure
- 3.11.2 R&D cost analysis
- 3.11.3 Regulatory compliance costs
- 3.11.4 Distribution & logistics costs
- 3.11.5 Marketing & sales costs
- 3.11.6 Warranty & aftersales costs
- 3.11.7 Cost reduction roadmap
- 3.12 Patent analysis
- 3.13 Sustainability and environmental aspects
- 3.13.1 Sustainable practices
- 3.13.2 Waste reduction strategies
- 3.13.3 Energy efficiency in production
- 3.13.4 Eco-friendly Initiatives
- 3.13.5 Carbon footprint considerations
- 3.14 End use behavior analysis
- 3.14.1 Consumer adoption patterns
- 3.14.2 Brand loyalty & switching behavior
- 3.14.3 Future behavior trends
- 3.15 Risk assessment & mitigation framework
- 3.15.1 Technology risks
- 3.15.2 Regulatory & compliance risks
- 3.15.3 Supply chain risks
- 3.15.4 Market & competitive risks
- 3.15.5 Financial risks
- 3.15.6 Risk prioritization matrix
- 3.16 Future outlook & opportunities
Chapter 4 Competitive Landscape, 2025
- 4.1 Introduction
- 4.2 Company market share analysis
- 4.2.1 North America
- 4.2.2 Europe
- 4.2.3 Asia Pacific
- 4.2.4 LATAM
- 4.2.5 MEA
- 4.3 Competitive analysis of major market players
- 4.4 Competitive positioning matrix
- 4.5 Strategic outlook matrix
- 4.6 Key developments
- 4.6.1 Mergers & acquisitions
- 4.6.2 Partnerships & collaborations
- 4.6.3 New Product Launches
- 4.6.4 Expansion Plans and funding
Chapter 5 Market Estimates & Forecast, By Power Meter, 2022-2035 (USD Mn, Units)
- 5.1 Key trends
- 5.1.1 Pedal-based
- 5.1.2 Crank-based
- 5.1.3 Hub-based
- 5.1.4 Bottom bracket
- 5.1.5 Others
Chapter 6 Market Estimates & Forecast, By Application, 2022 - 2035 (USD Mn, Units)
- 6.1 Key trends
- 6.2 Road cycling
- 6.3 Mountain biking
- 6.4 Indoor training
- 6.5 Others
Chapter 7 Market Estimates & Forecast, By Distribution Channel, 2022 - 2035 (USD Mn, Units)
- 7.1 Key trends
- 7.2 Online
- 7.3 Offline
Chapter 8 Market Estimates & Forecast, By Technology, 2022 - 2035 (USD Mn, Units)
- 8.1 Key trends
- 8.2 Sensor
- 8.3 Power Measurement
- 8.4 Power Source
- 8.5 Data Connectivity
- 8.5.1 ANT+
- 8.5.2 Bluetooth Smart / BLE
Chapter 9 Market Estimates & Forecast, By Region, 2022 - 2035 (USD Mn, Units)
- 9.1 Key trends
- 9.2 North America
- 9.2.1 US
- 9.2.2 Canada
- 9.3 Europe
- 9.3.1 Germany
- 9.3.2 UK
- 9.3.3 France
- 9.3.4 Italy
- 9.3.5 Spain
- 9.3.6 Russia
- 9.3.7 Nordics
- 9.3.8 Portugal
- 9.3.9 Croatia
- 9.4 Asia Pacific
- 9.4.1 China
- 9.4.2 India
- 9.4.3 Japan
- 9.4.4 Australia
- 9.4.5 South Korea
- 9.4.6 Singapore
- 9.4.7 Thailand
- 9.4.8 Indonesia
- 9.4.9 Vietnam
- 9.5 Latin America
- 9.5.1 Brazil
- 9.5.2 Mexico
- 9.5.3 Argentina
- 9.6 MEA
- 9.6.1 South Africa
- 9.6.2 Saudi Arabia
- 9.6.3 UAE
- 9.6.4 Turkey
Chapter 10 Company Profiles
- 10.1 Global Players
- 10.1.1 Garmin
- 10.1.2 SRAM / Quarq
- 10.1.3 Stages Cycling
- 10.1.4 Favero
- 10.1.5 SRM
- 10.1.6. Power2 Max
- 10.1.7 Innovations
- 10.1.8 Wahoo Fitness
- 10.1.9 Shimano
- 10.1.10 Campagnolo
- 10.1.11 Pioneer Electronics
- 10.2 Regional Players
- 10.2.1 Magene
- 10.2.2 Sigeyi
- 10.2.3 XCADEY
- 10.2.4 INPEAK
- 10.2.5 Elite
- 10.2.6 Bryton
- 10.2.7 Polar Electro
- 10.2.8 Easton Cycling
- 10.2.9 Specialized
- 10.2.10 Praxis Works
- 10.2.11 Giant
- 10.2.12 TBS Group
- 10.2.13 PowerTap
- 10.3 Emerging Technology Innovators
- 10.3.1 BMC Switzerland
- 10.3.2 bePRO (Healthcare Tech)
- 10.3.3 CycleOps (Saris)
- 10.3.4 Arofly
- 10.3.5 Xplova
- 10.3.6 IQSquare
- 10.3.7 WatTeam


