

 |
市場調查報告書
商品編碼
1892814
超高清4K面板市場機會、成長促進因素、產業趨勢分析及預測(2026-2035年)Ultra-High-Definition Panel 4K Market Opportunity, Growth Drivers, Industry Trend Analysis, and Forecast 2026 - 2035 |
||||||
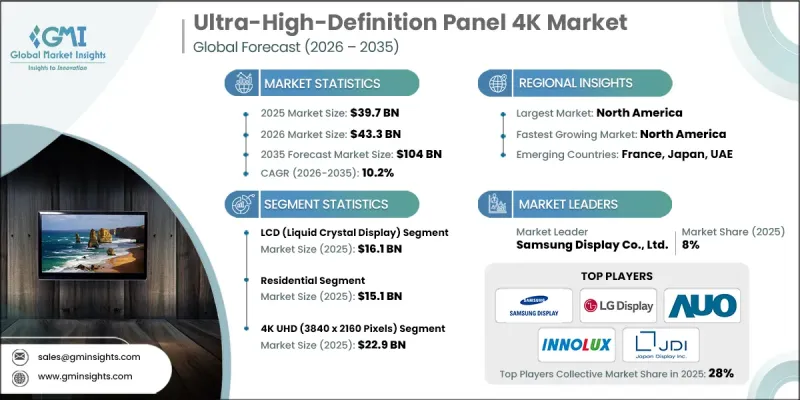
2025 年全球超高清 4K 面板市場規模估計為 397 億美元,預計到 2035 年將以 10.2% 的複合年成長率成長至 1040 億美元。
全球消費者和商業環境對更豐富的視覺品質和更沉浸式數位體驗的需求不斷成長,推動了市場的發展勢頭。顯示工程技術的持續創新,以及消費者對更高解析度和色彩精準度的日益成長的期望,正在重塑市場需求。製造商正加大對大型製造工廠和靈活的本地化組裝業務的投資,以加快生產週期並提供客製化的面板解決方案。這種轉型提高了對能夠處理大批量、高精度製造的先進製造系統的需求。隨著顯示性能基準的不斷提高,市場也受益於下一代面板架構和高效組件的整合,這些組件能夠提昇亮度、對比度並最佳化功耗。精簡的物流和模組化顯示單元在供應鏈中更快的流通正成為關鍵的競爭優勢。所有這些因素共同作用,使4K超高清面板成為支撐現代數位觀看、娛樂和專業顯示生態系統的核心技術。
| 市場範圍 | |
|---|---|
| 起始年份 | 2025 |
| 預測年份 | 2026-2035 |
| 起始值 | 397億美元 |
| 預測值 | 1040億美元 |
| 複合年成長率 | 10.2% |
到 2025 年,液晶顯示器市場規模將達到 161 億美元。其領先地位得益於製造規模化、穩定的視覺輸出和成本效益,這些優勢使其成為各種螢幕尺寸大批量生產的首選。
預計到2025年,住宅市場規模將達到151億美元。推動這一成長的因素包括:家庭用戶廣泛採用先進的顯示解決方案,提升日常觀看和互動體驗;家庭娛樂生態系統的持續升級以及老舊顯示器的更新換代,共同維持了市場的長期成長。
預計到 2025 年,美國超高清 4K 面板市場將佔據 83% 的佔有率,創造 122 億美元的收入。在高階消費、酒店和商業應用領域的強勁需求推動下,該地區預計將在 2026 年至 2035 年間錄得 11% 的全球最高複合年成長率。
目錄
第1章:方法論與範圍
第2章:執行概要
第3章:行業洞察
- 產業生態系分析
- 供應商格局
- 利潤率
- 每個階段的價值增加
- 影響價值鏈的因素
- 產業影響因素
- 成長促進因素
- 4K/UHD 內容和串流媒體服務的激增
- 高階和大尺寸顯示器市場快速成長
- 遊戲和電子競技市場的擴張
- 智慧家庭與人工智慧功能的整合
- 產業陷阱與挑戰
- 先進晶圓廠的高額資本支出
- 液晶顯示器產能過剩和價格下跌
- 機會
- 先進面板技術(OLED、QD-OLED、mini-LED)
- 新的應用領域(汽車、IT)
- 成長促進因素
- 成長潛力分析
- 未來市場趨勢
- 技術與創新格局
- 當前技術趨勢
- 新興技術
- 價格趨勢
- 按地區
- 透過技術
- 監管環境
- 標準和合規要求
- 區域監理框架
- 認證標準
- 波特的分析
- PESTEL 分析
第4章:競爭格局
- 介紹
- 公司市佔率分析
- 按地區
- 公司矩陣分析
- 主要市場參與者的競爭分析
- 競爭定位矩陣
- 關鍵進展
- 併購
- 合作夥伴關係與合作
- 新產品發布
- 擴張計劃
第5章:市場估算與預測:依應用領域分類,2022-2035年
- 消費性電子產品
- 電視機
- 顯示器
- 筆記型電腦
- 智慧型手機
- 片劑
- 商業的
- 數位看板
- 展示牆
- 廣告展示
- 衛生保健
- 醫學影像顯示器
- 教育
- 互動式白板
- 投影儀
- 汽車
- 車載顯示螢幕
- 資訊娛樂系統
- 其他
第6章:市場估算與預測:依技術分類,2022-2035年
- LCD(液晶顯示器)
- LED背光液晶顯示器
- 量子點(QLED)
- OLED(有機發光二極體)
- 軟性OLED
- 剛性OLED
- 微型LED
- 直視式LED
- 迷你LED
- 其他
第7章:市場估計與預測:依解析度分類,2022-2035年
- 4K 超高清 (3840 x 2160 像素)
- 8K 超高清 (7680 x 4320 像素)
第8章:市場規模估算與預測(2022-2035年)
- 低於 40 英寸
- 40-60英寸
- 超過 60 英寸
第9章:市場估算與預測:依最終用途分類,2022-2035年
- 住宅
- 商業的
- 工業的
第10章:市場估價與預測:依配銷通路分類,2022-2035年
- 線上
- 離線
第11章:市場估計與預測:按地區分類,2022-2035年
- 北美洲
- 美國
- 加拿大
- 歐洲
- 德國
- 英國
- 義大利
- 法國
- 俄羅斯
- 比利時
- 波蘭
- 亞太地區
- 中國
- 印度
- 日本
- 韓國
- 印尼
- 馬來西亞
- 拉丁美洲
- 巴西
- 墨西哥
- 阿根廷
- 中東和非洲
- 南非
- 沙烏地阿拉伯
- 阿拉伯聯合大公國
第12章:公司簡介
- Century Plyboards
- AU Optronics Corp. (AUO)
- BOE Technology Group Co., Ltd.
- Changhong Electric Co., Ltd.
- CSOT (China Star Optoelectronics Technology Co., Ltd.)
- Haier Group
- Hisense Group
- Innolux Corporation
- Japan Display Inc.
- LG Display Co., Ltd.
- Panasonic Corporation
- Philips (TPV Technology)
- Samsung Display Co., Ltd.
- Sharp Corporation
- Skyworth Group
- Sony Corporation
- TCL Technology
- Tianma Microelectronics Co., Ltd.
- ViewSonic Corporation
- Vizio Inc.
- Xiaomi Corporation
The Global Ultra-High-Definition Panel 4K Market was estimated at USD 39.7 billion in 2025 and is estimated to grow at a CAGR of 10.2% to reach USD 104 billion by 2035.
Market momentum is driven by the global shift toward richer visual quality and more immersive digital experiences across consumer and commercial environments. Continuous innovation in display engineering, combined with rising expectations for sharper resolution and color accuracy, is reshaping demand patterns. Manufacturers are increasingly investing in both large-scale fabrication plants and flexible localized assembly operations to deliver faster production cycles and customized panel solutions. This transformation is raising demand for advanced manufacturing systems capable of handling high-volume, precision-driven fabrication. As display performance benchmarks continue to rise, the market is also benefiting from the integration of next-generation panel architectures and high-efficiency components that enhance brightness, contrast, and power optimization. Streamlined logistics and faster movement of modular display units across the supply chain are becoming critical competitive differentiators. Together, these factors are positioning 4K UHD panels as a core technology underpinning modern digital viewing, entertainment, and professional display ecosystems.
| Market Scope | |
|---|---|
| Start Year | 2025 |
| Forecast Year | 2026-2035 |
| Start Value | $39.7 Billion |
| Forecast Value | $104 Billion |
| CAGR | 10.2% |
The LCD segment generated USD 16.1 billion in 2025. Its leadership is supported by manufacturing scalability, consistent visual output, and cost efficiency, which continue to make it a preferred choice for high-volume production across a wide range of screen sizes.
The residential segment reached USD 15.1 billion in 2025. Demand is being supported by widespread household adoption of advanced display solutions that elevate everyday viewing and interactive experiences. Continuous upgrades in home entertainment ecosystems and the replacement of older displays are sustaining long-term growth.
United States Ultra-High-Definition Panel 4K Market is expected to account for 83% share, generating USD 12.2 billion in 2025. The region is anticipated to record the highest global CAGR of 11% from 2026 to 2035, driven by strong demand across premium consumer, hospitality, and commercial applications.
Key companies active in the Global Ultra-High-Definition Panel 4K Market include Samsung Display Co., Ltd., LG Display Co., Ltd., BOE Technology Group Co., Ltd., AU Optronics Corp., TCL Technology, Sharp Corporation, Sony Corporation, Innolux Corporation, CSOT (China Star Optoelectronics Technology Co., Ltd.), Panasonic Corporation, Skyworth Group, Hisense Group, Japan Display Inc., Tianma Microelectronics Co., Ltd., ViewSonic Corporation, Vizio Inc., Xiaomi Corporation, Philips (TPV Technology), Haier Group, and Changhong Electric Co., Ltd. Companies in the Global Ultra-High-Definition Panel 4K Market are reinforcing their market position through sustained investment in next-generation display technologies, capacity expansion, and yield optimization. Strategic emphasis is placed on improving panel efficiency, enhancing visual performance, and reducing production costs through automation and advanced process control. Many players are strengthening partnerships with device manufacturers to secure long-term supply agreements and accelerate product integration.
Table of Contents
Chapter 1 Methodology and Scope
- 1.1 Market scope and definition
- 1.2 Research design
- 1.2.1 Research approach
- 1.2.2 Data collection methods
- 1.3 Data mining sources
- 1.3.1 Global
- 1.3.2 Regional/Country
- 1.4 Base estimates and calculations
- 1.4.1 Base year calculation
- 1.4.2 Key trends for market estimation
- 1.5 Primary research and validation
- 1.5.1 Primary sources
- 1.6 Forecast model
- 1.7 Research assumptions and limitations
Chapter 2 Executive Summary
- 2.1 Industry 3600 synopsis
- 2.2 Key market trends
- 2.2.1 Regional
- 2.2.2 Technology
- 2.2.3 Application
- 2.3 CXO perspectives: Strategic imperatives
- 2.3.1 Key decision points for industry executives
- 2.3.2 Critical success factors for market players
- 2.4 Future outlook and strategic recommendations
Chapter 3 Industry Insights
- 3.1 Industry ecosystem analysis
- 3.1.1 Supplier landscape
- 3.1.2 Profit margin
- 3.1.3 Value addition at each stage
- 3.1.4 Factor affecting the value chain
- 3.2 Industry impact forces
- 3.2.1 Growth drivers
- 3.2.1.1 Proliferation of 4K/UHD content & streaming services
- 3.2.1.2 Rapid growth in premium and large-format displays
- 3.2.1.3 Expansion of the gaming and esports market
- 3.2.1.4 Integration of smart home & AI features
- 3.2.2 Industry pitfalls & challenges
- 3.2.2.1 High capital expenditure (CapEx) for advanced fabs
- 3.2.2.2 Excess capacity and price erosion in commodity LCD
- 3.2.3 Opportunities
- 3.2.3.1 Advanced panel technologies (OLED, QD-OLED, mini-LED)
- 3.2.3.2 New application verticals (Automotive, IT)
- 3.2.1 Growth drivers
- 3.3 Growth potential analysis
- 3.4 Future market trends
- 3.5 Technology and innovation landscape
- 3.5.1 Current technological trends
- 3.5.2 Emerging technologies
- 3.6 Price trends
- 3.6.1 By region
- 3.6.2 By Technology
- 3.7 Regulatory landscape
- 3.7.1 Standards and compliance requirements
- 3.7.2 Regional regulatory frameworks
- 3.7.3 Certification standards
- 3.8 Porter's analysis
- 3.9 PESTEL analysis
Chapter 4 Competitive Landscape, 2025
- 4.1 Introduction
- 4.2 Company market share analysis
- 4.2.1 By region
- 4.2.1.1 North America
- 4.2.1.2 Europe
- 4.2.1.3 Asia Pacific
- 4.2.1.4 Latin America
- 4.2.1.5 Middle East and Africa
- 4.2.1 By region
- 4.3 Company matrix analysis
- 4.4 Competitive analysis of major market players
- 4.5 Competitive positioning matrix
- 4.6 Key developments
- 4.6.1 Mergers & acquisitions
- 4.6.2 Partnerships & collaborations
- 4.6.3 New product launches
- 4.6.4 Expansion plans
Chapter 5 Market Estimates and Forecast, By Application, 2022 - 2035 (USD Billion) (Million Units)
- 5.1 Key trends
- 5.2 Consumer electronics
- 5.2.1 Televisions
- 5.2.2 Monitors
- 5.2.3 Laptops
- 5.2.4 Smartphones
- 5.2.5 Tablets
- 5.3 Commercial
- 5.3.1 Digital signage
- 5.3.2 Display walls
- 5.3.3 Advertising displays
- 5.4 Healthcare
- 5.4.1 Medical imaging displays
- 5.5 Education
- 5.5.1 Interactive whiteboards
- 5.5.2 Projectors
- 5.6 Automotive
- 5.6.1 In-car displays
- 5.6.2 Infotainment systems
- 5.7 Others
Chapter 6 Market Estimates and Forecast, By Technology, 2022- 2035 (USD Billion) (Million Units)
- 6.1 Key trends
- 6.2 LCD (liquid crystal display)
- 6.2.1 LED-backlit LCD
- 6.2.2 Quantum dot (QLED)
- 6.3 OLED (organic light emitting diode)
- 6.3.1 Flexible OLED
- 6.3.2 Rigid OLED
- 6.4 MicroLED
- 6.4.1 Direct-view LED
- 6.4.2 Mini LED
- 6.5 Others
Chapter 7 Market Estimates and Forecast, By Resolution, 2022- 2035 (USD Billion) (Million Units)
- 7.1 Key trends
- 7.2 4K UHD (3840 x 2160 pixels)
- 7.3 8K UHD (7680 x 4320 pixels)
Chapter 8 Market Estimates and Forecast, By Size, 2022- 2035 (USD Billion) (Million Units)
- 8.1 Key trends
- 8.2 Below 40 inches
- 8.3 40-60 inches
- 8.4 Above 60 inches
Chapter 9 Market Estimates and Forecast, By End use, 2022- 2035 (USD Billion) (Million Units)
- 9.1 Key trends
- 9.2 Residential
- 9.3 Commercial
- 9.4 Industrial
Chapter 10 Market Estimates and Forecast, By Distribution Channel, 2022- 2035 (USD Billion) (Million Units)
- 10.1 Key trends
- 10.2 Online
- 10.3 Offline
Chapter 11 Market Estimates and Forecast, By Region, 2022 - 2035 (USD Billion) (Million Units)
- 11.1 Key trends
- 11.2 North America
- 11.2.1 U.S.
- 11.2.2 Canada
- 11.3 Europe
- 11.3.1 Germany
- 11.3.2 UK
- 11.3.3 Italy
- 11.3.4 France
- 11.3.5 Russia
- 11.3.6 Belgium
- 11.3.7 Poland
- 11.4 Asia Pacific
- 11.4.1 China
- 11.4.2 India
- 11.4.3 Japan
- 11.4.4 South Korea
- 11.4.5 Indonesia
- 11.4.6 Malaysia
- 11.5 Latin America
- 11.5.1 Brazil
- 11.5.2 Mexico
- 11.5.3 Argentina
- 11.6 Middle East and Africa
- 11.6.1 South Africa
- 11.6.2 Saudi Arabia
- 11.6.3 UAE
Chapter 12 Company Profiles
- 12.1 Century Plyboards
- 12.2 AU Optronics Corp. (AUO)
- 12.3 BOE Technology Group Co., Ltd.
- 12.4 Changhong Electric Co., Ltd.
- 12.5 CSOT (China Star Optoelectronics Technology Co., Ltd.)
- 12.6 Haier Group
- 12.7 Hisense Group
- 12.8 Innolux Corporation
- 12.9 Japan Display Inc.
- 12.10 LG Display Co., Ltd.
- 12.11 Panasonic Corporation
- 12.12 Philips (TPV Technology)
- 12.13 Samsung Display Co., Ltd.
- 12.14 Sharp Corporation
- 12.15 Skyworth Group
- 12.16 Sony Corporation
- 12.17 TCL Technology
- 12.18 Tianma Microelectronics Co., Ltd.
- 12.19 ViewSonic Corporation
- 12.20 Vizio Inc.
- 12.21 Xiaomi Corporation
 4K顯示解析度市場:按面板類型、螢幕大小、價格範圍、應用、最終用戶和分銷管道分類-2026-2032年全球市場預測
 4K顯示解析度市場報告:按產品類型、最終用戶和地區分類(2026-2034年)超高清環境光防反射螢幕市場(按產品類型、應用、最終用戶和分銷管道分類),全球預測(2026-2032年)
 全球4K顯示解析度市場規模、佔有率、趨勢和成長分析報告(2026-2034年)
 2026年全球4K超短焦雷射電視投影機市場報告4K 超高清 USB 網路攝影機市場:按感測器類型、價格範圍、連接類型、影格速率、自動對焦支援、應用、最終用戶和分銷管道分類 - 全球預測 2026-2032 年
 4K顯示器市場規模、佔有率和成長分析(按產品類型、解析度、技術、最終用戶、分銷管道和地區分類)-產業預測(2026-2033年)
 4K顯示解析度:市場佔有率分析、產業趨勢、統計數據和成長預測(2025-2030年)
 4K 顯示解析度市場 - 按產品(攝影機、數位相機、智慧電視、顯示器、智慧型手機和平板電腦)、按解析度、按應用和預測,2024 年至 2032 年