


 |
市場調查報告書
商品編碼
1892769
草甘膦市場機會、成長促進因素、產業趨勢分析及預測(2026-2035年)Glyphosate Market Opportunity, Growth Drivers, Industry Trend Analysis, and Forecast 2026 - 2035 |
||||||
2025 年全球草甘膦市場價值為 68 億美元,預計到 2035 年將以 4.6% 的複合年成長率成長至 107 億美元。
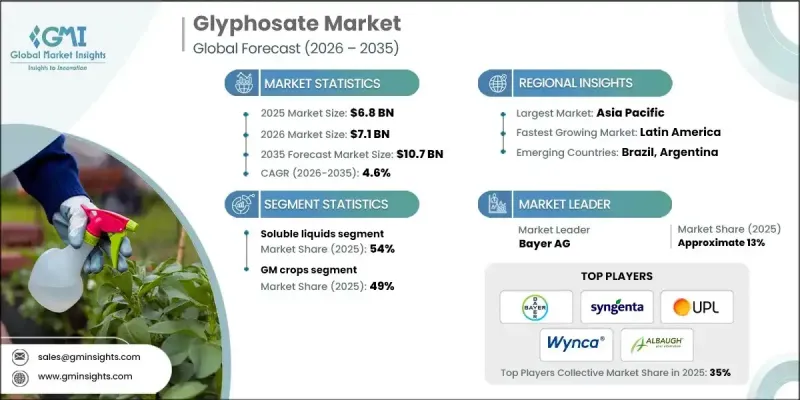
即使管理規範和監管要求不斷提高,草甘膦仍然是播前除草、基因改造作物田間施藥以及收穫後茬管理的重要除草劑。保護性耕作和免耕技術的推廣、集約化間作的普及以及價格敏感地區每公頃成本優勢的提升,都支撐著市場發展。同時,歐洲部分地區的抗藥性問題和更嚴格的監管促使用戶轉向精準施藥和多樣化的混合。中國技術供應商最佳化了產能,提高了環保合規性,提升了純度標準,並為依賴長期穩定供應的全球配方商穩定了價格。升級後的廢水和排放控制措施最大限度地減少了過去的繁榮-蕭條週期,使美洲和歐洲的配方商能夠進行可靠的規劃。種植者正在採用脈衝寬度調製、分段控制、無人機定點噴灑和數位化平台等技術,以最佳化施藥量,同時保持藥效並符合監管要求。
| 市場範圍 | |
|---|---|
| 起始年份 | 2025 |
| 預測年份 | 2026-2035 |
| 起始值 | 68億美元 |
| 預測值 | 107億美元 |
| 複合年成長率 | 4.6% |
2025 年,可溶性液體細分市場佔據 54% 的市場佔有率,預計到 2035 年將以 4.7% 的複合年成長率成長。這些配方因其易於操作、廣泛的罐混兼容性以及更高的吸收率、耐雨性和功效而備受青睞,其中包括經水生生物批准的用於運河和海岸線管理的選項。
基因改造作物在2025年佔據了49%的市場佔有率,預計到2035年將以5%的複合年成長率成長。草甘膦在大豆、玉米和棉花種植系統中仍然至關重要,它能夠有效應對抗性生物型,並構成多年生作物和果園播前除草和定向條帶施用的基礎。水產養殖和工業用途則依賴長間隔標籤和水生安全配方。
預計到2025年,北美草甘膦市佔率將達到23.9%,反映出該市場已發展成熟且高度專業化。美國使用經美國環保署(EPA)批准的標籤,並採取瀕危物種保護措施,強化了施用時間、緩衝區和全面的文件記錄要求。
目錄
第1章:方法論與範圍
第2章:執行概要
第3章:行業洞察
- 產業生態系分析
- 供應商格局
- 利潤率
- 每個階段的價值增加
- 影響價值鏈的因素
- 中斷
- 產業影響因素
- 成長促進因素
- 產業陷阱與挑戰
- 市場機遇
- 成長潛力分析
- 監管環境
- 北美洲
- 歐洲
- 亞太地區
- 拉丁美洲
- 中東和非洲
- 波特的分析
- PESTEL 分析
- 價格趨勢
- 按地區
- 按產品配方
- 未來市場趨勢
- 技術與創新格局
- 當前技術趨勢
- 新興技術
- 專利格局
- 貿易統計(HS編碼)(註:僅提供重點國家的貿易統計資料)
- 主要進口國
- 主要出口國
- 永續性和環境方面
- 永續實踐
- 減少廢棄物策略
- 生產中的能源效率
- 環保舉措
- 碳足跡考量
第4章:競爭格局
- 介紹
- 公司市佔率分析
- 按地區
- 北美洲
- 歐洲
- 亞太地區
- 拉丁美洲
- MEA
- 按地區
- 公司矩陣分析
- 主要市場參與者的競爭分析
- 競爭定位矩陣
- 關鍵進展
- 併購
- 合作夥伴關係與合作
- 新產品發布
- 擴張計劃
第5章:市場估價與預測:依產品配方分類,2022-2035年
- 技術濃縮物(TC - 粉末)
- 技術濃縮液(TK - 溶液)
- 可溶性液體濃縮物 (SL)
- 水溶性顆粒(SG)
- 即用型液體
- 水產及特殊配方
- 其他
第6章:市場估算與預測:依應用領域分類,2022-2035年
- 基因改造作物
- 基因改造玉米
- 基因改造棉花
- 基因改造油菜籽
- 基因改造大豆
- 基因改造甜菜
- 基因改造苜蓿
- 非基因改造耕地作物
- 穀物
- 油籽作物
- 水果和蔬菜
- 蔬菜
- 水果
- 工業作物
- 甘蔗
- 其他工業作物
- 非農業用途
- 林業管理
- 草坪和觀賞植物
- 水域
- 通行權(ROW)
- 商業和工業用地
- 其他
第7章:市場估算與預測:依最終用途分類,2022-2035年
- 大型商業農場
- 中小農戶
- 政府和公共機構
- 商業景觀設計師
- 工業植被管理公司
- 居民用戶
- 其他
第8章:市場估算與預測:依地區分類,2022-2035年
- 北美洲
- 美國
- 加拿大
- 歐洲
- 德國
- 英國
- 法國
- 西班牙
- 義大利
- 歐洲其他地區
- 亞太地區
- 中國
- 印度
- 日本
- 澳洲
- 韓國
- 亞太其他地區
- 拉丁美洲
- 巴西
- 墨西哥
- 阿根廷
- 拉丁美洲其他地區
- 中東和非洲
- 沙烏地阿拉伯
- 南非
- 阿拉伯聯合大公國
- 中東和非洲其他地區
第9章:公司簡介
- ADAMA Agricultural Solutions Ltd.
- Albaugh, LLC
- Anhui Huaxing Chemical Industry Co., Ltd.
- Arysta LifeScience
- Bayer AG
- Excel Crop Care Limited
- FMC Corporation
- Gharda Chemicals Limited
- Helm AG
- Heranba Industries Limited
- Hubei Xingfa Chemicals Group
- Jiangsu Good Harvest-Weien Agrochemical Co., Ltd.
- Jiangsu Yangnong Chemical Co., Ltd.
- Nufarm Limited
- Nutrien Ag Solutions
- Rainbow Agro
- Sinon Corporation (Taiwan)
- Syngenta Group (ChemChina)
- UPL Limited
- Zhejiang Xinan Chemical Industrial Group Co., Ltd.
- Others
The Global Glyphosate Market was valued at USD 6.8 billion in 2025 and is estimated to grow at a CAGR of 4.6% to reach USD 10.7 billion by 2035.
Glyphosate remains a cornerstone for pre-plant burndown, in-crop use on traited systems, and post-harvest stubble management, even as stewardship and regulatory expectations increase. The market is supported by the adoption of conservation and no-till practices, intensified multi-cropping, and cost-per-hectare advantages in price-sensitive regions. At the same time, resistance issues and tighter regulations in some parts of Europe are pushing users toward precision applications and diversified tank mixes. Chinese technical suppliers have rationalized capacities and improved environmental compliance, boosting purity standards and stabilizing prices for global formulators reliant on consistent long-term supply. Upgraded wastewater and emissions controls have minimized historical boom-bust cycles, allowing formulators in the Americas and Europe to plan reliably. Growers are embracing pulse-width modulation, section control, UAV spot-spraying, and digital platforms to optimize application rates while maintaining efficacy and regulatory compliance.
| Market Scope | |
|---|---|
| Start Year | 2025 |
| Forecast Year | 2026-2035 |
| Start Value | $6.8 Billion |
| Forecast Value | $10.7 Billion |
| CAGR | 4.6% |
The soluble liquids segment held a 54% share in 2025 and is expected to grow at a CAGR of 4.7% through 2035. These formulations are favored for their ease of handling, broad tank-mix compatibility, and improved uptake, rainfastness, and efficacy, including aquatic-approved options for canal and shoreline management.
The GM crops segment accounted for a 49% share in 2025 and is projected to grow at a CAGR of 5% through 2035. Glyphosate remains essential in soybean, corn, and cotton systems, addressing resistant biotypes and forming the backbone of pre-plant burndown and directed strip applications in permanent crops and orchards. Aquatic and industrial use relies on long-interval labels and aquatic-safe formulations.
North America Glyphosate Market held a 23.9% share in 2025, reflecting a mature and highly professionalized glyphosate market. The U.S. operates under EPA-approved labels, with endangered-species mitigation measures reinforcing timing, buffer zones, and comprehensive documentation requirements.
Key players in the Glyphosate Market include ADAMA Agricultural Solutions Ltd., Albaugh, LLC, Anhui Huaxing Chemical Industry Co., Ltd., Arysta LifeScience, Bayer AG, Excel Crop Care Limited, FMC Corporation, Gharda Chemicals Limited, Helm AG, Heranba Industries Limited, Hubei Xingfa Chemicals Group, Jiangsu Good Harvest-Weien Agrochemical Co., Ltd., Jiangsu Yangnong Chemical Co., Ltd., Nufarm Limited, Nutrien Ag Solutions, Rainbow Agro, Sinon Corporation (Taiwan), Syngenta Group (ChemChina), UPL Limited, and Zhejiang Xinan Chemical Industrial Group Co., Ltd. Companies in the Global Glyphosate Market are implementing several strategies to strengthen their foothold. They are investing in R&D to improve formulation performance, including enhanced surfactant systems and precision-compatible products. Strategic alliances with distributors, cooperatives, and agritech platforms expand market penetration and support the adoption of digital application tools. Regional expansion, particularly in emerging markets with rising farm incomes, helps capture new growth opportunities. Companies are also optimizing supply chains, improving environmental compliance, and offering training and technical support to growers to ensure correct usage.
Table of Contents
Chapter 1 Methodology & Scope
- 1.1 Market scope and definition
- 1.2 Research design
- 1.2.1 Research approach
- 1.2.2 Data collection methods
- 1.3 Data mining sources
- 1.3.1 Global
- 1.3.2 Regional/Country
- 1.4 Base estimates and calculations
- 1.4.1 Base year calculation
- 1.4.2 Key trends for market estimation
- 1.5 Primary research and validation
- 1.5.1 Primary sources
- 1.6 Forecast model
- 1.7 Research assumptions and limitations
Chapter 2 Executive Summary
- 2.1 Industry 3600 synopsis
- 2.2 Key market trends
- 2.2.1 Regional
- 2.2.2 Product formulation
- 2.2.3 Application
- 2.2.4 End use
- 2.3 TAM Analysis, 2026-2035
- 2.4 CXO perspectives: Strategic imperatives
- 2.4.1 Executive decision points
- 2.4.2 Critical success factors
- 2.5 Future Outlook and Strategic Recommendations
Chapter 3 Industry Insights
- 3.1 Industry ecosystem analysis
- 3.1.1 Supplier landscape
- 3.1.2 Profit margin
- 3.1.3 Value addition at each stage
- 3.1.4 Factor affecting the value chain
- 3.1.5 Disruptions
- 3.2 Industry impact forces
- 3.2.1 Growth drivers
- 3.2.2 Industry pitfalls and challenges
- 3.2.3 Market opportunities
- 3.3 Growth potential analysis
- 3.4 Regulatory landscape
- 3.4.1 North America
- 3.4.2 Europe
- 3.4.3 Asia Pacific
- 3.4.4 Latin America
- 3.4.5 Middle East & Africa
- 3.5 Porter's analysis
- 3.6 PESTEL analysis
- 3.7 Price trends
- 3.7.1 By region
- 3.7.2 By Product formulations
- 3.8 Future market trends
- 3.9 Technology and Innovation landscape
- 3.9.1 Current technological trends
- 3.9.2 Emerging technologies
- 3.10 Patent Landscape
- 3.11 Trade statistics (HS code) ( Note: the trade statistics will be provided for key countries only)
- 3.11.1 Major importing countries
- 3.11.2 Major exporting countries
- 3.12 Sustainability and environmental aspects
- 3.12.1 Sustainable practices
- 3.12.2 Waste reduction strategies
- 3.12.3 Energy efficiency in production
- 3.12.4 Eco-friendly initiatives
- 3.13 Carbon footprint consideration
Chapter 4 Competitive Landscape, 2025
- 4.1 Introduction
- 4.2 Company market share analysis
- 4.2.1 By region
- 4.2.1.1 North America
- 4.2.1.2 Europe
- 4.2.1.3 Asia Pacific
- 4.2.1.4 LATAM
- 4.2.1.5 MEA
- 4.2.1 By region
- 4.3 Company matrix analysis
- 4.4 Competitive analysis of major market players
- 4.5 Competitive positioning matrix
- 4.6 Key developments
- 4.6.1 Mergers & acquisitions
- 4.6.2 Partnerships & collaborations
- 4.6.3 New Product Launches
- 4.6.4 Expansion Plans
Chapter 5 Market Estimates and Forecast, By Product Formulation, 2022-2035 (USD Billion) (Kilo Tons)
- 5.1 Key trends
- 5.2 Technical Concentrate (TC - Powder)
- 5.3 Technical Concentrate (TK - Solution)
- 5.4 Soluble Liquid Concentrate (SL)
- 5.5 Water Soluble Granules (SG)
- 5.6 Ready-to-Use Liquids
- 5.7 Aquatic & Specialty Formulations
- 5.8 Others
Chapter 6 Market Estimates and Forecast, By Application, 2022-2035 (USD Billion) (Kilo Tons)
- 6.1 Key trends
- 6.2 GM Crops
- 6.2.1 GM Corn
- 6.2.2 GM Cotton
- 6.2.3 GM Canola
- 6.2.4 GM Soybean
- 6.2.5 GM Sugar Beet
- 6.2.6 GM Alfalfa
- 6.3 Non-GM Arable Crops
- 6.3.1 Cereal Grains
- 6.3.2 Oilseed Crops
- 6.4 Fruits & Vegetables
- 6.4.1 Vegetables
- 6.4.2 Fruits
- 6.5 Industrial Crops
- 6.5.1 Sugarcane
- 6.5.2 Other Industrial Crops
- 6.6 Non-Agricultural Uses
- 6.6.1 Forestry Management
- 6.6.2 Turf & Ornamentals
- 6.6.3 Aquatic Areas
- 6.6.4 Rights-of-Way (ROW)
- 6.6.5 Commercial & Industrial Sites
- 6.7 Others
Chapter 7 Market Estimates and Forecast, By End Use, 2022-2035 (USD Billion) (Kilo Tons)
- 7.1 Key trends
- 7.2 Large-Scale Commercial Farmers
- 7.3 Small & Medium Farmers
- 7.4 Government & Public Agencies
- 7.5 Commercial Landscapers
- 7.6 Industrial Vegetation Management Companies
- 7.7 Residential Consumers
- 7.8 Others
Chapter 8 Market Estimates and Forecast, By Region, 2022-2035 (USD Billion) (Kilo Tons)
- 8.1 Key trends
- 8.2 North America
- 8.2.1 U.S.
- 8.2.2 Canada
- 8.3 Europe
- 8.3.1 Germany
- 8.3.2 UK
- 8.3.3 France
- 8.3.4 Spain
- 8.3.5 Italy
- 8.3.6 Rest of Europe
- 8.4 Asia Pacific
- 8.4.1 China
- 8.4.2 India
- 8.4.3 Japan
- 8.4.4 Australia
- 8.4.5 South Korea
- 8.4.6 Rest of Asia Pacific
- 8.5 Latin America
- 8.5.1 Brazil
- 8.5.2 Mexico
- 8.5.3 Argentina
- 8.5.4 Rest of Latin America
- 8.6 Middle East and Africa
- 8.6.1 Saudi Arabia
- 8.6.2 South Africa
- 8.6.3 UAE
- 8.6.4 Rest of Middle East and Africa
Chapter 9 Company Profiles
- 9.1 ADAMA Agricultural Solutions Ltd.
- 9.2 Albaugh, LLC
- 9.3 Anhui Huaxing Chemical Industry Co., Ltd.
- 9.4 Arysta LifeScience
- 9.5 Bayer AG
- 9.6 Excel Crop Care Limited
- 9.7 FMC Corporation
- 9.8 Gharda Chemicals Limited
- 9.9 Helm AG
- 9.10 Heranba Industries Limited
- 9.11 Hubei Xingfa Chemicals Group
- 9.12 Jiangsu Good Harvest-Weien Agrochemical Co., Ltd.
- 9.13 Jiangsu Yangnong Chemical Co., Ltd.
- 9.14 Nufarm Limited
- 9.15 Nutrien Ag Solutions
- 9.16 Rainbow Agro
- 9.17 Sinon Corporation (Taiwan)
- 9.18 Syngenta Group (ChemChina)
- 9.19 UPL Limited
- 9.20 Zhejiang Xinan Chemical Industrial Group Co., Ltd.
- 9.21 Others
 Glyphosate市場預測至2034年:按作物、製劑形式、分銷管道、應用和區域分類的全球分析
 Glyphosate市場:按應用、作物、劑型和地區分類
 Glyphosate市場-全球產業規模、佔有率、趨勢、機會、預測:按類型、應用、地區和競爭格局分類,2021-2031年
 Glyphosate市場:按劑型、作物、分銷管道、最終用戶和應用分類的全球市場預測,2026-2032年
 日本Glyphosate市場規模、佔有率、趨勢和預測:按作物類型、基因改造生物 (GMO) 狀態和地區分類,2026-2034 年
 2026年全球Glyphosate市場報告
 Glyphosate市場規模、佔有率和成長分析(按最終用戶、應用、劑型、通路、作物類型和地區分類)—2026-2033年產業預測
 Glyphosate:市場佔有率分析、行業趨勢、統計數據、成長預測(2025-2030 年)
 全球Glyphosate市場
 全球Glyphosate市場評估:依作物類型、形式、應用、地區、機會和預測(2018-2032年)