


 |
市場調查報告書
商品編碼
1892744
營養保健品原料市場機會、成長促進因素、產業趨勢分析及預測(2026-2035年)Nutraceutical Ingredients Market Opportunity, Growth Drivers, Industry Trend Analysis, and Forecast 2026 - 2035 |
||||||
2025年全球營養保健品原料市場價值為985億美元,預計2035年將以7.5%的複合年成長率成長至2032億美元。
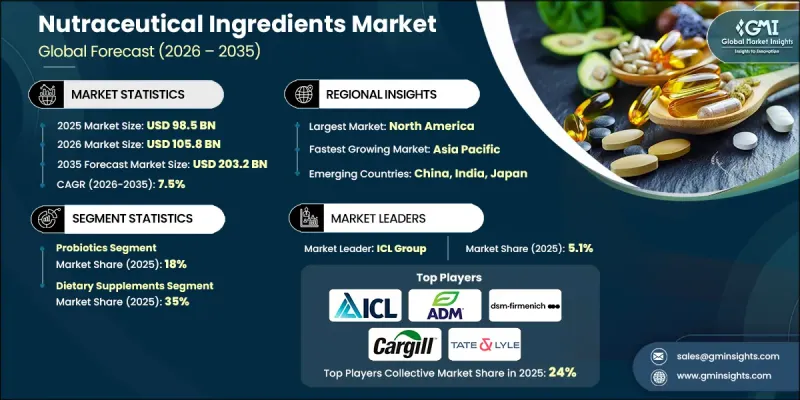
短期成長主要得益於功能性食品和即飲產品的日益普及,而中期擴張則由個人化營養和易於消費者理解的、經臨床驗證的健康聲明所驅動。即使整體食品產業成長放緩,營養保健品原料市場仍展現出韌性,因為其成長已擴展到多個通路和應用領域。消費者越來越重視飲食與慢性病預防之間的聯繫,這持續推動對支持消化系統健康、免疫功能、心血管健康和整體活力的原料的需求。消費者對植物性、有機和符合道德標準的原料日益成長的興趣,也進一步促使製造商創新配方,以吸引那些具有健康和環保意識的消費者。
| 市場範圍 | |
|---|---|
| 起始年份 | 2025 |
| 預測年份 | 2026-2035 |
| 起始值 | 985億美元 |
| 預測值 | 2032億美元 |
| 複合年成長率 | 7.5% |
2025年,益生菌市場佔有率預計將達到18%,這主要得益於消化健康解決方案日益普及。消費者越來越意識到腸道健康、免疫支持和整體健康的重要性,這促使益生菌被整合到功能性食品、飲料和非處方保健品中。對科學驗證的菌株和針對性配方的重視增強了消費者的信心,從而提高了益生菌的普及率。
預計到2025年,膳食補充劑市佔率將達到35%,凸顯了消費者對精準劑量、多成分組合和明確功效聲明的需求。消費者越來越傾向於選擇能夠實際改善免疫力、精力、認知功能和整體健康的補充劑。以便捷的劑型提供標準化的生物活性化合物,包括維生素、礦物質、胺基酸和植物萃取物,能夠顯著提升產品的吸引力。
北美營養保健品原料市場預計到2025年將佔據38%的市場佔有率,這主要得益於成熟的膳食補充劑文化、強大的零售和電商基礎設施,以及《膳食補充劑健康與教育法案》(DSHEA)帶來的清晰監管環境。美國受益於高階品牌定位、臨床行銷和專業人士的推薦,而加拿大則面臨著對植物性成分、益生菌和由內而外美容解決方案日益成長的需求。
目錄
第1章:方法論與範圍
第2章:執行概要
第3章:行業洞察
- 產業生態系分析
- 供應商格局
- 利潤率
- 每個階段的價值增加
- 影響價值鏈的因素
- 中斷
- 產業影響因素
- 成長促進因素
- 產業陷阱與挑戰
- 市場機遇
- 成長潛力分析
- 監管環境
- 北美洲
- 歐洲
- 亞太地區
- 拉丁美洲
- 中東和非洲
- 波特的分析
- PESTEL 分析
- 價格趨勢
- 按地區
- 未來市場趨勢
- 技術與創新格局
- 當前技術趨勢
- 新興技術
- 專利格局
- 貿易統計(HS編碼)(註:僅提供重點國家的貿易統計資料)
- 主要進口國
- 主要出口國
- 永續性和環境方面
- 永續實踐
- 減少廢棄物策略
- 生產中的能源效率
- 環保舉措
- 碳足跡考量
第4章:競爭格局
- 介紹
- 公司市佔率分析
- 按地區
- 北美洲
- 歐洲
- 亞太地區
- 拉丁美洲
- 中東和非洲
- 按地區
- 公司矩陣分析
- 主要市場參與者的競爭分析
- 競爭定位矩陣
- 關鍵進展
- 併購
- 合作夥伴關係與合作
- 新產品發布
- 擴張計劃
第5章:市場規模及預測:依產品分類,2022-2035年
- 益生菌
- 乳酸桿菌
- 雙歧桿菌
- 芽孢桿菌
- 鏈球菌
- 釀酒酵母
- 其他
- 益生元
- 低聚果糖 (FOS)
- 菊粉
- GOS(低聚半乳糖)
- 甘露寡糖 (MOS)
- 其他
- 維生素
- 維生素A
- 維生素C
- 維生素D
- 維生素E
- 維生素K
- 維生素B群(B1、B2、B6、B12、生物素、葉酸、菸鹼酸)
- 胺基酸
- 離胺酸
- 蛋胺酸
- 蘇胺酸
- 色氨酸
- 類胡蘿蔔素
- BETA-胡蘿蔔素
- 葉黃素
- 蝦紅素
- 角黃素
- 番茄紅素
- 其他
- 植物化學物質和植物萃取物
- 植物固醇
- 黃酮類化合物
- 多酚
- 其他
- 蛋白質
- 植物蛋白
- 小麥蛋白
- 大豆蛋白濃縮物(SPC)
- 大豆分離蛋白(SPI)
- 組織化大豆蛋白
- 豌豆蛋白
- 菜籽蛋白
- 其他
- 動物性蛋白質
- 雞蛋蛋白
- 乳蛋白濃縮物/分離物
- 乳清蛋白濃縮物(WPC 80、WPC 35)
- 乳清蛋白水解物(WPH)
- 乳清蛋白分離物(WPI)
- 明膠
- 酪蛋白/酪酸鹽
- 植物蛋白
- EPA/DHA(ω-3脂肪酸)
- 鳳尾魚/沙丁魚
- 藻油
- 鮪魚油
- 鱈魚肝油
- 鮭魚油
- 磷蝦油
- 鯡魚油
- 礦物
- 纖維和碳水化合物
- 穀物
- 水果和蔬菜
- 其他
第6章:市場規模及預測:依應用領域分類,2022-2035年
- 功能性食品
- 強化乳製品
- 強化果汁
- 功能性烘焙
- 強化穀物
- 功能飲料
- 運動飲料
- 能量飲料
- 強化水
- 美容飲品
- 膳食補充劑
- 膠囊
- 片劑
- 粉末
- 軟糖
- 軟膠囊
- 液體
- 個人護理及藥妝品
- 營養美容品(口服美容補充)
- 外用製劑
- 動物營養
- 伴侶動物
- 家畜
- 水產養殖
- 臨床營養
- 醫用食品
- 治療性營養
- 嬰兒配方奶粉
- 老年營養
- 其他
第7章:市場規模及預測:依產品類型分類,2022-2035年
- 乾粉
- 粉末
- 膠囊
- 片劑
- 軟糖和咀嚼片
- 珠粒和微珠
- 晶體
- 液態
- 溶液和糖漿
- 軟膠囊
- 乳液和懸浮液
- 脂質體配方
- 半固體形式
- 錠劑
- 口服袋
第8章:市場規模及預測:依最終用途產業分類,2022-2035年
- 製藥業
- 臨床營養
- 醫用食品
- 治療性補充劑
- 食品飲料業
- 功能性食品製造商
- 飲料強化
- 運動健身產業
- 化妝品及個人護理行業
- 動物飼料業
- 其他
第9章:市場規模及預測:依地區分類,2022-2035年
- 北美洲
- 美國
- 加拿大
- 歐洲
- 英國
- 德國
- 法國
- 義大利
- 西班牙
- 歐洲其他地區
- 亞太地區
- 中國
- 印度
- 日本
- 韓國
- 澳洲
- 亞太其他地區
- 拉丁美洲
- 巴西
- 墨西哥
- 阿根廷
- 拉丁美洲其他地區
- 中東和非洲
- 南非
- 沙烏地阿拉伯
- 阿拉伯聯合大公國
- 中東和非洲其他地區
第10章:公司簡介
- BASF SE
- ADM
- Ingredion
- DSM NV
- Cargill Incorporated
- Tate & Lyle
- Ajinomoto
- Prinova Group
- Roquette Freres
- Arla Food Ingredients
- Dupont Nutrition & Biosciences
- Divis Laboratories
- Barentz
- BI Nutraceuticals
- Cosucra Groupe Warcoing
- Ambe Phytoextracts
- Nutraland USA
- Nutra Food Ingredients
- Aurobindo Pharma
- Associated British Foods Plc
- Aurea Biolabs
- Innophos
- AVT Natural Products
The Global Nutraceutical Ingredients Market was valued at USD 98.5 billion in 2025 and is estimated to grow at a CAGR of 7.5% to reach USD 203.2 billion by 2035.
The near-term growth is fueled by the rising adoption of functional foods and ready-to-drink formats, while medium-term expansion is driven by personalized nutrition and clinically substantiated health claims that are easy for consumers to understand. The nutraceutical ingredients market demonstrates resilience even when broader food sectors slow down, as its growth is diversified across multiple channels and applications. Consumers increasingly link diet to chronic disease prevention, which continues to propel demand for ingredients supporting digestive health, immune function, cardiovascular wellness, and overall vitality. Rising interest in plant-based, organic, and ethically sourced ingredients is further encouraging manufacturers to innovate formulations that appeal to health-conscious and environmentally aware buyers.
| Market Scope | |
|---|---|
| Start Year | 2025 |
| Forecast Year | 2026-2035 |
| Start Value | $98.5 Billion |
| Forecast Value | $203.2 Billion |
| CAGR | 7.5% |
The probiotics segment accounted for an 18% share in 2025, fueled by the growing mainstream adoption of digestive wellness solutions. Consumers are increasingly recognizing the importance of gut health, immunity support, and overall well-being, which has led to the integration of probiotics across functional foods, beverages, and over-the-counter supplements. The emphasis on scientifically validated strains and targeted formulations has strengthened consumer confidence, driving higher adoption rates.
The dietary supplements segment held a 35% share in 2025, underscoring the demand for precise dosing, multi-ingredient combinations, and clear efficacy claims. Consumers increasingly seek supplements that offer measurable benefits for immunity, energy, cognitive function, and overall wellness. The ability to deliver standardized bioactive compounds, including vitamins, minerals, amino acids, and plant extracts, in convenient dosage forms enhances product appeal.
North America Nutraceutical ingredients Market held 38% share in 2025, led by a mature supplement culture, strong retail and e-commerce infrastructure, and regulatory clarity under DSHEA. The U.S. benefits from premium brand positioning, clinical marketing, and professional recommendations, while Canada sees increasing demand for plant-based ingredients, probiotics, and beauty-from-within solutions.
Key players in the Global Nutraceutical Ingredients Market include Tate & Lyle, DSM NV, BASF SE, DuPont Nutrition & Biosciences, Cargill Incorporated, Arla Food Ingredients, Divis Laboratories, Ajinomoto, Ingredion, Prinova Group, Roquette Freres, Barentz, and BI Nutraceuticals. Companies in the Global Nutraceutical ingredients Market are focusing on strategies such as investing in research and development to create clinically substantiated and innovative ingredients. They are expanding product portfolios to cater to functional foods, beverages, and dietary supplements. Strategic partnerships and collaborations with food manufacturers, distributors, and healthcare professionals help enhance market penetration. Firms are emphasizing clean-label, plant-based, and sustainable formulations to appeal to evolving consumer preferences. Mergers and acquisitions are pursued to strengthen geographic presence and diversify product offerings.
Table of Contents
Chapter 1 Methodology & Scope
- 1.1 Market scope and definition
- 1.2 Research design
- 1.2.1 Research approach
- 1.2.2 Data collection methods
- 1.3 Data mining sources
- 1.3.1 Global
- 1.3.2 Regional/Country
- 1.4 Base estimates and calculations
- 1.4.1 Base year calculation
- 1.4.2 Key trends for market estimation
- 1.5 Primary research and validation
- 1.5.1 Primary sources
- 1.6 Forecast model
- 1.7 Research assumptions and limitations
Chapter 2 Executive Summary
- 2.1 Industry 3600 synopsis
- 2.2 Key market trends
- 2.2.1 Product
- 2.2.2 Application
- 2.2.3 Form
- 2.2.4 End use industry
- 2.3 TAM analysis, 2025-2034
- 2.4 CXO perspectives: Strategic imperatives
- 2.4.1 Executive decision points
- 2.4.2 Critical success factors
- 2.5 Outlook and strategic recommendations
Chapter 3 Industry Insights
- 3.1 Industry ecosystem analysis
- 3.1.1 Supplier landscape
- 3.1.2 Profit margin
- 3.1.3 Value addition at each stage
- 3.1.4 Factor affecting the value chain
- 3.1.5 Disruptions
- 3.2 Industry impact forces
- 3.2.1 Growth drivers
- 3.2.2 Industry pitfalls and challenges
- 3.2.3 Market opportunities
- 3.3 Growth potential analysis
- 3.4 Regulatory landscape
- 3.4.1 North America
- 3.4.2 Europe
- 3.4.3 Asia Pacific
- 3.4.4 Latin America
- 3.4.5 Middle East & Africa
- 3.5 Porter's analysis
- 3.6 PESTEL analysis
- 3.7 Price trends
- 3.7.1 By region
- 3.8 Future market trends
- 3.9 Technology and innovation landscape
- 3.9.1 Current technological trends
- 3.9.2 Emerging technologies
- 3.10 Patent landscape
- 3.11 Trade statistics (HS code) (Note: the trade statistics will be provided for key countries only)
- 3.11.1 Major importing countries
- 3.11.2 Major exporting countries
- 3.12 Sustainability and environmental aspects
- 3.12.1 Sustainable practices
- 3.12.2 Waste reduction strategies
- 3.12.3 Energy efficiency in production
- 3.12.4 Eco-friendly initiatives
- 3.13 Carbon footprint considerations
Chapter 4 Competitive Landscape, 2025
- 4.1 Introduction
- 4.2 Company market share analysis
- 4.2.1 By region
- 4.2.1.1 North America
- 4.2.1.2 Europe
- 4.2.1.3 Asia Pacific
- 4.2.1.4 Latin America
- 4.2.1.5 Middle East & Africa
- 4.2.1 By region
- 4.3 Company matrix analysis
- 4.4 Competitive analysis of major market players
- 4.5 Competitive positioning matrix
- 4.6 Key developments
- 4.6.1 Mergers & acquisitions
- 4.6.2 Partnerships & collaborations
- 4.6.3 New product launches
- 4.6.4 Expansion plans
Chapter 5 Market Size and Forecast, By Product, 2022-2035 (USD Billion, Kilo Tons)
- 5.1 Key trends
- 5.2 Probiotics
- 5.2.1 Lactobacilli
- 5.2.2 Bifidobacterium
- 5.2.3 Bacillus
- 5.2.4 Streptococcus
- 5.2.5 Saccharomyces (yeast)
- 5.2.6 Others
- 5.3 Prebiotics
- 5.3.1 FOS (fructooligosaccharides)
- 5.3.2 Inulin
- 5.3.3 GOS (galactooligosaccharides)
- 5.3.4 MOS (mannanoligosaccharides)
- 5.3.5 Others
- 5.4 Vitamins
- 5.4.1.1 Vitamin A
- 5.4.1.2 Vitamin C
- 5.4.1.3 Vitamin D
- 5.4.1.4 Vitamin E
- 5.4.1.5 Vitamin K
- 5.4.1.6 Vitamin B-complex (B1, B2, B6, B12, Biotin, Folic Acid, Niacin)
- 5.5 Amino acids
- 5.5.1.1 Lysine
- 5.5.1.2 Methionine
- 5.5.1.3 Threonine
- 5.5.1.4 Tryptophan
- 5.6 Carotenoids
- 5.6.1.1 Beta-carotene
- 5.6.1.2 Lutein
- 5.6.1.3 Astaxanthin
- 5.6.1.4 Canthaxanthin
- 5.6.1.5 Lycopene
- 5.6.1.6 Others
- 5.7 Phytochemicals & plant extracts
- 5.7.1.1 Phytosterols
- 5.7.1.2 Flavonoids
- 5.7.1.3 Polyphenols
- 5.7.1.4 Others
- 5.8 Protein
- 5.8.1 Plant proteins
- 5.8.1.1 Wheat protein
- 5.8.1.2 Soy protein concentrates (SPC)
- 5.8.1.3 Soy protein isolates (SPI)
- 5.8.1.4 Textured soy protein
- 5.8.1.5 Pea protein
- 5.8.1.6 Canola protein
- 5.8.1.7 Others
- 5.8.2 Animal proteins
- 5.8.2.1 Egg protein
- 5.8.2.2 Milk protein concentrates/isolates
- 5.8.2.3 Whey protein concentrates (WPC 80, WPC 35)
- 5.8.2.4 Whey protein hydrolysates (WPH)
- 5.8.2.5 Whey protein isolates (WPI)
- 5.8.2.6 Gelatin
- 5.8.2.7 Casein/caseinates
- 5.8.1 Plant proteins
- 5.9 EPA/DHA (omega-3 fatty acids)
- 5.9.1 Anchovy/sardine
- 5.9.2 Algae oil
- 5.9.3 Tuna oil
- 5.9.4 Cod liver oil
- 5.9.5 Salmon oil
- 5.9.6 Krill oil
- 5.9.7 Menhaden oil
- 5.10 Minerals
- 5.11 Fiber & carbohydrates
- 5.11.1 Cereals & grains
- 5.11.2 Fruits & vegetables
- 5.12 Others
Chapter 6 Market Size and Forecast, By Application, 2022-2035 (USD Billion, Kilo Tons)
- 6.1 Key trends
- 6.2 Functional food
- 6.2.1 Fortified dairy products
- 6.2.2 Fortified juices
- 6.2.3 Functional bakery
- 6.2.4 Fortified cereals
- 6.3 Functional beverages
- 6.3.1 Sports drinks
- 6.3.2 Energy drinks
- 6.3.3 Fortified water
- 6.3.4 Beauty drinks
- 6.4 Dietary supplements
- 6.4.1 Capsules
- 6.4.2 Tablets
- 6.4.3 Powders
- 6.4.4 Gummies
- 6.4.5 Softgels
- 6.4.6 Liquids
- 6.5 Personal care & cosmeceuticals
- 6.5.1 Nutricosmetics (oral beauty supplements)
- 6.5.2 Topical formulations
- 6.6 Animal nutrition
- 6.6.1 Companion animals
- 6.6.2 Livestock
- 6.6.3 Aquaculture
- 6.7 Clinical nutrition
- 6.7.1 Medical foods
- 6.7.2 Therapeutic nutrition
- 6.7.3 Infant formula
- 6.7.4 Geriatric nutrition
- 6.8 Others
Chapter 7 Market Size and Forecast, By Form, 2022-2035 (USD Billion, Kilo Tons)
- 7.1 Key trends
- 7.2 Dry form
- 7.2.1 Powders
- 7.2.2 Capsules
- 7.2.3 Tablets
- 7.2.4 Gummies & chewables
- 7.2.5 Beadlets & microbeads
- 7.2.6 Crystals
- 7.3 Liquid form
- 7.3.1 Solutions & syrups
- 7.3.2 Softgels
- 7.3.3 Emulsions & suspensions
- 7.3.4 Liposomal formulations
- 7.4 Semi-solid form
- 7.4.1 Lozenges
- 7.4.2 Oral pouches
Chapter 8 Market Size and Forecast, By End Use Industry, 2022-2035 (USD Billion, Kilo Tons)
- 8.1 Key trends
- 8.2 Pharmaceutical industry
- 8.2.1 Clinical nutrition
- 8.2.2 Medical foods
- 8.2.3 Therapeutic supplements
- 8.3 Food & beverage industry
- 8.3.1 Functional food manufacturers
- 8.3.2 Beverage fortification
- 8.4 Sports & fitness industry
- 8.5 Cosmetics & personal care industry
- 8.6 Animal feed industry
- 8.7 Others
Chapter 9 Market Size and Forecast, By Region, 2022-2035 (USD Billion, Kilo Tons)
- 9.1 Key trends
- 9.2 North America
- 9.2.1 U.S.
- 9.2.2 Canada
- 9.3 Europe
- 9.3.1 UK
- 9.3.2 Germany
- 9.3.3 France
- 9.3.4 Italy
- 9.3.5 Spain
- 9.3.6 Rest of Europe
- 9.4 Asia Pacific
- 9.4.1 China
- 9.4.2 India
- 9.4.3 Japan
- 9.4.4 South Korea
- 9.4.5 Australia
- 9.4.6 Rest of Asia Pacific
- 9.5 Latin America
- 9.5.1 Brazil
- 9.5.2 Mexico
- 9.5.3 Argentina
- 9.5.4 Rest of Latin America
- 9.6 Middle East & Africa
- 9.6.1 South Africa
- 9.6.2 Saudi Arabia
- 9.6.3 UAE
- 9.6.4 Rest of Middle East & Africa
Chapter 10 Company Profiles
- 10.1 BASF SE
- 10.2 ADM
- 10.3 Ingredion
- 10.4 DSM NV
- 10.5 Cargill Incorporated
- 10.6 Tate & Lyle
- 10.7 Ajinomoto
- 10.8 Prinova Group
- 10.9 Roquette Freres
- 10.10 Arla Food Ingredients
- 10.11 Dupont Nutrition & Biosciences
- 10.12 Divis Laboratories
- 10.13 Barentz
- 10.14 BI Nutraceuticals
- 10.15 Cosucra Groupe Warcoing
- 10.16 Ambe Phytoextracts
- 10.17 Nutraland USA
- 10.18 Nutra Food Ingredients
- 10.19 Aurobindo Pharma
- 10.20 Associated British Foods Plc
- 10.21 Aurea Biolabs
- 10.22 Innophos
- 10.23 AVT Natural Products
 紅三葉草市場規模、佔有率和成長分析:按產品類型、應用、形態、性質、分銷管道、最終用戶和地區分類-2026-2033年產業預測
 營養保健品原料市場報告:趨勢、預測及競爭分析(至2035年)
 營養保健品原料市場:依形態、產品成分、應用及地區分類
 營養機能性食品配料市場規模、佔有率、成長及全球產業分析:按類型、應用和地區洞察,2026-2034年預測營養保健品原料市場-2025-2030年預測
 營養保健成分市場-全球產業規模、佔有率、趨勢、機會和預測,按類型、應用、形式、健康益處、地區和競爭細分,2020-2030 年
 全球膳食補充劑成分市場:需求與預測分析(2018-2034)
 營養補充品食品市場至2030年的預測:按類型、形式、功能、應用和地區的全球分析
 全球食品成分市場:按類型、應用、形式、功能、地區分類 - 預測至 2029 年