


 |
市場調查報告書
商品編碼
1892726
電力系統模擬器市場機會、成長促進因素、產業趨勢分析及預測(2025-2034年)Power System Simulator Market Opportunity, Growth Drivers, Industry Trend Analysis, and Forecast 2025 - 2034 |
||||||
2024 年全球電力系統模擬器市值為 8.321 億美元,預計到 2034 年將以 3.9% 的複合年成長率成長至 12.2 億美元。
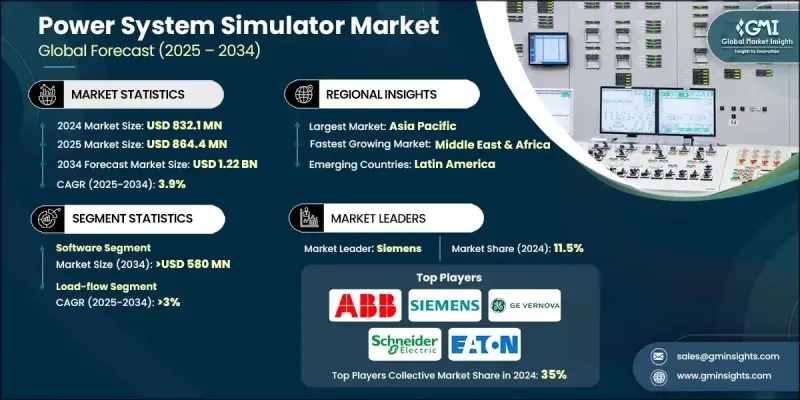
市場擴張的驅動力來自日益複雜的電網和再生能源資源的加速部署。隨著越來越多的國家向永續能源轉型,模擬工具在評估設計、執行壓力測試以及在不影響實際資產的情況下保障電網穩定性方面變得不可或缺。公共措施也正在加速市場發展,政策框架強調改善規劃、增強韌性和提高運作可靠性,而這些領域都高度依賴精確的模擬技術。電力公司和研究機構擴大採用即時數位模擬平台和硬體在環系統來驗證保護配置,並在再生能源變化的條件下評估基於逆變器的資源。數位孿生技術的發展勢頭也日益強勁,使營運商能夠建立其網路的虛擬模型,用於預測性診斷和效能最佳化。隨著全球能源網路的擴展和互聯,對先進模擬軟體的需求持續成長,這凸顯了複雜可再生能源併網場景下使用精密工具的重要性。
| 市場範圍 | |
|---|---|
| 起始年份 | 2024 |
| 預測年份 | 2025-2034 |
| 起始值 | 8.321億美元 |
| 預測值 | 12.2億美元 |
| 複合年成長率 | 3.9% |
預計到2034年,軟體市場規模將達到5.8億美元。這一成長與分散式能源、儲能技術和可變再生能源系統日益普及,導致電網複雜性不斷增加密切相關。基於軟體的模擬平台具有高度的適應性和對精確建模的支持,能夠幫助營運商最佳化應急策略,提升系統整體性能,同時規避物理基礎設施風險。
預計到 2034 年,短路模擬類別的市場規模將達到 2.9 億美元。該模組在評估故障事件期間的系統響應和計算故障電流方面發揮著至關重要的作用,確保正確選擇保護裝置,並驗證組件能否承受故障引起的應力。
2024年,美國電力系統模擬器市場規模預估為2.14億美元。其持續成長與再生能源的擴張、交通電氣化以及電網基礎設施的現代化密切相關。公用事業公司、科技公司和政府機構之間的緊密合作,促進了先進模擬系統的應用,而對智慧電網、計量技術和分散式資源整合的投資也進一步推動了這一趨勢。
目錄
第1章:方法論與範圍
第2章:執行概要
第3章:行業洞察
- 產業生態系分析
- 監管環境
- 產業影響因素
- 成長促進因素
- 產業陷阱與挑戰
- 成長潛力分析
- 波特的分析
- PESTEL 分析
- 新興機會與趨勢
- 數位化與物聯網整合
- 新興市場滲透
- 投資分析及未來展望
第4章:競爭格局
- 介紹
- 按地區分類的公司市佔率分析
- 北美洲
- 歐洲
- 亞太地區
- 中東和非洲
- 拉丁美洲
- 策略舉措
- 競爭基準描述
- 策略儀錶板
- 創新與技術格局
第5章:市場規模及預測:依產品類型分類,2021-2034年
- 硬體
- 軟體
- 服務
第6章:市場規模及預測:依模組分類,2021-2034年
- 負荷流
- 短路
- 電弧閃光
- 裝置配位選擇性
- 諧波
- 其他
第7章:市場規模及預測:依應用領域分類,2021-2034年
- 發電
- 輸配電
- 石油和天然氣
- 製造業
- 金屬與礦業
- 其他
第8章:市場規模及預測:依地區分類,2021-2034年
- 北美洲
- 美國
- 加拿大
- 墨西哥
- 歐洲
- 英國
- 法國
- 德國
- 義大利
- 俄羅斯
- 西班牙
- 亞太地區
- 中國
- 澳洲
- 印度
- 日本
- 韓國
- 中東和非洲
- 沙烏地阿拉伯
- 阿拉伯聯合大公國
- 土耳其
- 南非
- 埃及
- 拉丁美洲
- 巴西
- 阿根廷
第9章:公司簡介
- ABB
- AspenTech
- CORYS
- EATAP
- Eaton
- Fuji Electric
- GE Vernova
- Mathworks
- MATPOWER
- Nayak Corporation
- Neplan
- OPAL-RT
- PowerWorld
- Protasis
- RTDS Technologies
- Schneider Electric
- Siemens
- Vicor Corporation
The Global Power System Simulator Market was valued at USD 832.1 million in 2024 and is estimated to grow at a CAGR of 3.9% to reach USD 1.22 billion by 2034.
Market expansion is fueled by the growing complexity of electric grids and the accelerating deployment of renewable energy resources. As more nations transition toward sustainable power, simulation tools are becoming indispensable for evaluating designs, executing stress tests, and protecting grid stability without impacting real-world assets. Public initiatives are also accelerating market momentum, with policy frameworks emphasizing improved planning, resilience, and operational reliability areas that depend heavily on accurate simulation technologies. Utilities and research bodies are increasingly turning to real-time digital simulation platforms and hardware-in-the-loop systems to validate protection configurations and assess inverter-based resources under variable renewable conditions. Momentum around digital twins is also escalating, enabling operators to build virtual models of their networks for predictive diagnostics and performance refinement. As global energy networks expand and interconnect, the demand for advanced simulation software continues to grow, reinforcing the importance of sophisticated tools to support complex renewable integration scenarios.
| Market Scope | |
|---|---|
| Start Year | 2024 |
| Forecast Year | 2025-2034 |
| Start Value | $832.1 Million |
| Forecast Value | $1.22 Billion |
| CAGR | 3.9% |
The software segment is expected to reach USD 580 million by 2034. This growth is tied to rising grid complexity as distributed energy, storage technologies, and variable renewable systems become more prevalent. Software-based simulation platforms offer adaptability and support accurate modeling, helping operators refine contingency strategies and improve overall system performance while avoiding physical infrastructure risks.
The short-circuit simulation category is projected to reach USD 290 million by 2034. This module plays an essential role in evaluating system response during fault events and calculating fault currents, ensuring proper protection-device selection and verifying that components can withstand fault-induced stress.
United States Power System Simulator Market was valued at USD 214 million in 2024. Continued growth is closely linked to renewable energy expansion, transportation electrification, and the modernization of grid infrastructure. Strong cooperation between utilities, technology firms, and government bodies strengthens the adoption of advanced simulation systems, further supported by investments in smart grids, metering technologies, and distributed resource integration.
Key players in the Global Power System Simulator Market include Nayak Corporation, Neplan, Eaton, Protasis, AspenTech, PowerWorld, Onsemi, ABB, Opal-RT, GE Vernova, Siemens, MATPOWER, Vicor Corporation, Schneider Electric, NuScale Power Corporation, RTDS Technologies, Fuji Electric, EATAP, CORYS, and Mathworks. Companies participating in the Global Power System Simulator Market are using strategic initiatives to reinforce their global positioning. Many are investing in advanced simulation algorithms, cloud-based platforms, and modular software architectures to meet rising demands for flexible, real-time modeling. Firms are strengthening collaborations with utilities, research institutes, and grid operators to co-develop customized solutions tailored to renewable integration and grid modernization goals. Investments in digital twin platforms, cybersecurity enhancements, and high-fidelity HIL systems are supporting more accurate scenario analysis. Companies are expanding global service networks, offering training programs, and integrating AI-based analytics to differentiate their offerings.
Table of Contents
Chapter 1 Methodology & Scope
- 1.1 Research design
- 1.2 Market estimates & forecast parameters
- 1.3 Forecast calculation
- 1.4 Data sources
- 1.4.1 Primary
- 1.4.2 Secondary
- 1.4.2.1 Paid
- 1.4.2.2 Public
Chapter 2 Executive Summary
- 2.1 Industry synopsis, 2021 - 2034
Chapter 3 Industry Insights
- 3.1 Industry ecosystem analysis
- 3.2 Regulatory landscape
- 3.3 Industry impact forces
- 3.3.1 Growth drivers
- 3.3.2 Industry pitfalls & challenges
- 3.4 Growth potential analysis
- 3.5 Porter's analysis
- 3.5.1 Bargaining power of suppliers
- 3.5.2 Bargaining power of buyers
- 3.5.3 Threat of new entrants
- 3.5.4 Threat of substitutes
- 3.6 PESTEL analysis
- 3.6.1 Political factors
- 3.6.2 Economic factors
- 3.6.3 Social factors
- 3.6.4 Technological factors
- 3.6.5 Legal factors
- 3.6.6 Environmental factors
- 3.7 Emerging opportunities & trends
- 3.7.1 Digitalization & IoT integration
- 3.7.2 Emerging market penetration
- 3.8 Investment analysis & future outlook
Chapter 4 Competitive Landscape, 2025
- 4.1 Introduction
- 4.2 Company market share analysis, by Region, 2024
- 4.2.1 North America
- 4.2.2 Europe
- 4.2.3 Asia Pacific
- 4.2.4 Middle East & Africa
- 4.2.5 Latin America
- 4.3 Strategic initiatives
- 4.4 Competitive benchmarking depictions
- 4.5 Strategy dashboard
- 4.6 Innovation & technology landscape
Chapter 5 Market Size and Forecast, By Offering, 2021 - 2034 (USD Million)
- 5.1 Key trends
- 5.2 Hardware
- 5.3 Software
- 5.4 Services
Chapter 6 Market Size and Forecast, By Modules, 2021 - 2034 (USD Million)
- 6.1 Key trends
- 6.2 Load flow
- 6.3 Short circuit
- 6.4 Arc flash
- 6.5 Device coordination selectivity
- 6.6 Harmonics
- 6.7 Others
Chapter 7 Market Size and Forecast, By Application, 2021 - 2034 (USD Million)
- 7.1 Key trends
- 7.2 Power generation
- 7.3 Transmission & distribution
- 7.4 Oil & gas
- 7.5 Manufacturing
- 7.6 Metals & mining
- 7.7 Others
Chapter 8 Market Size and Forecast, By Region, 2021 - 2034 (USD Million)
- 8.1 Key trends
- 8.2 North America
- 8.2.1 U.S.
- 8.2.2 Canada
- 8.2.3 Mexico
- 8.3 Europe
- 8.3.1 UK
- 8.3.2 France
- 8.3.3 Germany
- 8.3.4 Italy
- 8.3.5 Russia
- 8.3.6 Spain
- 8.4 Asia Pacific
- 8.4.1 China
- 8.4.2 Australia
- 8.4.3 India
- 8.4.4 Japan
- 8.4.5 South Korea
- 8.5 Middle East & Africa
- 8.5.1 Saudi Arabia
- 8.5.2 UAE
- 8.5.3 Turkey
- 8.5.4 South Africa
- 8.5.5 Egypt
- 8.6 Latin America
- 8.6.1 Brazil
- 8.6.2 Argentina
Chapter 9 Company Profiles
- 9.1 ABB
- 9.2 AspenTech
- 9.3 CORYS
- 9.4 EATAP
- 9.5 Eaton
- 9.6 Fuji Electric
- 9.7 GE Vernova
- 9.8 Mathworks
- 9.9 MATPOWER
- 9.10 Nayak Corporation
- 9.11 Neplan
- 9.12 OPAL-RT
- 9.13 PowerWorld
- 9.14 Protasis
- 9.15 RTDS Technologies
- 9.16 Schneider Electric
- 9.17 Siemens
- 9.18 Vicor Corporation
 2026年全球電力系統模擬軟體市場報告
 電力系統模擬器市場 - 全球產業規模、佔有率、趨勢、機會及預測(按模組、組件、最終用戶、地區和競爭格局分類,2021-2031年)
 太陽能板保護市場按產品類型、安裝類型、技術、應用和分銷管道分類,全球預測(2026-2032年)
 電力系統模擬器市場規模、佔有率及成長分析(按組件、模組、最終用途和地區分類)-2026-2033年產業預測太陽能沼氣混合發電系統市場-全球產業規模、佔有率、趨勢、機會和預測(按技術、應用、最終用戶、系統配置、地區和競爭細分,2020-2030 年預測)
 2026 年至 2032 年電力系統模擬器市場(按模組、產品、最終用戶和地區分類)
 太陽能-沼氣混合發電系統市場預測至 2030 年:按組件、燃料類型、系統類型、容量、技術、最終用戶和地區進行的全球分析
 亞太電力系統模擬軟體市場:按應用、按產品、按國家 - 分析和預測(2023-2033)
 歐洲電力系統模擬軟體市場:按應用、按產品、按國家 - 分析和預測(2023-2033 年)
 電力系統模擬器市場:2024-2031年全球產業分析、規模、佔有率、成長、趨勢、預測