


 |
市場調查報告書
商品編碼
1892722
微移動出行整合系統市場機會、成長促進因素、產業趨勢分析及預測(2025-2034年)Micro-Mobility Integration Systems Market Opportunity, Growth Drivers, Industry Trend Analysis, and Forecast 2025 - 2034 |
||||||
2024 年全球微行動整合系統市場價值為 20 億美元,預計到 2034 年將以 16.4% 的複合年成長率成長至 87 億美元。
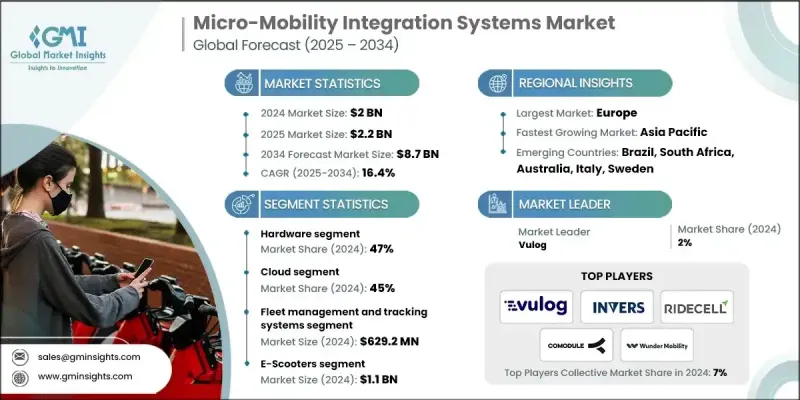
隨著微出行日益融入多模式網路,市場正經歷一場變革,重塑整個產業的技術架構、營運策略和商業模式。融合多種城市出行方式的平台正在提升效率、便利性和可及性,從而促進公共和私人領域的應用。人工智慧和機器學習的應用正在革新車隊管理,使營運商能夠利用預測分析、自動化決策和動態資源分配。這些進步提高了營運效率,減少了停機時間,並提升了車隊管理者的獲利能力。歐洲各地,尤其是城市中心,對智慧出行解決方案的需求不斷成長,進一步加速了其普及。政府和私人營運商正大力投資整合系統,以最佳化出行、緩解擁塞並提升用戶體驗。
| 市場範圍 | |
|---|---|
| 起始年份 | 2024 |
| 預測年份 | 2025-2034 |
| 起始值 | 20億美元 |
| 預測值 | 87億美元 |
| 複合年成長率 | 16.4% |
2024年,硬體部分佔據47%的市場佔有率,預計2025年至2034年將以16.1%的複合年成長率成長。生態系統中的硬體包括物聯網設備、車載資訊系統單元和充電基礎設施,例如有線和無線充電站、換電站、智慧門鎖、GPS模組和診斷感測器。出廠預裝的連接功能正日益成為標準配置,預計70%的新車隊將配備某種形式的物聯網整合。
到2024年,雲端運算市場佔有率將達到45%,預計到2034年將以17%的複合年成長率成長。 AWS、Azure和Google Cloud等雲端服務供應商提供的雲端平台可提供可擴展的應用軟體、分析引擎和維運工具。採用雲端運算可以減少對實體伺服器管理的需求,加快部署速度,支援行動訪問,並實現自動更新。
2024年,德國微出行整合系統市佔率達28%。眾多公司在多個城市營運無樁車輛,為使用者提供廣泛的共享滑板車和自行車服務。諸如城市地區車隊數量上限等監管框架,有助於控制市場成長並確保安全,同時支持永續的城市交通發展。
目錄
第1章:方法論與範圍
第2章:執行概要
第3章:行業洞察
- 產業生態系分析
- 供應商格局
- 零件製造商
- 平台提供者
- 連線和網路供應商
- 系統整合商和顧問
- 最終用途
- 支援服務
- 成本結構
- 利潤率
- 每個階段的價值增加
- 垂直整合趨勢
- 顛覆者
- 供應商格局
- 對力的影響
- 成長促進因素
- 都市化與最後一公里需求
- 科技與連接
- 永續性和監管支持
- 充電和電池基礎設施
- 產業陷阱與挑戰
- 前期整合成本高且監管複雜
- 安全風險和互通性問題
- 市場機遇
- 進階資料貨幣化與分析
- 向新興城市擴張
- 成長促進因素
- 技術趨勢與創新生態系統
- 目前技術
- 人工智慧與機器學習整合
- 預測性維護技術
- 自主再平衡系統
- 電池更換基礎設施
- 新興技術
- 5G 和邊緣運算應用
- 區塊鏈在支付和身份識別的應用
- 自主車隊最佳化
- 智慧電池更換和充電基礎設施中的數位孿生
- 目前技術
- 成長潛力分析
- 監管環境
- 聯邦法規
- 州和市級許可證要求
- 資料共享要求
- 安全標準
- 隱私與資料保護
- 區域監管比較
- 北美洲
- 歐洲
- 亞太
- 拉丁美洲
- 中東和非洲
- 波特的分析
- PESTEL 分析
- 專利分析
- 成本細分分析
- 價格趨勢
- 競爭性定價策略
- 軟體許可價格範圍
- 專業服務費率
- 供應商收入模式及策略
- 投資與融資分析
- 創投與私募股權趨勢
- 地理投資分佈
- 分階段融資分析
- 重大交易
- 從關注成長轉向關注獲利能力
- 專利分析
- 電池更換技術專利
- 車隊管理系統專利
- 物聯網及連接專利
- 充電基礎設施專利
- 主要專利持有人和受讓人
- 永續性和環境方面
- 永續實踐
- 減少廢棄物策略
- 生產中的能源效率
- 環保舉措
- 碳足跡考量
- 市場採納與滲透分析
- 技術採納生命週期
- 採用障礙和促進因素
- 市場滲透率分析
- 客戶決策歷程
- 用例分析及應用場景
- 用例框架及選擇標準
- 系統需求和整合點
- 支付系統整合
- 用例比較矩陣
- 客戶旅程與體驗地圖
- 車隊營運商
- 市/鎮
- 公車機構
- 旅遊即服務 (MaaS) 供應商
- 旅程比較矩陣
- 風險評估與風險矩陣
- 風險識別方法
- 風險評分法
- 熱圖可視化
- 風險監測與預警指標
- 採納與擴散曲線分析
- 創新擴散框架
- 車隊管理平台採用
- 電池更換基礎設施採用
- 地理擴散模式
- 技術替代曲線
第4章:競爭格局
- 介紹
- 公司市佔率分析
- 北美洲
- 歐洲
- 亞太
- 拉丁美洲
- 中東和非洲
- 競爭定位矩陣
- 戰略展望矩陣
- 關鍵進展
- 併購
- 合作夥伴關係與合作
- 新產品發布
- 擴張計劃和資金
- 高階定位策略
- 競爭分析與獨特賣點
第5章:市場估算與預測:依組件分類,2021-2034年
- 軟體平台
- 車隊管理
- 預約系統
- 支付和帳單系統
- 分析與報告
- 騎士應用程式/用戶介面
- 操作員儀錶板
- 硬體
- 物聯網設備/感測器
- GPS追蹤器/導航模組
- 智慧鎖
- 電池管理系統
- 車用控制器
- 充電樁/充電站
- 服務
- 諮詢顧問
- 系統整合
- 安裝與部署
- 維護與維修
- 客戶支援/服務台
- 培訓與入職
第6章:市場估計與預測:依技術分類,2021-2034年
- 車隊管理和追蹤系統
- 支付與帳單整合
- 物聯網連線與遠端資訊處理
- 充電和電池管理
- 數據分析與報告
- 地理圍籬和合規工具
第7章:市場估算與預測:依部署模式分類,2021-2034年
- 雲
- 混合
- 現場
第8章:市場估算與預測:依車輛類型分類,2021-2034年
- 電動滑板車
- 電動自行車
- 腳踏自行車
- 電動輕型機車
- 其他
第9章:市場估算與預測:依最終用途分類,2021-2034年
- 車隊營運商
- 市政當局
- 大學及企業園區
- 快遞公司
- 其他
第10章:市場估計與預測:依地區分類,2021-2034年
- 北美洲
- 美國
- 加拿大
- 歐洲
- 英國
- 德國
- 法國
- 義大利
- 西班牙
- 比利時
- 荷蘭
- 瑞典
- 俄羅斯
- 亞太地區
- 中國
- 印度
- 日本
- 澳洲
- 新加坡
- 韓國
- 越南
- 印尼
- 拉丁美洲
- 巴西
- 墨西哥
- 阿根廷
- MEA
- 南非
- 沙烏地阿拉伯
- 阿拉伯聯合大公國
第11章:公司簡介
- Software / platform providers
- ATOM Mobility
- Fifteen
- INVERS
- Joyride
- Movatic
- Passport
- Remix (Via)
- Ridecell
- Roam.ai
- Splyt
- Urban Sharing
- Vulog
- Wunder Mobility
- ZOBA
- Data & analytics platforms
- Fluctuo
- Populus
- Ride Report
- Vianova
- IoT & connectivity providers
- IoT
- Comodule
- KNOT
- Omni
- Onomondo
- Teltonika
- Computer Vision & AI
- Drover AI
- Luna Systems
- Battery & charging infrastructure
- Ample
- Gogoro
- Swiftmile
The Global Micro-Mobility Integration Systems Market was valued at USD 2 billion in 2024 and is estimated to grow at a CAGR of 16.4% to reach USD 8.7 billion by 2034.
The market is undergoing a transformation as micro-mobility becomes increasingly integrated into multimodal transportation networks, reshaping technology architecture, operational strategies, and business models across the industry. Platforms that combine various forms of urban mobility are driving efficiency, convenience, and accessibility, encouraging both public and private adoption. Fleet management is being revolutionized through the adoption of artificial intelligence and machine learning, allowing operators to leverage predictive analytics, automated decision-making, and dynamic resource allocation. These advancements are increasing operational efficiency, reducing downtime, and improving profitability for fleet managers. The growing demand for smart mobility solutions across Europe, particularly in urban centers, is further accelerating adoption, as governments and private operators invest heavily in integrated systems to optimize mobility, reduce congestion, and enhance user experience.
| Market Scope | |
|---|---|
| Start Year | 2024 |
| Forecast Year | 2025-2034 |
| Start Value | $2 Billion |
| Forecast Value | $8.7 Billion |
| CAGR | 16.4% |
The hardware segment held a 47% share in 2024 and is projected to grow at a CAGR of 16.1% from 2025 to 2034. Hardware in the ecosystem includes IoT devices, telematics units, and charging infrastructure, such as wired and wireless charging stations, battery swap stations, smart locks, GPS modules, and diagnostic sensors. Factory-installed connectivity is increasingly standard, with an estimated seventy percent of new fleets expected to feature some form of IoT integration.
The cloud segment accounted for a 45% share in 2024 and is anticipated to grow at a CAGR of 17% through 2034. Cloud platforms hosted by providers like AWS, Azure, and Google Cloud offer scalable application software, analytical engines, and operational tools. Cloud adoption reduces the need for physical server management, accelerates implementation, allows mobile access, and enables automatic updates.
Germany Micro-Mobility Integration Systems Market held a 28% share in 2024. Numerous companies operate dockless vehicles across multiple cities, providing widespread access to scooters and bike-sharing services. Regulatory frameworks, such as fleet caps in urban areas, are helping manage growth and ensure safety while supporting sustainable urban mobility expansion.
Major players in the Micro-Mobility Integration Systems Market include Atom Mobility, Comodule, INVERS, Joyride, Ridecell, Roam.ai, Urban Sharing, Vulog, Wunder Mobility, and Splyt. Companies in the Micro-Mobility Integration Systems Market are expanding their presence by investing in AI-driven fleet management and predictive analytics to improve vehicle uptime and operational efficiency. They are integrating IoT-enabled hardware and smart charging infrastructure to provide seamless connectivity and enhance the user experience. Strategic partnerships with local authorities, mobility operators, and technology providers allow companies to scale rapidly in urban markets. Cloud-based solutions and platform interoperability are prioritized to facilitate multimodal transportation integration and streamline operations.
Table of Contents
Chapter 1 Methodology & Scope
- 1.1 Research design
- 1.1.1 Research approach
- 1.1.2 Data collection methods
- 1.2 Base estimates and calculations
- 1.2.1 Base year calculation
- 1.2.2 Key trends for market estimates
- 1.3 Forecast
- 1.4 Primary research and validation
- 1.5 Some of the primary sources
- 1.6 Data mining sources
- 1.6.1 Secondary
- 1.6.1.1 Paid Sources
- 1.6.1.2 Public Sources
- 1.6.1.3 Sources, by region
- 1.6.1 Secondary
- 1.7 Inclusion & Exclusion
Chapter 2 Executive Summary
- 2.1 Industry 3600 synopsis
- 2.2 Key market trends
- 2.2.1 Regional
- 2.2.2 Component
- 2.2.3 Technology
- 2.2.4 Deployment mode
- 2.2.5 Vehicle
- 2.2.6 End use
- 2.3 TAM Analysis, 2025-2034
- 2.4 CXO perspectives: Strategic imperatives
- 2.4.1 Key decision points for industry executives
- 2.4.2 Critical success factors for market players
- 2.5 Future outlook and strategic recommendations
Chapter 3 Industry Insights
- 3.1 Industry ecosystem analysis
- 3.1.1 Supplier landscape
- 3.1.1.1 Component manufacturers
- 3.1.1.2 Platform providers
- 3.1.1.3 Connectivity & network providers
- 3.1.1.4 System integrators & consultants
- 3.1.1.5 End use
- 3.1.1.6 Supporting services
- 3.1.2 Cost structure
- 3.1.3 Profit margin
- 3.1.4 Value addition at each stage
- 3.1.5 Vertical integration trends
- 3.1.6 Disruptors
- 3.1.1 Supplier landscape
- 3.2 Impact on forces
- 3.2.1 Growth drivers
- 3.2.1.1 Urbanization & last-mile demand
- 3.2.1.2 Technology & connectivity
- 3.2.1.3 Sustainability & regulatory support
- 3.2.1.4 Charging & battery infrastructure
- 3.2.2 Industry pitfalls & challenges
- 3.2.2.1 High upfront integration & regulatory complexity
- 3.2.2.2 Safety risks & interoperability issues
- 3.2.3 Market opportunities
- 3.2.3.1 Advanced data monetization & analytics
- 3.2.3.2 Expansion to emerging cities
- 3.2.1 Growth drivers
- 3.3 Technology trends & innovation ecosystem
- 3.3.1 Current technologies
- 3.3.1.1 AI & machine learning integration
- 3.3.1.2 Predictive maintenance technologies
- 3.3.1.3 Autonomous rebalancing systems
- 3.3.1.4 Battery swapping infrastructure
- 3.3.2 Emerging technologies
- 3.3.2.1 5G & edge computing applications
- 3.3.2.2 Blockchain for payments & identity
- 3.3.2.3 Autonomous fleet optimization
- 3.3.2.4 Digital twins in smart battery swapping and charging infrastructure
- 3.3.1 Current technologies
- 3.4 Growth potential analysis
- 3.5 Regulatory landscape
- 3.5.1 Federal regulations
- 3.5.2 State & municipal permitting requirements
- 3.5.3 Data sharing mandates
- 3.5.4 Safety standards
- 3.5.5 Privacy & data protection
- 3.5.6 Regional regulatory comparison
- 3.5.6.1 North America
- 3.5.6.2 Europe
- 3.5.6.3 Asia-Pacific
- 3.5.6.4 Latin America
- 3.5.6.5 Middle East & Africa
- 3.6 Porter's analysis
- 3.7 PESTEL analysis
- 3.8 Patent analysis
- 3.9 Cost breakdown analysis
- 3.10 Price trends
- 3.10.1 Competitive pricing strategies
- 3.10.2 Software licensing price ranges
- 3.10.3 Professional services rates
- 3.10.4 Vendor revenue models & strategies
- 3.11 Investment & Funding Analysis
- 3.11.1 Venture capital & private equity trends
- 3.11.2 Geographic investment distribution
- 3.11.3 Stage-wise funding analysis
- 3.11.4 Major deals & transactions
- 3.11.5 Shift from growth to profitability focus
- 3.12 Patent analysis
- 3.12.1 Battery swapping technology patents
- 3.12.2 Fleet management system patents
- 3.12.3 IoT & connectivity patents
- 3.12.4 Charging infrastructure patents
- 3.12.5 Key patent holders & assignees
- 3.13 Sustainability and environmental aspects
- 3.13.1 Sustainable practices
- 3.13.2 Waste reduction strategies
- 3.13.3 Energy efficiency in production
- 3.13.4 Eco-friendly initiatives
- 3.13.5 Carbon footprint considerations
- 3.14 Market adoption & penetration analysis
- 3.14.1 Technology adoption lifecycle
- 3.14.2 Adoption barriers & enablers
- 3.14.3 Market penetration analysis
- 3.14.4 Customer decision journey
- 3.15 Use case analysis & application scenarios
- 3.15.1 Use case framework & selection criteria
- 3.15.2 System requirements & integration points
- 3.15.3 Payment system integration
- 3.15.4 Use case comparison matrix
- 3.16 Customer Journey & Experience Mapping
- 3.16.1 Fleet operator
- 3.16.2 Municipality/city
- 3.16.3 Transit agency
- 3.16.4 MaaS provider
- 3.16.5 Journey comparison matrix
- 3.17 Risk assessment & risk matrix
- 3.17.1 Risk identification methodology
- 3.17.2 Risk scoring methodology
- 3.17.3 Heat map visualization
- 3.17.4 Risk monitoring & early warning indicators
- 3.18 Adoption & diffusion curve analysis
- 3.18.1 Diffusion of innovation framework
- 3.18.2 Fleet management platform adoption
- 3.18.3 Battery swapping infrastructure adoption
- 3.18.4 Geographic diffusion patterns
- 3.18.5 Technology substitution curves
Chapter 4 Competitive Landscape, 2024
- 4.1 Introduction
- 4.2 Company market share analysis
- 4.2.1 North America
- 4.2.2 Europe
- 4.2.3 Asia-Pacific
- 4.2.4 Latin America
- 4.2.5 Middle East & Africa
- 4.3 Competitive positioning matrix
- 4.4 Strategic outlook matrix
- 4.5 Key developments
- 4.5.1 Mergers & acquisitions
- 4.5.2 Partnerships & collaborations
- 4.5.3 New product launches
- 4.5.4 Expansion plans and funding
- 4.6 Premium positioning strategies
- 4.7 Competitive analysis and USPs
Chapter 5 Market Estimates & Forecast, By Component, 2021 - 2034 ($Bn, units)
- 5.1 Key trends
- 5.1.1 Software Platforms
- 5.1.1.1 Fleet management
- 5.1.1.2 Booking systems
- 5.1.1.3 Payment & billing systems
- 5.1.1.4 Analytics & reporting
- 5.1.1.5 Rider apps / user interface
- 5.1.1.6 Operator dashboards
- 5.1.2 Hardware
- 5.1.2.1 IoT devices / sensors
- 5.1.2.2 GPS trackers / navigation modules
- 5.1.2.3 Smart locks
- 5.1.2.4 Battery management systems
- 5.1.2.5 Vehicle-mounted controllers
- 5.1.2.6 Charging docks / stations
- 5.1.3 Services
- 5.1.3.1 Consulting & advisory
- 5.1.3.2 System integration
- 5.1.3.3 Installation & deployment
- 5.1.3.4 Maintenance & repair
- 5.1.3.5 Customer support / helpdesk
- 5.1.3.6 Training & onboarding
- 5.1.1 Software Platforms
Chapter 6 Market Estimates & Forecast, By Technology, 2021 - 2034 ($Bn, units)
- 6.1 Key trends
- 6.2 Fleet management & tracking systems
- 6.3 Payment & billing integration
- 6.4 IoT connectivity & telematics
- 6.5 Charging & battery management
- 6.6 Data analytics & reporting
- 6.7 Geofencing & compliance tools
Chapter 7 Market Estimates & Forecast, By Deployment mode, 2021 - 2034 ($Bn, units)
- 7.1 Key trends
- 7.2 Cloud
- 7.3 Hybrid
- 7.4 On-premises
Chapter 8 Market Estimates & Forecast, By Vehicle, 2021 - 2034 ($Bn, units)
- 8.1 Key trends
- 8.2 E-scooters
- 8.3 E-bikes
- 8.4 Pedal bikes
- 8.5 E-mopeds
- 8.6 Others
Chapter 9 Market Estimates & Forecast, By End Use, 2021 - 2034 ($Bn, units)
- 9.1 Key trends
- 9.2 Fleet operators
- 9.3 Municipalities
- 9.4 Universities & corporate campuses
- 9.5 Delivery companies
- 9.6 Others
Chapter 10 Market Estimates & Forecast, By Region, 2021 - 2034 ($Bn, units)
- 10.1 North America
- 10.1.1 US
- 10.1.2 Canada
- 10.2 Europe
- 10.2.1 UK
- 10.2.2 Germany
- 10.2.3 France
- 10.2.4 Italy
- 10.2.5 Spain
- 10.2.6 Belgium
- 10.2.7 Netherlands
- 10.2.8 Sweden
- 10.2.9 Russia
- 10.3 Asia Pacific
- 10.3.1 China
- 10.3.2 India
- 10.3.3 Japan
- 10.3.4 Australia
- 10.3.5 Singapore
- 10.3.6 South Korea
- 10.3.7 Vietnam
- 10.3.8 Indonesia
- 10.4 Latin America
- 10.4.1 Brazil
- 10.4.2 Mexico
- 10.4.3 Argentina
- 10.5 MEA
- 10.5.1 South Africa
- 10.5.2 Saudi Arabia
- 10.5.3 UAE
Chapter 11 Company Profiles
- 11.1 Software / platform providers
- 11.1.1 ATOM Mobility
- 11.1.2 Fifteen
- 11.1.3 INVERS
- 11.1.4 Joyride
- 11.1.5 Movatic
- 11.1.6 Passport
- 11.1.7 Remix (Via)
- 11.1.8 Ridecell
- 11.1.9 Roam.ai
- 11.1.10 Splyt
- 11.1.11 Urban Sharing
- 11.1.12 Vulog
- 11.1.13 Wunder Mobility
- 11.1.14 ZOBA
- 11.2 Data & analytics platforms
- 11.2.1 Fluctuo
- 11.2.2 Populus
- 11.2.3 Ride Report
- 11.2.4 Vianova
- 11.3 IoT & connectivity providers
- 11.3.1. IoT
- 11.3.2 Comodule
- 11.3.3 KNOT
- 11.3.4 Omni
- 11.3.5 Onomondo
- 11.3.6 Teltonika
- 11.4 Computer Vision & AI
- 11.4.1 Drover AI
- 11.4.2 Luna Systems
- 11.5 Battery & charging infrastructure
- 11.5.1 Ample
- 11.5.2 Gogoro
- 11.5.3 Swiftmile
 智慧型設備整合市場分析及預測(至2035年,醫療保健領域):按類型、產品類型、服務、技術、組件、應用、最終用戶、部署模式、功能及解決方案分類醫療保健IT市場分析及預測(至2035年):按類型、產品類型、服務、技術、組件、應用、部署類型、最終用戶、解決方案和模式分類醫療保健工作流程的人工智慧市場分析及預測(至2035年):按類型、產品、服務、技術、組件、應用、部署類型、最終用戶、功能和解決方案分類醫療保健資訊系統市場分析及預測(至2035年):按類型、產品類型、服務、技術、組件、應用、部署類型、最終用戶、功能和解決方案分類
 醫療保健IT市場規模、佔有率和趨勢分析報告:按應用、交付模式、最終用途、地區和細分市場預測(2026-2033年)
 2025-2029年全球醫療資訊系統市場
 2026-2030年全球醫療保健IT市場
 醫藥知識管理軟體市場-全球產業規模、佔有率、趨勢、機會、預測:按部署方式、組織規模、地區和競爭格局分類,2021-2031年
 手術室中央控制系統市場按類型、部署模式、應用和最終用戶分類,全球預測(2026-2032年)智慧型內視鏡模組市場按產品類型、技術、用途、應用和最終用戶分類-全球預測,2026-2032年