


 |
市場調查報告書
商品編碼
1892697
需量反應式交通系統市場機會、成長促進因素、產業趨勢分析及預測(2025-2034年)Demand-Responsive Transit Systems Market Opportunity, Growth Drivers, Industry Trend Analysis, and Forecast 2025 - 2034 |
||||||
2024 年全球需量反應式交通系統市場價值為 252 億美元,預計到 2034 年將以 15.3% 的複合年成長率成長至 1,026 億美元。
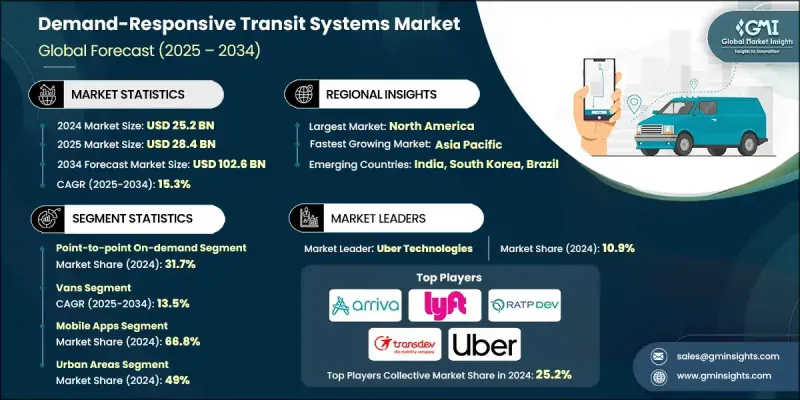
隨著各地採用能夠適應不同客流量並填補公共交通不足空白的靈活出行服務,需量反應式交通正在蓬勃發展。政府部門的參與度不斷提高,各機構也逐漸認知到動態交通模式帶來的效率提升,營運評估持續表明,資源利用和出行管理均有所改善。先進技術的應用如今已成為市場成長的核心,即時調度工具、行動預訂平台和智慧路線規劃軟體使營運商能夠更有效地管理共乘出行,並減少不必要的行駛里程。這些系統還能在無需擴充車隊的情況下提高可靠性,進而為城市和鄉村應用打造更有效率、更具可擴展性的服務模式。隨著數位化融合重塑交通生態系統,需量反應式網路正成為多個地區現代交通規劃的關鍵組成部分。
| 市場範圍 | |
|---|---|
| 起始年份 | 2024 |
| 預測年份 | 2025-2034 |
| 起始值 | 252億美元 |
| 預測值 | 1026億美元 |
| 複合年成長率 | 15.3% |
2024年,點對點按需出行市場將佔據31.7%的市場。市場之所以領先,是因為乘客越來越重視靈活、直接的出行方案,這些方案能夠最大限度地減少等待時間並提供個人化路線。服務提供者則受益於更高的車輛利用率和更低的營運成本,從而支持更永續的服務模式。
2024年,廂型車市場佔據主導地位,預計2025年至2034年將以13.5%的複合年成長率成長。廂型車憑藉著適應性強、載客量適宜且價格實惠等優勢,仍是首選車型。它們既能行駛於狹窄道路,也能在客流量適中的路段行駛,因此深受希望在滿足路線需求的同時最佳化成本結構的營運商青睞。在需要更有效率客流量管理的地區,小型客車將繼續作為廂型車的補充車款。
2024年,美國按需響應式公車系統市場佔80.7%的市場佔有率,市場規模達73億美元。按需響應式公車在農村和低密度地區迅速普及,為當地居民提供經濟實惠的出行方案,並提升交通公平性。多項分析表明,以動態系統取代固定線路服務能夠顯著降低單次出行成本,並顯著提高客流量,從而凸顯靈活模式的營運優勢。
目錄
第1章:方法論
第2章:執行概要
第3章:行業洞察
- 產業生態系分析
- 供應商格局
- 利潤率分析
- 成本結構
- 每個階段的價值增加
- 影響價值鏈的因素
- 中斷
- 產業影響因素
- 成長促進因素
- 都市化進程加速和微型出行需求增加
- 即時路線規劃、動態調度和行動應用的進步
- 政策推動減少壅塞和排放
- 對輔助客運和最後一公里解決方案的需求不斷成長
- 產業陷阱與挑戰
- 城市間監管框架各不相同
- 公共運輸現有業者的阻力及資金限制
- 市場機遇
- 與出行即服務平台和交通機構的整合
- 電氣化和微型交通(電動接駁車、電動自行車/滑板車)
- 成長促進因素
- 成長潛力分析
- 監管環境
- 北美洲
- 歐洲
- 亞太地區
- 拉丁美洲
- 中東和非洲
- 波特的分析
- PESTEL分析
- 技術與創新格局
- 當前技術趨勢
- 新興技術
- 定價分析
- 軟體即服務 (SaaS) 定價模式
- 依行程及依乘車次數定價結構
- 交鑰匙解決方案定價
- 總擁有成本分析
- 成本細分分析
- 專利與智慧財產權分析
- 動態路由演算法專利
- 需求預測與匹配技術專利
- 無障礙技術專利
- 永續性和環境方面
- 永續實踐
- 減少廢棄物策略
- 生產中的能源效率
- 環保舉措
- 碳足跡考量
- 用例
- 最佳情況
- 投資與融資分析
- 創投與私募股權投資
- 政府撥款及補貼(《聯邦稅法》第5310、5311條)
- 公私合作模式
- 使用者採納障礙與數位落差評估
- 科技素養與人口挑戰
- 智慧型手機普及率和設備可訪問性
- 多通路預訂要求(應用程式、網頁、互動式語音應答系統、簡訊、呼叫中心)
- 語言和文化障礙
- 信任和隱私問題
- 包容性服務設計策略
- 按服務模式分類的營運成本結構與經濟效益
- 輔助客運單次行程成本分析
- 微型公車每乘客英里成本
- 固定線路與按需響應式成本比較
- 人工成本構成(司機、調度員、呼叫中心)
- 技術和軟體授權成本
- 車輛購置及維修成本
- 燃料與能源成本(內燃機汽車與電動車)
- 行政和管理費用分配
- 補貼要求及票款回收率
第4章:競爭格局
- 介紹
- 公司市佔率分析
- 北美洲
- 歐洲
- 亞太地區
- 拉丁美洲
- MEA
- 主要市場參與者的競爭分析
- 競爭定位矩陣
- 戰略展望矩陣
- 關鍵進展
- 併購
- 合作夥伴關係與合作
- 新產品發布
- 擴張計劃和資金
第5章:市場估計與預測:依服務業分類,2021-2034年
- 輔助客運
- 微型公車
- 預約乘車服務
- 路線偏離服務
- 點對點按需
- 訂閱式服務
- 其他
第6章:市場估價與預測:依車輛類型分類,2021-2034年
- 范斯
- 敞篷巴士
- 小巴
- 轎車和汽車
- 電動車(EV)
- 自動駕駛汽車(AV)
第7章:市場估計與預測:依技術分類,2021-2034年
- 傳統預約系統
- 行動應用
- 其他
第8章:市場估算與預測:依應用領域分類,2021-2034年
- 都市地區
- 農村地區
- 公司的
- 公部門
- 其他
第9章:市場估計與預測:依地區分類,2021-2034年
- 北美洲
- 美國
- 加拿大
- 歐洲
- 德國
- 英國
- 法國
- 義大利
- 西班牙
- 北歐
- 俄羅斯
- 亞太地區
- 中國
- 印度
- 日本
- 澳洲
- 韓國
- 新加坡
- 馬來西亞
- 泰國
- 拉丁美洲
- 巴西
- 墨西哥
- 阿根廷
- MEA
- 南非
- 沙烏地阿拉伯
- 阿拉伯聯合大公國
第10章:公司簡介
- 全球參與者
- Ecolane
- Lyft
- Masabi
- Moovit
- Optibus
- Spare Labs
- TransLoc
- Trapeze
- Uber Technologies
- Via Transportation
- 區域玩家
- Arriva
- Go-Ahead
- Keolis
- Padam Mobility
- RATP Dev
- Transdev
- 新興及小眾玩家
- Clever Devices
- Remix
- Routematch
- TripSpark Technologies
The Global Demand-Responsive Transit Systems Market was valued at USD 25.2 billion in 2024 and is estimated to grow at a CAGR of 15.3% to reach USD 102.6 billion by 2034.
Demand-responsive transit is expanding as regions adopt flexible mobility services capable of adapting to varying passenger volumes and filling gaps where public transportation remains limited. Government involvement continues to strengthen as agencies recognize the efficiency gains of dynamic transportation models, with operational assessments consistently demonstrating improvements in resource use and trip management. The adoption of advanced technology is now central to market growth, as real-time dispatching tools, mobile booking platforms, and intelligent routing software allow operators to manage pooled trips more effectively and reduce unnecessary miles traveled. These systems also increase reliability without requiring fleets to expand, creating a more efficient and scalable service model for both urban and rural applications. As digital integration reshapes the transit ecosystem, demand-responsive networks are becoming a critical component in modern transportation planning across multiple regions.
| Market Scope | |
|---|---|
| Start Year | 2024 |
| Forecast Year | 2025-2034 |
| Start Value | $25.2 Billion |
| Forecast Value | $102.6 Billion |
| CAGR | 15.3% |
The point-to-point on-demand segment held a 31.7% share in 2024. This segment leads because passengers increasingly value flexible, direct travel solutions that minimize wait times and provide tailored routing. Service providers benefit through higher vehicle utilization and lower operating costs, which support more sustainable service models.
The vans segment dominated in 2024 and is forecast to grow at 13.5% CAGR from 2025 to 2034. Vans remain the preferred vehicle type due to their adaptability, suitable passenger capacity, and affordability. Their ability to navigate both narrow roads and moderate-demand corridors makes them popular for operators looking to match route needs with optimized cost structures. In areas requiring greater passenger volume management, cutaway buses continue to complement van-based deployments.
US Demand-Responsive Transit Systems Market accounted for 80.7% share and generated USD 7.3 billion in 2024. Demand-responsive transit has gained traction across rural and lower-density regions, where it provides an economical mobility solution and enhances transportation equity. In multiple analyses, replacing fixed-route services with dynamic systems has demonstrated significant reductions in per-trip costs and notable increases in ridership, reinforcing the operational advantages of flexible models.
Major companies in the Demand-Responsive Transit Systems Market include Arriva, Go-Ahead, Keolis, Lyft, Moovit, Padam Mobility, RATP Dev, Transdev, Uber Technologies, and Via Transportation. Companies in the Demand-Responsive Transit Systems Market are strengthening their market position by expanding digital platforms, enhancing real-time routing algorithms, and investing in integrated mobility solutions that connect multiple transportation modes. Many organizations are partnering with municipalities and transit agencies to deploy turnkey systems that streamline booking, dispatch, and fleet coordination. Strategic emphasis is placed on lowering operational costs through advanced data analytics, which improves load balancing and reduces unnecessary mileage. Firms are also creating modular service models tailored to suburban, urban, and rural environments to broaden their customer base.
Table of Contents
Chapter 1 Methodology
- 1.1 Market scope and definition
- 1.2 Research design
- 1.2.1 Research approach
- 1.2.2 Data collection methods
- 1.3 Data mining sources
- 1.3.1 Global
- 1.3.2 Regional/Country
- 1.4 Base estimates and calculations
- 1.4.1 Base year calculation
- 1.4.2 Key trends for market estimation
- 1.5 Primary research and validation
- 1.5.1 Primary sources
- 1.6 Forecast
- 1.7 Research assumptions and limitations
Chapter 2 Executive Summary
- 2.1 Industry 360° synopsis, 2021 - 2034
- 2.2 Key market trends
- 2.2.1 Regional
- 2.2.2 Service
- 2.2.3 Vehicle
- 2.2.4 Technology
- 2.2.5 Application
- 2.3 TAM Analysis, 2025-2034
- 2.4 CXO perspectives: Strategic imperatives
- 2.4.1 Executive decision points
- 2.4.2 Critical success factors
- 2.5 Future outlook and strategic recommendations
Chapter 3 Industry Insights
- 3.1 Industry ecosystem analysis
- 3.1.1 Supplier landscape
- 3.1.2 Profit margin analysis
- 3.1.3 Cost structure
- 3.1.4 Value addition at each stage
- 3.1.5 Factor affecting the value chain
- 3.1.6 Disruptions
- 3.2 Industry impact forces
- 3.2.1 Growth drivers
- 3.2.1.1 Growing urbanization and micro-mobility demand
- 3.2.1.2 Advances in real-time routing, dynamic dispatch & mobile apps
- 3.2.1.3 Policy push towards reducing congestion & emissions
- 3.2.1.4 Rising demand for paratransit and first/last-mile solutions
- 3.2.2 Industry pitfalls and challenges
- 3.2.2.1 Variable regulatory frameworks across cities
- 3.2.2.2 Public transit incumbents’ resistance & funding limits
- 3.2.3 Market opportunities
- 3.2.3.1 Integration with MaaS platforms and transit agencies
- 3.2.3.2 Electrification and micro-transit (EV shuttles, e-bikes/scooters)
- 3.2.1 Growth drivers
- 3.3 Growth potential analysis
- 3.4 Regulatory landscape
- 3.4.1 North America
- 3.4.2 Europe
- 3.4.3 Asia Pacific
- 3.4.4 Latin America
- 3.4.5 Middle East & Africa
- 3.5 Porter's analysis
- 3.6 Pestel analysis
- 3.7 Technology and innovation landscape
- 3.7.1 Current technological trends
- 3.7.2 Emerging technologies
- 3.8 Pricing analysis
- 3.8.1 Software-as-a-service (SaaS) pricing models
- 3.8.2 Per-trip and per-ride pricing structures
- 3.8.3 Turnkey solution pricing
- 3.8.4 Total cost of ownership analysis
- 3.9 Cost breakdown analysis
- 3.10 Patent & intellectual property analysis
- 3.10.1 Dynamic routing algorithm patents
- 3.10.2 Demand prediction and matching technology patents
- 3.10.3 Accessibility technology patents
- 3.11 Sustainability and environmental aspects
- 3.11.1 Sustainable practices
- 3.11.2 Waste reduction strategies
- 3.11.3 Energy efficiency in production
- 3.11.4 Eco-friendly Initiatives
- 3.11.5 Carbon footprint considerations
- 3.12 Use cases
- 3.13 Best-case scenario
- 3.14 Investment & funding analysis
- 3.14.1 Venture capital and private equity investments
- 3.14.2 Government grants and subsidies (FTA section 5310, 5311)
- 3.14.3 Public-private partnership models
- 3.15 User adoption barriers & digital divide assessment
- 3.15.1 Technology literacy and demographic challenges
- 3.15.2 Smartphone penetration and device accessibility
- 3.15.3 Multi-channel booking requirements (app, web, IVR, SMS, call center)
- 3.15.4 Language and cultural barriers
- 3.15.5 Trust and privacy concerns
- 3.15.6 Strategies for inclusive service design
- 3.16 Operational cost structure & economics by service model
- 3.16.1 Paratransit cost per trip analysis
- 3.16.2 Microtransit cost per passenger mile
- 3.16.3 Fixed-route vs. demand-responsive cost comparison
- 3.16.4 Labor cost components (driver, dispatch, call center)
- 3.16.5 Technology and software licensing costs
- 3.16.6 Vehicle acquisition and maintenance costs
- 3.16.7 Fuel and energy costs (ICE vs. EV)
- 3.16.8 Administrative and overhead allocation
- 3.16.9 Subsidy requirements and farebox recovery ratios
Chapter 4 Competitive Landscape, 2024
- 4.1 Introduction
- 4.2 Company market share analysis
- 4.2.1 North America
- 4.2.2 Europe
- 4.2.3 Asia Pacific
- 4.2.4 LATAM
- 4.2.5 MEA
- 4.3 Competitive analysis of major market players
- 4.4 Competitive positioning matrix
- 4.5 Strategic outlook matrix
- 4.6 Key developments
- 4.6.1 Mergers & acquisitions
- 4.6.2 Partnerships & collaborations
- 4.6.3 New product launches
- 4.6.4 Expansion plans and funding
Chapter 5 Market Estimates & Forecast, By Services, 2021 - 2034 ($Mn)
- 5.1 Key trends
- 5.2 Paratransit
- 5.3 Microtransit
- 5.4 Dial-a-Ride
- 5.5 Route Deviation Services
- 5.6 Point-to-Point On-Demand
- 5.7 Subscription-Based Services
- 5.8 Others
Chapter 6 Market Estimates & Forecast, By Vehicle, 2021 - 2034 ($Mn)
- 6.1 Key trends
- 6.2 Vans
- 6.3 Cutaway Buses
- 6.4 Minibuses
- 6.5 Sedans & Cars
- 6.6 Electric Vehicles (EVs)
- 6.7 Autonomous Vehicles (AVs)
Chapter 7 Market Estimates & Forecast, By Technology, 2021 - 2034 ($Mn)
- 7.1 Key trends
- 7.2 Traditional booking system
- 7.3 Mobile apps
- 7.4 Others
Chapter 8 Market Estimates & Forecast, By Application, 2021 - 2034 ($Mn)
- 8.1 Key trends
- 8.2 Urban areas
- 8.3 Rural areas
- 8.4 Corporate
- 8.5 Public sector
- 8.6 Others
Chapter 9 Market Estimates & Forecast, By Region, 2021 - 2034 ($Mn)
- 9.1 Key trends
- 9.2 North America
- 9.2.1 US
- 9.2.2 Canada
- 9.3 Europe
- 9.3.1 Germany
- 9.3.2 UK
- 9.3.3 France
- 9.3.4 Italy
- 9.3.5 Spain
- 9.3.6 Nordics
- 9.3.7 Russia
- 9.4 Asia Pacific
- 9.4.1 China
- 9.4.2 India
- 9.4.3 Japan
- 9.4.4 Australia
- 9.4.5 South Korea
- 9.4.6 Singapore
- 9.4.7 Malaysia
- 9.4.8 Thailand
- 9.5 Latin America
- 9.5.1 Brazil
- 9.5.2 Mexico
- 9.5.3 Argentina
- 9.6 MEA
- 9.6.1 South Africa
- 9.6.2 Saudi Arabia
- 9.6.3 UAE
Chapter 10 Company Profiles
- 10.1 Global Players
- 10.1.1 Ecolane
- 10.1.2 Lyft
- 10.1.3 Masabi
- 10.1.4 Moovit
- 10.1.5 Optibus
- 10.1.6 Spare Labs
- 10.1.7 TransLoc
- 10.1.8 Trapeze
- 10.1.9 Uber Technologies
- 10.1.10 Via Transportation
- 10.2 Regional Players
- 10.2.1 Arriva
- 10.2.2 Go-Ahead
- 10.2.3 Keolis
- 10.2.4 Padam Mobility
- 10.2.5 RATP Dev
- 10.2.6 Transdev
- 10.3 Emerging & Niche Players
- 10.3.1 Clever Devices
- 10.3.2 Remix
- 10.3.3 Routematch
- 10.3.4 TripSpark Technologies


