

 |
市場調查報告書
商品編碼
1892646
行動數據分析平台市場機會、成長促進因素、產業趨勢分析及預測(2025-2034 年)Mobility Data Analytics Platforms Market Opportunity, Growth Drivers, Industry Trend Analysis, and Forecast 2025 - 2034 |
||||||
2024 年全球行動數據分析平台市值為 21.6 億美元,預計到 2034 年將以 18.1% 的複合年成長率成長至 112 億美元。
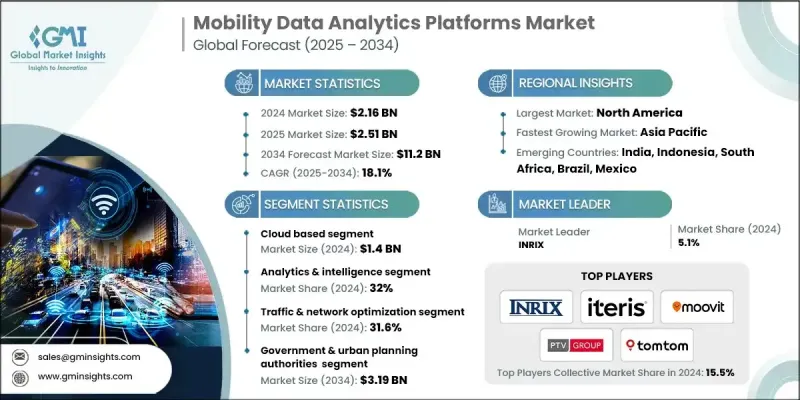
隨著各機構將重心轉向即時多模式出行智慧,市場正加速發展。即時多模式出行智慧支援對交通、大眾運輸、貨運和微出行系統的持續監控。這種能力能夠強化日常決策,實現自適應訊號調整,縮短網路中斷期間的反應時間,並提升出行者資訊的品質。這些優點共同作用,有助於緩解交通堵塞,提高服務可靠性,保障網路安全運行,並提升整體營運績效。人工智慧驅動的預測與出行數位孿生技術相結合,正在重塑長期規劃。這些工具能夠更深入地洞察新興出行模式、潛在擁塞點和基礎設施準備情況,使利害關係人能夠測試各種場景,指導策略性投資,並提前應對系統風險。隨著連網車輛、物聯網終端和先進感測技術的快速發展,資料量和資料精度正以驚人的速度成長。隨著資料集日益豐富,出行分析能夠提供更強大的即時風險偵測能力,支援預測性的維護活動,加強多模式協調,擴展智慧城市功能,豐富使用者體驗,並加速智慧和自動駕駛出行創新技術的推廣應用。
| 市場範圍 | |
|---|---|
| 起始年份 | 2024 |
| 預測年份 | 2025-2034 |
| 起始值 | 21.6億美元 |
| 預測值 | 112億美元 |
| 複合年成長率 | 18.1% |
2024年,雲端平台創造了14億美元的收入,預計到2034年將以18.9%的複合年成長率成長。其成長勢頭主要源於對可擴展基礎設施、更低前期投資以及即時存取現代人工智慧工具的需求。這些雲端環境還支援快速部署和遠端訪問,採用軟體即服務(SaaS)或平台即服務(PaaS)模式,從而降低了財務風險。對於那些沒有資源維護本地系統或高效能運算環境的組織而言,雲端平台的應用尤為強勁。
2024年,分析和智慧領域佔據32%的市場佔有率,預計2025年至2034年將以21.2%的複合年成長率成長。該領域的成長與連網汽車技術、遠端資訊處理和物聯網驅動的資料產生蓬勃發展密切相關。新型即時資料管道和串流架構能夠實現更快、更準確的資料收集,從而支援在交通監管、車隊最佳化、交通規劃、預測建模和城市交通管理等領域提供即時的營運洞察。
2024年,美國行動數據分析平台市場佔了87%的市場。當年,美國市場創造了6.418億美元的收入,並有望在2034年之前保持強勁成長。即時交通系統和車聯網(V2O)的加速普及,正在加強車輛、基礎設施和邊緣運算分析之間的連結。這些進步有助於更快地回應道路事件,改善自適應訊號運行,並增強互聯安全服務。由此,低延遲平台和公私合作部署在道路網路和行動旅行專案中的投資不斷增加,所有這些都促進了雲端原生營運分析的更廣泛應用。
目錄
第1章:方法論
第2章:執行概要
第3章:行業洞察
- 產業生態系分析
- 供應商格局
- 利潤率分析
- 成本結構
- 每個階段的價值增加
- 影響價值鏈的因素
- 中斷
- 產業影響因素
- 成長促進因素
- 城市擁擠和人口成長
- 智慧城市及其投資的擴展
- 連網汽車和物聯網設備激增
- 公共交通數位化發展
- 企業對車隊和物流最佳化的需求
- 產業陷阱與挑戰
- 資料隱私和安全問題
- 高昂的整合和部署成本
- 市場機遇
- 自動駕駛和先進駕駛輔助系統(ADAS)的發展
- 電動車基礎設施和充電分析的擴展
- 永續交通和排放監測
- 多模式出行即服務 (MaaS) 的整合
- 成長促進因素
- 成長潛力分析
- 監管環境
- 波特的分析
- PESTEL 分析
- 技術與創新格局
- 目前技術
- 新興技術
- 專利分析
- 未來市場趨勢
- 主要市場趨勢和顛覆性因素
- 客戶採納與滿意度分析
- 各行業領域的採用率
- 使用者滿意度指標和淨推薦值 (NPS)
- 功能利用模式
- 流失率與留存率分析
- 客戶成功因素
- 數據品質與整合挑戰
- 資料完整性和準確性問題
- 即時數據延遲限制
- 多源資料整合複雜性
- 舊系統相容性
- 數據標準化障礙
- 感測器校準和維護要求
- 投資報酬率和商業價值量化
- 按應用分類的成本節約指標
- 營運效率提升
- 安全與風險降低效益
- 創收機會
- 總擁有成本分析
- 投資回收期基準
- 產業成熟度評估與實施基準
- 成熟度模型框架
- 各行業領域的能力成熟度
- 技術採納生命週期階段
- 實施時間表基準
- 資源需求與人員配置模式
- 組織準備度評估
- 使用案例開發與實施路線圖
- 用例優先權框架
- 從概念驗證到生產路徑
- 分階段實施策略
- 短期見效與長期舉措
- 利害關係人參與與變革管理
- 培訓與能力建構方案
- 真實個案研究及實施成果
- 車隊管理部署
- 智慧城市交通管理項目
- 公共交通最佳化計劃
- 共享出行平台實施方案
- 智慧停車系統推廣
- 經驗教訓與最佳實踐
- 整合與互通性格局
- API標準與協定
- 資料交換格式和規範
- 多廠商整合模式
- 雲端平台相容性
- 開源解決方案與專有解決方案
- 跨境資料共享機制
- 網路安全、資料隱私與合規架構
- 威脅情勢與攻擊途徑
- NIST網路安全框架應用
- 隱私設計實施
- 資料匿名化與去識別化
- 合規認證要求
- 事件回應與恢復協議
- 第三方風險管理
第4章:競爭格局
- 介紹
- 公司市佔率分析
- 北美洲
- 歐洲
- 亞太地區
- 拉丁美洲
- MEA
- 主要市場參與者的競爭分析
- 競爭定位矩陣
- 戰略展望矩陣
- 重要新聞和舉措
- 併購
- 合作夥伴關係與合作
- 新產品發布
- 擴張計劃和資金
第5章:市場估算與預測:依部署方式分類,2021-2034年
- 基於雲端的
- 現場
- 混合
第6章:市場估計與預測:依技術分類,2021-2034年
- 數據收集與遙測
- 資料管理與儲存
- 分析與智慧
- 可視化和用戶介面
- 連接與整合
第7章:市場估計與預測:依應用領域分類,2021-2034年
- 流量和網路最佳化
- 車隊及資產管理
- 公共交通和共享旅遊分析
- 安全、合規和事故管理
- 收入、定價和需求預測
- 永續性、排放和環境監測
第8章:市場估算與預測:依最終用途分類,2021-2034年
- 政府和城市規劃部門
- 大眾運輸機構
- 出行和共享交通運輸業者
- 物流和車隊企業
- 汽車原始設備製造商和一級技術供應商
- 研究、政策和學術機構
第9章:市場估計與預測:依地區分類,2021-2034年
- 北美洲
- 美國
- 加拿大
- 歐洲
- 德國
- 英國
- 法國
- 義大利
- 西班牙
- 北歐
- 荷蘭
- 俄羅斯
- 比荷盧經濟聯盟
- 亞太地區
- 中國
- 印度
- 日本
- 澳新銀行
- 新加坡
- 泰國
- 越南
- 韓國
- 拉丁美洲
- 巴西
- 墨西哥
- 阿根廷
- MEA
- 南非
- 沙烏地阿拉伯
- 阿拉伯聯合大公國
第10章:公司簡介
- 全球參與者
- Geotab
- INRIX
- Mapbox
- Omnitracs
- PTV Planung Transport Verkehr
- Samsara
- Siemens Mobility
- Teledyne FLIR / Acyclica
- Trimble Transportation
- Verizon Connect
- HERE Technologies
- Iteris
- Teralytics
- TomTom
- 區域冠軍
- Cubic Transportation Systems
- CVEDIA
- Econolite
- FLASH (Park Assist)
- Kapsch TrafficCom
- ParkMobile
- Powerfleet
- Remix (Via)
- SWARCO
- Swiftly
- Teletrac Navman
- 新興參與者和顛覆者
- ATOM Mobility
- Descartes Systems
- FourKites
- LVL Parking
- Moovit (Intel)
- Populus
- Ride Report
- StreetLight Data
The Global Mobility Data Analytics Platforms Market was valued at USD 2.16 billion in 2024 and is estimated to grow at a CAGR of 18.1% to reach USD 11.2 billion by 2034.
The market is accelerating as organizations focus on real-time multi-modal mobility intelligence, which supports continuous oversight of traffic, transit, freight, and micro-mobility systems. This capability strengthens day-to-day decision-making, enables adaptive signal adjustments, enhances response times during network disruptions, and elevates traveler information quality. Together, these advantages help reduce congestion, improve service reliability, support safer movement across networks, and boost overall operational performance. AI-driven forecasting paired with mobility digital twins is also reshaping long-term planning. These tools offer deeper visibility into emerging travel patterns, potential congestion points, and infrastructure readiness, allowing stakeholders to test scenarios, guide strategic investment, and address system risks in advance. With the rapid rise of connected vehicles, IoT endpoints, and advanced sensing technologies, data volumes and precision are increasing at a dramatic pace. As datasets become richer, mobility analytics deliver stronger real-time risk detection, support predictive maintenance activities, strengthen multimodal coordination, expand smart city capabilities, enrich user experience, and quicken the rollout of intelligent and autonomous mobility innovations.
| Market Scope | |
|---|---|
| Start Year | 2024 |
| Forecast Year | 2025-2034 |
| Start Value | $2.16 Billion |
| Forecast Value | $11.2 Billion |
| CAGR | 18.1% |
The cloud-based platforms generated USD 1.4 billion in 2024 and are predicted to grow at an 18.9% CAGR through 2034. Their momentum is driven by demand for scalable infrastructure, lower upfront investment, and immediate access to modern AI tools. These cloud environments also allow fast implementation and remote accessibility under software-as-a-service or platform-as-a-service models, reducing financial exposure. Adoption has been strong among organizations that do not have the resources to maintain on-site systems or high-performance computing environments.
The analytics and intelligence segment represented a 32% share in 2024 and is expected to grow at a CAGR of 21.2% from 2025 to 2034. Growth in this category is tied to the surge in connected vehicle technologies, telematics, and IoT-driven data creation. New real-time data pipelines and streaming architectures are enabling faster and more accurate data collection, supporting immediate operational insights across traffic oversight, fleet optimization, transit planning, predictive modeling, and urban mobility management.
United States Mobility Data Analytics Platforms Market accounted for 87% share in 2024. The U.S. market generated USD 641.8 million that year and is positioned for strong expansion through 2034. Accelerated adoption of real-time traffic systems and vehicle-to-everything communication is strengthening links between vehicles, infrastructure, and edge-based analytics. These advancements support quicker responses to roadway events, help refine adaptive signal operations, and reinforce connected safety services. The result is rising investment in low-latency platforms and collaborative public-private deployments across road networks and mobility programs, all of which encourage broader use of cloud-native operational analytics.
Key companies active in the Mobility Data Analytics Platforms Market include Teralytics, HERE Technologies, TomTom, Streetlight Data, Cubic Transportation Systems, Iteris, Siemens Mobility, PTV Planung Transport Verkehr, Moovit, and INRIX. Companies competing in the mobility data analytics platforms market are reinforcing their market position by expanding AI-driven analytics capabilities, strengthening cloud-native architectures, and integrating advanced modeling tools that support real-time and predictive insights. Many firms are focusing on partnerships with public agencies, technology providers, and automotive stakeholders to broaden data access and enhance platform interoperability. Investment in scalable APIs and flexible deployment models is helping vendors meet diverse customer needs while keeping operating costs low. Organizations are also prioritizing continuous updates in machine learning, digital twin simulation, and multimodal analytics to differentiate their offerings.
Table of Contents
Chapter 1 Methodology
- 1.1 Market scope and definition
- 1.2 Research design
- 1.2.1 Research approach
- 1.2.2 Data collection methods
- 1.3 Data mining sources
- 1.3.1 Global
- 1.3.2 Regional/Country
- 1.4 Base estimates and calculations
- 1.4.1 Base year calculation
- 1.4.2 Key trends for market estimation
- 1.5 Primary research and validation
- 1.5.1 Primary sources
- 1.6 Forecast
- 1.7 Research assumptions and limitations
Chapter 2 Executive Summary
- 2.1 Industry 360° synopsis, 2021 - 2034
- 2.2 Key market trends
- 2.2.1 Deployment
- 2.2.2 Technology
- 2.2.3 Application
- 2.2.4 End Use
- 2.2.5 Regional
- 2.3 TAM Analysis, 2026-2034
- 2.4 CXO perspectives: Strategic imperatives
- 2.4.1 Executive decision points
- 2.4.2 Critical success factors
- 2.5 Future outlook & strategic recommendations
Chapter 3 Industry Insights
- 3.1 Industry ecosystem analysis
- 3.1.1 Supplier landscape
- 3.1.2 Profit margin analysis
- 3.1.3 Cost structure
- 3.1.4 Value addition at each stage
- 3.1.5 Factor affecting the value chain
- 3.1.6 Disruptions
- 3.2 Industry impact forces
- 3.2.1 Growth drivers
- 3.2.1.1 Urban congestion and population growth
- 3.2.1.2 Expansion of smart city and its investments
- 3.2.1.3 Surge in connected vehicles and IoT devices
- 3.2.1.4 Growth of public transit digitization
- 3.2.1.5 Corporate demand for fleet and logistics optimization
- 3.2.2 Industry pitfalls and challenges
- 3.2.2.1 Data privacy and security concerns
- 3.2.2.2 High integration and deployment costs
- 3.2.3 Market opportunities
- 3.2.3.1 Growth of autonomous and advanced driver assistance systems (ADAS)
- 3.2.3.2 Expansion of EV infrastructure and charging analytics
- 3.2.3.3 Sustainable mobility and emissions monitoring
- 3.2.3.4 Integration of multimodal mobility-as-a-service (MaaS)
- 3.2.1 Growth drivers
- 3.3 Growth potential analysis
- 3.4 Regulatory landscape
- 3.4.1 North America
- 3.4.2 Europe
- 3.4.3 Asia Pacific
- 3.4.4 Latin America
- 3.4.5 Middle east and Africa
- 3.5 Porter's analysis
- 3.6 PESTEL analysis
- 3.7 Technology and Innovation landscape
- 3.7.1 Current technology
- 3.7.2 Emerging technology
- 3.8 Patent analysis
- 3.9 Future market trends
- 3.10 Major market trends and disruptions
- 3.11 Customer Adoption & Satisfaction Analytics
- 3.11.1 Adoption Rates by Industry Segment
- 3.11.2 User Satisfaction Metrics & NPS Scores
- 3.11.3 Feature Utilization Patterns
- 3.11.4 Churn Rates & Retention Analysis
- 3.11.5 Customer Success Factors
- 3.12 Data Quality & Integration Challenges
- 3.12.1 Data Completeness & Accuracy Issues
- 3.12.2 Real-Time Data Latency Constraints
- 3.12.3 Multi-Source Data Integration Complexity
- 3.12.4 Legacy System Compatibility
- 3.12.5 Data Standardization Barriers
- 3.12.6 Sensor Calibration & Maintenance Requirements
- 3.13 ROI & Business Value Quantification
- 3.13.1 Cost Savings Metrics by Application
- 3.13.2 Operational Efficiency Improvements
- 3.13.3 Safety & Risk Reduction Benefits
- 3.13.4 Revenue Generation Opportunities
- 3.13.5 Total Cost of Ownership Analysis
- 3.13.6 Payback Period Benchmarks
- 3.14 Industry Maturity Assessment & Implementation Benchmarks
- 3.14.1 Maturity Model Framework
- 3.14.2 Capability Maturity by Industry Segment
- 3.14.3 Technology Adoption Lifecycle Stage
- 3.14.4 Implementation Timeline Benchmarks
- 3.14.5 Resource Requirements & Staffing Models
- 3.14.6 Organizational Readiness Assessment
- 3.15 Use Case Development & Implementation Roadmaps
- 3.15.1 Use Case Prioritization Framework
- 3.15.2 Proof-of-Concept to Production Pathway
- 3.15.3 Phased Implementation Strategies
- 3.15.4 Quick Wins vs Long-Term Initiatives
- 3.15.5 Stakeholder Engagement & Change Management
- 3.15.6 Training & Capacity Building Programs
- 3.16 Real-World Case Studies & Implementation Outcomes
- 3.16.1 Fleet Management Deployments
- 3.16.2 Smart City Traffic Management Projects
- 3.16.3 Public Transit Optimization Initiatives
- 3.16.4 Shared Mobility Platform Implementations
- 3.16.5 Smart Parking System Rollouts
- 3.16.6 Lessons Learned & Best Practices
- 3.17 Integration & Interoperability Landscape
- 3.17.1 API Standards & Protocols
- 3.17.2 Data Exchange Formats & Specifications
- 3.17.3 Multi-Vendor Integration Patterns
- 3.17.4 Cloud Platform Compatibility
- 3.17.5 Open Source vs Proprietary Solutions
- 3.17.6 Cross-Border Data Sharing Mechanisms
- 3.18 Cybersecurity, Data Privacy & Compliance Architecture
- 3.18.1 Threat Landscape & Attack Vectors
- 3.18.2 NIST Cybersecurity Framework Application
- 3.18.3 Privacy-by-Design Implementation
- 3.18.4 Data Anonymization & De-Identification
- 3.18.5 Compliance Certification Requirements
- 3.18.6 Incident Response & Recovery Protocols
- 3.18.7 Third-Party Risk Management
Chapter 4 Competitive Landscape, 2024
- 4.1 Introduction
- 4.2 Company market share analysis
- 4.2.1 North America
- 4.2.2 Europe
- 4.2.3 Asia Pacific
- 4.2.4 LATAM
- 4.2.5 MEA
- 4.3 Competitive analysis of major market players
- 4.4 Competitive positioning matrix
- 4.5 Strategic outlook matrix
- 4.6 Key news and initiatives
- 4.6.1 Mergers & acquisitions
- 4.6.2 Partnerships & collaborations
- 4.6.3 New Product Launches
- 4.6.4 Expansion Plans and funding
Chapter 5 Market Estimates & Forecast, By Deployment, 2021 - 2034 ($Mn)
- 5.1 Key trends
- 5.2 Cloud-based
- 5.3 On-premises
- 5.4 Hybrid
Chapter 6 Market Estimates & Forecast, By Technology, 2021 - 2034 ($Mn)
- 6.1 Key trends
- 6.2 Data collection & telemetry
- 6.3 Data management & storage
- 6.4 Analytics & intelligence
- 6.5 Visualization & user interface
- 6.6 Connectivity & integration
Chapter 7 Market Estimates & Forecast, By Application, 2021 - 2034 ($Mn)
- 7.1 Key trends
- 7.2 Traffic & network optimization
- 7.3 Fleet & asset management
- 7.4 Public transit & shared mobility analytics
- 7.5 Safety, compliance & incident management
- 7.6 Revenue, pricing & demand forecasting
- 7.7 Sustainability, emissions & environmental monitoring
Chapter 8 Market Estimates & Forecast, By End Use, 2021 - 2034 ($Mn)
- 8.1 Key trends
- 8.2 Government & urban planning authorities
- 8.3 Public transportation agencies
- 8.4 Mobility & shared transport operators
- 8.5 Logistics & fleet-based enterprises
- 8.6 Automotive OEMs & tier-1 tech providers
- 8.7 Research, policy & academic institutions
Chapter 9 Market Estimates & Forecast, By Region, 2021 - 2034 ($Mn)
- 9.1 Key trends
- 9.2 North America
- 9.2.1 US
- 9.2.2 Canada
- 9.3 Europe
- 9.3.1 Germany
- 9.3.2 UK
- 9.3.3 France
- 9.3.4 Italy
- 9.3.5 Spain
- 9.3.6 Nordics
- 9.3.7 Netherlands
- 9.3.8 Russia
- 9.3.9 BENELUX
- 9.4 Asia Pacific
- 9.4.1 China
- 9.4.2 India
- 9.4.3 Japan
- 9.4.4 ANZ
- 9.4.5 Singapore
- 9.4.6 Thailand
- 9.4.7 Vietnam
- 9.4.8 South Korea
- 9.5 Latin America
- 9.5.1 Brazil
- 9.5.2 Mexico
- 9.5.3 Argentina
- 9.6 MEA
- 9.6.1 South Africa
- 9.6.2 Saudi Arabia
- 9.6.3 UAE
Chapter 10 Company Profiles
- 10.1 Global Players
- 10.1.1 Geotab
- 10.1.2 INRIX
- 10.1.3 Mapbox
- 10.1.4 Omnitracs
- 10.1.5 PTV Planung Transport Verkehr
- 10.1.6 Samsara
- 10.1.7 Siemens Mobility
- 10.1.8 Teledyne FLIR / Acyclica
- 10.1.9 Trimble Transportation
- 10.1.10 Verizon Connect
- 10.1.11 HERE Technologies
- 10.1.12 Iteris
- 10.1.13 Teralytics
- 10.1.14 TomTom
- 10.2 Regional Champions
- 10.2.1 Cubic Transportation Systems
- 10.2.2 CVEDIA
- 10.2.3 Econolite
- 10.2.4 FLASH (Park Assist)
- 10.2.5 Kapsch TrafficCom
- 10.2.6 ParkMobile
- 10.2.7 Powerfleet
- 10.2.8 Remix (Via)
- 10.2.9 SWARCO
- 10.2.10 Swiftly
- 10.2.11 Teletrac Navman
- 10.3 Emerging Players & Disruptors
- 10.3.1 ATOM Mobility
- 10.3.2 Descartes Systems
- 10.3.3 FourKites
- 10.3.4 LVL Parking
- 10.3.5 Moovit (Intel)
- 10.3.6 Populus
- 10.3.7 Ride Report
- 10.3.8 StreetLight Data
 行動數據分析市場預測至2034年-按服務類型、部署模式、應用、最終用戶和地區分類的全球分析
 2026年全球微出行資料分析市場報告
 資料分析市場:2026-2032年全球市場預測(依產品類型、定價模式、產業及公司規模分類)
 全球數據分析市場規模、佔有率、趨勢和成長分析報告(2026-2034年)2026年全球危險預警族群數據市場報告
 農業分析市場:按組件、應用和地區分類
 2026-2030年全球數據分析市場2026年全球數據分析市場報告2026年全球決策管理市場報告
 資料分析市場分析及預測(至2035年):依類型、產品類型、服務、技術、組件、應用、部署類型、最終使用者及功能分類