


 |
市場調查報告書
商品編碼
1885857
飲料玻璃回收市場機會、成長促進因素、產業趨勢分析及預測(2025-2034年)Beverage Glass Recycling Market Opportunity, Growth Drivers, Industry Trend Analysis, and Forecast 2025 - 2034 |
||||||
2024 年全球飲料玻璃回收市場價值為 18 億美元,預計到 2034 年將以 6.7% 的複合年成長率成長至 35 億美元。
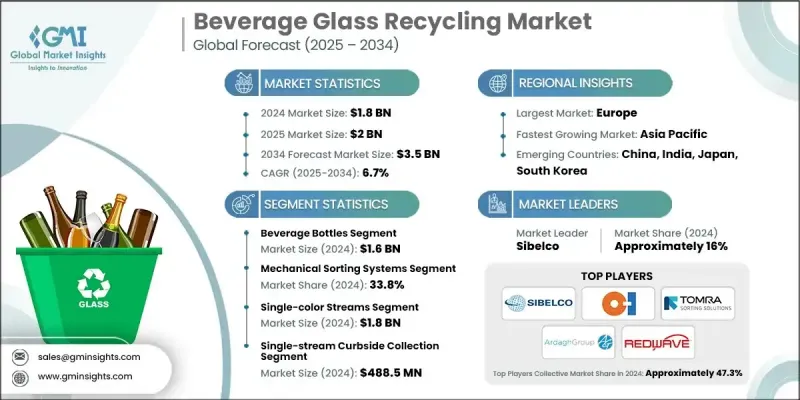
飲料玻璃回收已成為循環經濟框架的關鍵組成部分,它透過機械篩選、光學分選和先進的清洗技術,將消費後的酒精和非酒精飲料瓶罐轉化為高品質的碎玻璃。這種精煉後的碎玻璃保持了原生玻璃的性能特徵,因此在製造業中得到廣泛應用。歐洲憑藉其健全的監管體系、高回收率和確保原料品質穩定的完善系統,仍然是領先的地區。北美地區儘管回收模式各異,但仍維持穩健成長,新的政策發展不斷提升回收效率。同時,亞太地區正受惠於人口密度、主要品牌需求的成長以及政府支持的永續發展措施而快速發展。與可追溯性和數位化驗證系統相關的監管進步正在透過提高透明度和激勵回收商提升資料品質並確保可靠的再生材料認證來重塑市場結構。支持性的資金機制也加強了回收企業與玻璃製造商之間的長期供應合約。
| 市場範圍 | |
|---|---|
| 起始年份 | 2024 |
| 預測年份 | 2025-2034 |
| 起始值 | 18億美元 |
| 預測值 | 35億美元 |
| 複合年成長率 | 6.7% |
2024年,機械分選系統市場規模達6.225億美元,佔市佔率的33.8%。這些系統之所以能保持領先地位,是因為它們性能可靠、處理量穩定、分離精度高。其耐用的設計、自動化處理能力和高效的篩選流程,使其特別適用於大規模混合物料處理作業,在這些作業中,穩定的性能至關重要。
2024年,單色玻璃流市場規模達18億美元,佔96%的市場佔有率,預計2025年至2034年複合年成長率將達到6.6%。由於其卓越的品質和易於加工的特性,單色玻璃流在顏色分選領域佔據主導地位。可控的顏色分選能夠提高熔體效率、減少污染並提升再生玻璃的價值,使其成為高階製造程序和閉迴路回收應用的理想選擇,尤其適用於那些對顏色均勻性和純度要求較高的應用。
預計2025年至2034年,北美飲料玻璃回收市場將以6.3%的複合年成長率成長。企業對永續包裝的日益重視以及循環經濟策略的廣泛應用,持續推動飲料、食品分銷和高階包裝領域對高品質再生玻璃的需求。此外,對環境問題的日益關注以及向更先進的回收基礎設施的轉型,也促進了從原生玻璃生產到再生玻璃替代品的長期轉變。
全球飲料玻璃回收市場的主要企業包括 Sibelco、OI(歐文斯-伊利諾伊公司)、TOMRA Sorting Solutions、Ardagh Group、REDWAVE、Sesotec GmbH、Reiling Group、SCHOTT AG、Visy Glass、Vetropack Group、Gallo Glass Company、Momentum Recycling、Mid America Recycling 和 Ripple Glass。這些企業依靠多種策略來增強競爭力並擴大市場佔有率。許多企業正在投資尖端的光學分選系統、即時監控工具和自動化污染檢測技術,以提供更高純度的碎玻璃。與飲料品牌和容器製造商建立策略合作夥伴關係有助於確保長期供應合約和穩定的收入來源。此外,各企業也正在採用數位追蹤和資料整合技術,以支援再生材料成分驗證和法規遵循。
目錄
第1章:方法論與範圍
第2章:執行概要
第3章:行業洞察
- 產業生態系分析
- 供應商格局
- 利潤率
- 每個階段的價值增加
- 影響價值鏈的因素
- 中斷
- 產業影響因素
- 促進要素
- 陷阱與挑戰
- 機會
- 成長潛力分析
- 監管環境
- 北美洲
- 歐洲
- 亞太地區
- 拉丁美洲
- 中東和非洲
- 波特的分析
- PESTEL 分析
- 價格趨勢
- 按地區
- 按容器類型
- 未來市場趨勢
- 技術與創新格局
- 當前技術趨勢
- 新興技術
- 專利格局
- 貿易統計(HS編碼)(註:僅提供重點國家的貿易統計資料)
- 主要進口國
- 主要出口國
- 永續性和環境方面
- 永續實踐
- 減少廢棄物策略
- 生產中的能源效率
- 環保舉措
- 碳足跡考量
第4章:競爭格局
- 介紹
- 公司市佔率分析
- 按地區
- 北美洲
- 歐洲
- 亞太地區
- 拉丁美洲
- MEA
- 按地區
- 公司矩陣分析
- 主要市場參與者的競爭分析
- 競爭定位矩陣
- 關鍵進展
- 併購
- 合作夥伴關係與合作
- 新產品發布
- 擴張計劃
第5章:市場估算與預測:依貨櫃類型分類,2021-2034年
- 主要趨勢
- 飲料瓶
- 啤酒瓶(棕色、綠色、透明)
- 葡萄酒瓶(波爾多、勃根地、萊茵風格)
- 烈酒瓶
- 軟性飲料和水瓶
- 飲料罐
- 果汁和冰沙罐
- 特種飲料容器
- 梅森罐式飲料
- 廣口容器應用
第6章:市場估算與預測:依加工技術類型分類,2021-2034年
- 主要趨勢
- 機械分類系統
- 光學分選技術
- 磁分離和渦流分離
- 基於人工智慧的機器人分類
- 先進的清潔和選礦系統
第7章:市場估計與預測:依玻璃顏色分類,2021-2034年
- 主要趨勢
- 單色流
- 燧石/透明玻璃(純度95-100%)
- 琥珀色玻璃(純度90-100%)
- 綠色玻璃(純度70-100%)
- 特殊顏色(藍色、黑色、其他)
- 混合顏色的溪流
- 雙色混合
- 三色混合(3-mix)
第8章:市場估算與預測:依收集系統類型分類,2021-2034年
- 主要趨勢
- 單流路邊收集
- 雙流路邊收集
- 存款回饋系統(DRS)
- 投放中心和便利項目
- 商業收款系統
第9章:市場估計與預測:依地區分類,2021-2034年
- 主要趨勢
- 北美洲
- 美國
- 加拿大
- 歐洲
- 德國
- 英國
- 法國
- 西班牙
- 義大利
- 歐洲其他地區
- 亞太地區
- 中國
- 印度
- 日本
- 澳洲
- 韓國
- 亞太其他地區
- 拉丁美洲
- 巴西
- 墨西哥
- 阿根廷
- 拉丁美洲其他地區
- 中東和非洲
- 沙烏地阿拉伯
- 南非
- 阿拉伯聯合大公國
- 中東和非洲其他地區
第10章:公司簡介
- Sibelco
- OI (Owens-Illinois)
- TOMRA Sorting Solutions
- Ardagh Group
- REDWAVE
- Sesotec GmbH
- Reiling Group
- SCHOTT AG
- Visy Glass
- Vetropack Group
- Gallo Glass Company
- Momentum Recycling
- Mid America Recycling
- Ripple Glass
The Global Beverage Glass Recycling Market was valued at USD 1.8 billion in 2024 and is estimated to grow at a CAGR of 6.7% to reach USD 3.5 billion by 2034.
Beverage glass recycling has become a key component of circular economy frameworks, as it transforms post-consumer bottles and jars from alcoholic and non-alcoholic beverages into high-quality cullet through mechanical screening, optical sorting, and advanced cleaning technologies. This refined cullet maintains the performance characteristics of virgin glass, supporting its widespread use in manufacturing. Europe remains the leading region due to strong regulatory structures, high recovery rates, and established systems that ensure consistent input quality. North America shows solid growth despite variations in collection models, and new policy developments continue to enhance recovery efficiency. Meanwhile, the Asia Pacific region is expanding rapidly thanks to population density, rising demand from major brands, and government-backed sustainability measures. Regulatory advancements related to traceability and digital verification systems are shaping market structures by promoting transparency and incentivizing recyclers to improve data quality and ensure reliable recycled-content certification. Supportive funding mechanisms also strengthen long-term supply contracts between recycling operations and glass manufacturers.
| Market Scope | |
|---|---|
| Start Year | 2024 |
| Forecast Year | 2025-2034 |
| Start Value | $1.8 Billion |
| Forecast Value | $3.5 Billion |
| CAGR | 6.7% |
The mechanical sorting systems segment generated USD 622.5 million in 2024 and accounted for a 33.8% share. These systems remain dominant because they offer reliable performance, consistent throughput, and high separation accuracy. Their durable design, automated handling capabilities, and efficient screening processes make them particularly effective for large-scale operations managing high volumes of mixed materials, where consistent performance is essential.
The single-color streams segment accounted for USD 1.8 billion in 2024 and held a substantial share of 96%, with an expected CAGR of 6.6% from 2025 to 2034. These streams lead the color-separation segment due to the superior quality and processing ease they provide. Controlled color sorting improves melt efficiency, reduces contamination, and enhances the value of recycled glass, making this method ideal for premium manufacturing processes and closed-loop recycling applications that depend on uniform color and high purity.
North America Beverage Glass Recycling Market is projected to grow at a CAGR of 6.3% from 2025 to 2034. Increasing corporate commitments to sustainable packaging and broader adoption of circular strategies continue to push demand for high-quality recycled glass in beverages, food distribution, and premium packaging. Environmental concerns and the transition toward more advanced recycling infrastructure also support the long-term shift from virgin glass production to recycled alternatives.
Key companies active in the Global Beverage Glass Recycling Market include Sibelco, O-I (Owens-Illinois), TOMRA Sorting Solutions, Ardagh Group, REDWAVE, Sesotec GmbH, Reiling Group, SCHOTT AG, Visy Glass, Vetropack Group, Gallo Glass Company, Momentum Recycling, Mid America Recycling, and Ripple Glass. Companies in the Beverage Glass Recycling Market rely on several strategies to reinforce their competitiveness and expand market presence. Many are investing in cutting-edge optical sorting systems, real-time monitoring tools, and automated contamination detection to deliver higher-purity cullet. Strategic partnerships with beverage brands and container manufacturers help secure long-term supply contracts and stable revenue streams. Firms are also adopting digital tracking and data-integration technologies that support recycled-content verification and regulatory compliance.
Table of Contents
Chapter 1 Methodology & Scope
- 1.1 Market scope and definition
- 1.2 Research design
- 1.2.1 Research approach
- 1.2.2 Data collection methods
- 1.3 Data mining sources
- 1.3.1 Global
- 1.3.2 Regional/Country
- 1.4 Base estimates and calculations
- 1.4.1 Base year calculation
- 1.4.2 Key trends for market estimation
- 1.5 Primary research and validation
- 1.5.1 Primary sources
- 1.6 Forecast model
- 1.7 Research assumptions and limitations
Chapter 2 Executive Summary
- 2.1 Industry 360° synopsis
- 2.2 Key market trends
- 2.2.1 Container type
- 2.2.2 Processing technology type
- 2.2.3 Glass color
- 2.2.4 Collection system type
- 2.2.5 Regional trends
- 2.3 TAM Analysis, 2025-2034
- 2.4 CXO perspectives: Strategic imperatives
- 2.4.1 Executive decision points
- 2.4.2 Critical success factors
- 2.5 Future Outlook and Strategic Recommendations
Chapter 3 Industry Insights
- 3.1 Industry ecosystem analysis
- 3.1.1 Supplier landscape
- 3.1.2 Profit margin
- 3.1.3 Value addition at each stage
- 3.1.4 Factor affecting the value chain
- 3.1.5 Disruptions
- 3.2 Industry impact forces
- 3.2.1 Drivers
- 3.2.2 Pitfalls & Challenges
- 3.2.3 Opportunities
- 3.3 Growth potential analysis
- 3.4 Regulatory landscape
- 3.4.1 North America
- 3.4.2 Europe
- 3.4.3 Asia Pacific
- 3.4.4 Latin America
- 3.4.5 Middle East & Africa
- 3.5 Porter's analysis
- 3.6 PESTEL analysis
- 3.7 Price trends
- 3.7.1 By region
- 3.7.2 By container type
- 3.8 Future market trends
- 3.9 Technology and Innovation landscape
- 3.9.1 Current technological trends
- 3.9.2 Emerging technologies
- 3.10 Patent Landscape
- 3.11 Trade statistics (HS code) ( Note: the trade statistics will be provided for key countries only)
- 3.11.1 Major importing countries
- 3.11.2 Major exporting countries
- 3.12 Sustainability and environmental aspects
- 3.12.1 Sustainable practices
- 3.12.2 Waste reduction strategies
- 3.12.3 Energy efficiency in production
- 3.12.4 Eco-friendly initiatives
- 3.13 Carbon footprint consideration
Chapter 4 Competitive Landscape, 2024
- 4.1 Introduction
- 4.2 Company market share analysis
- 4.2.1 By region
- 4.2.1.1 North America
- 4.2.1.2 Europe
- 4.2.1.3 Asia Pacific
- 4.2.1.4 LATAM
- 4.2.1.5 MEA
- 4.2.1 By region
- 4.3 Company matrix analysis
- 4.4 Competitive analysis of major market players
- 4.5 Competitive positioning matrix
- 4.6 Key developments
- 4.6.1 Mergers & acquisitions
- 4.6.2 Partnerships & collaborations
- 4.6.3 New Product Launches
- 4.6.4 Expansion Plans
Chapter 5 Market Estimates and Forecast, By Container Type, 2021-2034 (USD Million & Kilo Tons)
- 5.1 Key trends
- 5.2 Beverage bottles
- 5.2.1 Beer bottles (brown, green, clear)
- 5.2.2 Wine bottles (bordeaux, burgundy, rhine styles)
- 5.2.3 Spirit & liquor bottles
- 5.2.4 Soft drink & water bottles
- 5.3 Beverage jars
- 5.3.1 Juice & smoothie jars
- 5.3.2 Specialty beverage containers
- 5.3.3 Mason jar style beverages
- 5.3.4 Wide-mouth container applications
Chapter 6 Market Estimates and Forecast, By Processing Technology Type, 2021-2034 (USD Million & Kilo Tons)
- 6.1 Key trends
- 6.2 Mechanical sorting systems
- 6.3 Optical sorting technology
- 6.4 Magnetic & eddy current separation
- 6.5 AI-based robotic sorting
- 6.6 Advanced cleaning & beneficiation systems
Chapter 7 Market Estimates and Forecast, By Glass Color, 2021-2034 (USD Million & Kilo Tons)
- 7.1 Key trends
- 7.2 Single-color streams
- 7.2.1 Flint/clear glass (95-100% purity)
- 7.2.2 Amber glass (90-100% purity)
- 7.2.3 Green glass (70-100% purity)
- 7.2.4 Specialty colors (blue, black, other)
- 7.3 Mixed-color streams
- 7.3.1 Two-color mixes
- 7.3.2 Three-color mixed (3-mix)
Chapter 8 Market Estimates and Forecast, By Collection System Type, 2021-2034 (USD Million & Kilo Tons)
- 8.1 Key trends
- 8.2 Single-stream curbside collection
- 8.3 Dual-stream curbside collection
- 8.4 Deposit return systems (DRS)
- 8.5 Drop-off centers & convenience programs
- 8.6 Commercial collection systems
Chapter 9 Market Estimates and Forecast, By Region, 2021-2034 (USD Million & Kilo Tons)
- 9.1 Key trends
- 9.2 North America
- 9.2.1 U.S.
- 9.2.2 Canada
- 9.3 Europe
- 9.3.1 Germany
- 9.3.2 UK
- 9.3.3 France
- 9.3.4 Spain
- 9.3.5 Italy
- 9.3.6 Rest of Europe
- 9.4 Asia Pacific
- 9.4.1 China
- 9.4.2 India
- 9.4.3 Japan
- 9.4.4 Australia
- 9.4.5 South Korea
- 9.4.6 Rest of Asia Pacific
- 9.5 Latin America
- 9.5.1 Brazil
- 9.5.2 Mexico
- 9.5.3 Argentina
- 9.5.4 Rest of Latin America
- 9.6 Middle East and Africa
- 9.6.1 Saudi Arabia
- 9.6.2 South Africa
- 9.6.3 UAE
- 9.6.4 Rest of Middle East and Africa
Chapter 10 Company Profiles
- 10.1 Sibelco
- 10.2 O-I (Owens-Illinois)
- 10.3 TOMRA Sorting Solutions
- 10.4 Ardagh Group
- 10.5 REDWAVE
- 10.6 Sesotec GmbH
- 10.7 Reiling Group
- 10.8 SCHOTT AG
- 10.9 Visy Glass
- 10.10 Vetropack Group
- 10.11 Gallo Glass Company
- 10.12 Momentum Recycling
- 10.13 Mid America Recycling
- 10.14 Ripple Glass
 玻璃檢測與分析服務市場:依服務類型、材料類型、應用與最終用途產業分類-2026-2032年全球預測硼矽酸玻璃市場:依產品類型、應用、通路和最終用戶分類,全球預測,2026-2032年
 管狀天窗市場規模、佔有率和成長分析:按產品類型、材質類型、光源、應用、最終用戶、分銷管道和地區分類-2026-2033年產業預測
 低輻射半導體製造市場分析及預測(至2035年):按類型、產品、服務、技術、組件、應用、材料類型、製程及最終用戶分類低輻射智慧玻璃市場分析及預測(至2035年):按類型、產品類型、技術、應用、材質、功能、安裝類型、最終用戶和組件分類
 2026年全球家用電器玻璃市場報告2026年全球有色玻璃市場報告2026年全球玻璃及玻璃製品市場報告2026年全球蓋玻片市場報告2026年全球退火玻璃市場報告