


 |
市場調查報告書
商品編碼
1885811
綠色氫氣生產化學品市場機會、成長促進因素、產業趨勢分析及預測(2025-2034年)Green Hydrogen Production Chemicals Market Opportunity, Growth Drivers, Industry Trend Analysis, and Forecast 2025 - 2034 |
||||||
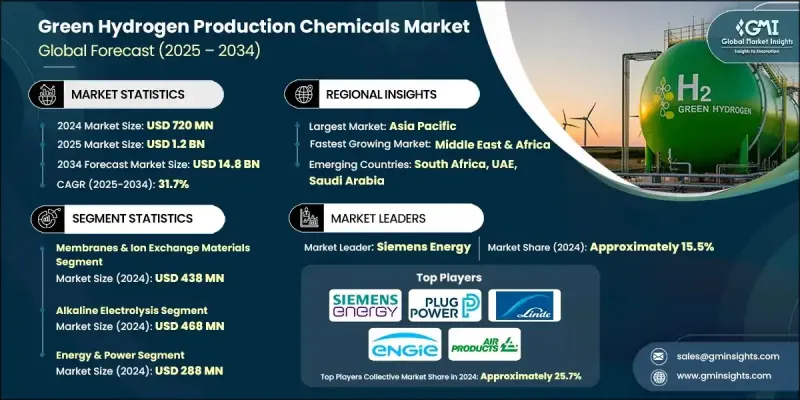
2024 年綠色氫氣生產化學品市場價值為 7.2 億美元,預計到 2034 年將以 31.7% 的複合年成長率成長至 148 億美元。
隨著各國政府加強脫碳力度,並推出直接支持綠色氫氣生產所需化學原料的補貼機制,產業發展動能持續加速。這些措施改善了專案融資,增強了投資者信心,並激勵各行業轉型為低碳化工製程。風能和太陽能成本的快速下降也提振了市場前景,使生產商能夠使用更經濟實惠的再生電力來營運電解槽,而再生電力仍然是主要的成本促進因素。隨著再生能源價格的持續下降,大規模生產綠色氫氣及其衍生化學品變得越來越可行,從而提升了市場的商業吸引力。同時,更低的資本成本和電解槽技術的效率提升降低了整體生產成本。這種轉變正推動製造商擴大生產規模,開發新型先進的製程化學品,並採用高性能催化劑和薄膜技術,從而增強整個供應鏈的價值創造。
| 市場範圍 | |
|---|---|
| 起始年份 | 2024 |
| 預測年份 | 2025-2034 |
| 起始值 | 7.2億美元 |
| 預測值 | 148億美元 |
| 複合年成長率 | 31.7% |
2024年,膜和離子交換材料市場規模為4.38億美元,預計2025年至2034年將以41.2%的複合年成長率成長。隨著生產商致力於提升電解槽系統的運作性能,這些材料正被更廣泛地整合到電解槽系統中。為了最大限度地提高轉化效率並減少能量損失,更高等級的催化劑和更純淨的電解液正被廣泛應用;同時,耐用膜對於保障PEM和AEM裝置的可靠性至關重要。它們在確保系統連續運作和穩定性能方面發揮的作用,正在推動該領域的長期需求。
2024年,鹼性電解市場規模達4.68億美元,預計2025年至2034年將以28.4%的複合年成長率成長。隨著鹼性電解和質子交換膜(PEM)電解技術在商業應用中的普及,市場需求不斷成長。鹼性電解系統需要性能優異的催化劑和穩定的電解液來維持穩定的產出,而PEM技術則依賴高效膜、離子交換材料和先進催化劑。這些技術在工業中心和氫能設施中日益廣泛的應用,也使得對可靠、高品質的化學原料的需求不斷成長,這些原料能夠確保系統的性能和較長的使用壽命。
2024年,北美綠色氫氣生產化學品市場規模預估為5,040萬美元。再生能源的普及和聯邦政府的激勵政策正在推動該地區氫氣生產活動和化學品消費的成長。電解槽開發、清潔能源基礎設施和氫氣運輸網路投資的增加,進一步推動了催化劑、薄膜、淨化化學品和水處理劑在新專案中的應用。該領域的主要參與者包括ENGIE、西門子能源股份公司、林德集團、Plug Power公司、空氣產品公司等。
全球綠色氫氣生產化學品市場的領導企業正透過多項重點策略強化其競爭地位。許多企業大力投資研發,致力於設計更有效率的催化劑、薄膜和電解質,以提升電解槽性能並降低整體生產成本。與再生能源開發商、電解槽製造商和工業終端用戶建立策略合作夥伴關係日益普遍,從而確保長期供應協議和一體化專案開發。企業也在擴大產能以滿足不斷成長的需求,並實現生產本地化以降低物流成本並獲得區域性激勵措施。此外,企業也致力於永續發展,並拓展產品組合,涵蓋先進材料、特種化學原料和下一代氫能技術,這些舉措進一步鞏固了其市場地位。
目錄
第1章:方法論
- 市場範圍和定義
- 研究設計
- 研究方法
- 資料收集方法
- 資料探勘來源
- 全球的
- 地區/國家
- 基準估算和計算
- 基準年計算
- 市場估算的關鍵趨勢
- 初步研究和驗證
- 原始資料
- 預測模型
- 研究假設和局限性
第2章:執行概要
第3章:行業洞察
- 產業生態系分析
- 供應商格局
- 利潤率
- 每個階段的價值增加
- 影響價值鏈的因素
- 中斷
- 產業影響因素
- 成長促進因素
- 產業陷阱與挑戰
- 市場機遇
- 成長潛力分析
- 監管環境
- 北美洲
- 歐洲
- 亞太地區
- 拉丁美洲
- 中東和非洲
- 波特的分析
- PESTEL 分析
- 價格趨勢
- 按地區
- 依產品
- 未來市場趨勢
- 技術與創新格局
- 當前技術趨勢
- 新興技術
- 專利格局
- 貿易統計(註:僅提供重點國家的貿易統計)
- 主要進口國
- 主要出口國
- 永續性和環境方面
- 永續實踐
- 減少廢棄物策略
- 生產中的能源效率
- 環保舉措
- 碳足跡考量
第4章:競爭格局
- 介紹
- 公司市佔率分析
- 按地區
- 北美洲
- 歐洲
- 亞太地區
- 拉丁美洲
- MEA
- 按地區
- 公司矩陣分析
- 主要市場參與者的競爭分析
- 競爭定位矩陣
- 關鍵進展
- 併購
- 合作夥伴關係與合作
- 新產品發布
- 擴張計劃
第5章:市場估算與預測:依化學品類型分類,2021-2034年
- 主要趨勢
- 催化劑
- 電解催化劑(PEM、鹼性、固體氧化物)
- 光催化劑
- 電解質
- 酸性電解質
- 鹼性電解質
- 膜和離子交換材料
- 質子交換膜
- 陰離子交換膜
- 水處理化學品
- 去離子劑
- 防垢劑
- 腐蝕抑制劑
- 氣體淨化化學品
- 除氧劑
- 吸濕劑
第6章:市場估算與預測:依生產技術分類,2021-2034年
- 主要趨勢
- 鹼性電解
- 質子交換膜(PEM)電解
- 固態氧化物電解
- 光電化學水分解
- 熱化學過程
第7章:市場估算與預測:依最終用途產業分類,2021-2034年
- 主要趨勢
- 能源與電力
- 運輸
- 工業加工
- 化學製造
- 電子
第8章:市場估算與預測:依地區分類,2021-2034年
- 主要趨勢
- 北美洲
- 美國
- 加拿大
- 歐洲
- 德國
- 英國
- 法國
- 義大利
- 西班牙
- 歐洲其他地區
- 亞太地區
- 中國
- 印度
- 日本
- 澳洲
- 韓國
- 亞太其他地區
- 拉丁美洲
- 巴西
- 墨西哥
- 阿根廷
- 拉丁美洲其他地區
- 中東和非洲
- 沙烏地阿拉伯
- 南非
- 阿拉伯聯合大公國
- 中東和非洲其他地區
第9章:公司簡介
- Air Liquide SA
- Air Products and Chemicals, Inc.
- Linde plc
- Siemens Energy AG
- ENGIE
- Plug Power Inc.
- Bloom Energy Corporation
- Nel Hydrogen
- Cummins Inc.
- McPhy Energy SA
- thyssenkrupp AG
- Ballard Power Systems Inc.
- Reliance Industries Ltd.
- Adani Green Energy Ltd.
- Sinopec
The Green Hydrogen Production Chemicals Market was valued at USD 720 million in 2024 and is estimated to grow at a CAGR of 31.7% to reach USD 14.8 billion by 2034.
Industry momentum continues to accelerate as governments intensify decarbonization mandates and roll out subsidy frameworks that directly support chemical inputs used in green hydrogen production. These measures have improved project financing, increased investor assurance, and motivated industries to transition toward low-carbon chemical processes. Rapid declines in the cost of wind and solar power have also strengthened the market outlook, enabling producers to operate electrolysers with more affordable renewable electricity, which remains the primary cost driver. As renewable pricing continues to fall, large-scale green hydrogen and derivative chemical production has become increasingly viable, expanding the market's commercial attractiveness. Meanwhile, lower capital costs and improved efficiencies in electrolyser technology have reduced overall production expenses. This shift is pushing manufacturers to scale up, develop new and advanced process chemicals, and adopt high-performance catalysts and membranes, strengthening value creation across the supply chain.
| Market Scope | |
|---|---|
| Start Year | 2024 |
| Forecast Year | 2025-2034 |
| Start Value | $720 Million |
| Forecast Value | $14.8 Billion |
| CAGR | 31.7% |
The membranes and ion-exchange materials segment was valued at USD 438 million in 2024 and is forecast to grow at a CAGR of 41.2% from 2025 to 2034. These materials are being integrated more widely into electrolyser systems as producers aim to enhance operational performance. Higher-grade catalysts and purer electrolytes are being deployed to maximize conversion efficiency and reduce energy losses, while durable membranes are becoming essential to support the reliability of PEM and AEM units. Their role in enabling continuous operation and stable system performance is driving long-term demand in this segment.
The alkaline electrolysis segment reached USD 468 million in 2024 and is expected to grow at a CAGR of 28.4% from 2025 to 2034. Demand is rising as alkaline and PEM electrolysis technologies gain traction in commercial settings. Alkaline systems require robust catalysts and stable electrolytes to maintain steady output, while PEM technologies depend on high-efficiency membranes, ion-exchange materials, and advanced catalysts. Their growing deployment across industrial hubs and hydrogen-driven facilities is increasing the need for reliable, high-quality chemical inputs that support performance and long operating lifespans.
North America Green Hydrogen Production Chemicals Market was valued at USD 50.4 million in 2024. Expanding renewable energy adoption and federal incentive programs are boosting hydrogen manufacturing activities and chemical consumption across the region. Rising investments in electrolyser development, clean-energy infrastructures, and hydrogen transport networks are further increasing the use of catalysts, membranes, purification chemicals, and water-treatment agents across new projects. Key companies active in this space include ENGIE, Siemens Energy AG, Linde plc, Plug Power Inc., Air Products and Chemicals, Inc., and other participants.
Leading companies in the Global Green Hydrogen Production Chemicals Market are strengthening their competitive position through several focused strategies. Many are investing heavily in R&D to design higher-efficiency catalysts, membranes, and electrolytes that enhance electrolyser performance and reduce overall production costs. Strategic partnerships with renewable energy developers, electrolyser manufacturers, and industrial end users are increasingly common, ensuring long-term supply agreements and integrated project development. Companies are also expanding manufacturing capacity to meet rising demand and are localizing production to reduce logistics costs and qualify for regional incentives. Sustainability commitments and portfolio diversification into advanced materials, specialized chemical inputs, and next-generation hydrogen technologies are further reinforcing their market foothold.
Table of Contents
Chapter 1 Methodology
- 1.1 Market scope and definition
- 1.2 Research design
- 1.2.1 Research approach
- 1.2.2 Data collection methods
- 1.3 Data mining sources
- 1.3.1 Global
- 1.3.2 Regional/Country
- 1.4 Base estimates and calculations
- 1.4.1 Base year calculation
- 1.4.2 Key trends for market estimation
- 1.5 Primary research and validation
- 1.5.1 Primary sources
- 1.6 Forecast model
- 1.7 Research assumptions and limitations
Chapter 2 Executive Summary
- 2.1 Industry 360° synopsis
- 2.2 Key market trends
- 2.2.1 Regional
- 2.2.2 Chemical Type
- 2.2.3 Production Technology
- 2.2.4 End Use Industry
- 2.3 TAM Analysis, 2025-2034
- 2.4 CXO perspectives: Strategic imperatives
- 2.4.1 Executive decision points
- 2.4.2 Critical success factors
- 2.5 Future Outlook and Strategic Recommendations
Chapter 3 Industry Insights
- 3.1 Industry ecosystem analysis
- 3.1.1 Supplier Landscape
- 3.1.2 Profit Margin
- 3.1.3 Value addition at each stage
- 3.1.4 Factor affecting the value chain
- 3.1.5 Disruptions
- 3.2 Industry impact forces
- 3.2.1 Growth drivers
- 3.2.2 Industry pitfalls and challenges
- 3.2.3 Market opportunities
- 3.3 Growth potential analysis
- 3.4 Regulatory landscape
- 3.4.1 North America
- 3.4.2 Europe
- 3.4.3 Asia Pacific
- 3.4.4 Latin America
- 3.4.5 Middle East & Africa
- 3.5 Porter's analysis
- 3.6 PESTEL analysis
- 3.7 Price trends
- 3.7.1 By region
- 3.7.2 By product
- 3.8 Future market trends
- 3.9 Technology and Innovation landscape
- 3.9.1 Current technological trends
- 3.9.2 Emerging technologies
- 3.10 Patent Landscape
- 3.11 Trade statistics (Note: the trade statistics will be provided for key countries only)
- 3.11.1 Major importing countries
- 3.11.2 Major exporting countries
- 3.12 Sustainability and Environmental Aspects
- 3.12.1 Sustainable Practices
- 3.12.2 Waste Reduction Strategies
- 3.12.3 Energy Efficiency in Production
- 3.12.4 Eco-friendly Initiatives
- 3.13 Carbon Footprint Considerations
Chapter 4 Competitive Landscape, 2024
- 4.1 Introduction
- 4.2 Company market share analysis
- 4.2.1 By region
- 4.2.1.1 North America
- 4.2.1.2 Europe
- 4.2.1.3 Asia Pacific
- 4.2.1.4 LATAM
- 4.2.1.5 MEA
- 4.2.1 By region
- 4.3 Company matrix analysis
- 4.4 Competitive analysis of major market players
- 4.5 Competitive positioning matrix
- 4.6 Key developments
- 4.6.1 Mergers & acquisitions
- 4.6.2 Partnerships & collaborations
- 4.6.3 New Product Launches
- 4.6.4 Expansion Plans
Chapter 5 Market Estimates and Forecast, By Chemical Type, 2021- 2034 (USD Million, Kilo Tons)
- 5.1 Key trends
- 5.2 Catalysts
- 5.2.1 Electrolysis catalysts (PEM, alkaline, solid oxide)
- 5.2.2 Photocatalysts
- 5.3 Electrolytes
- 5.3.1 Acidic electrolytes
- 5.3.2 Alkaline electrolytes
- 5.4 Membranes & ion exchange materials
- 5.4.1 Proton exchange membranes
- 5.4.2 Anion exchange membranes
- 5.5 Water treatment chemicals
- 5.5.1 Deionization agents
- 5.5.2 Anti-scaling agents
- 5.5.3 Corrosion inhibitors
- 5.6 Gas purification chemicals
- 5.6.1 Oxygen removal agents
- 5.6.2 Moisture absorbers
Chapter 6 Market Estimates and Forecast, By Production Technology, 2021 - 2034 (USD Million, Kilo Tons)
- 6.1 Key trends
- 6.2 Alkaline electrolysis
- 6.3 Proton exchange membrane (PEM) electrolysis
- 6.4 Solid oxide electrolysis
- 6.5 Photoelectrochemical water splitting
- 6.6 Thermochemical processes
Chapter 7 Market Estimates and Forecast, By End Use Industry, 2021 - 2034 (USD Million, Kilo Tons)
- 7.1 Key trends
- 7.2 Energy & power
- 7.3 Transportation
- 7.4 Industrial processing
- 7.5 Chemical manufacturing
- 7.6 Electronics
Chapter 8 Market Estimates and Forecast, By Region, 2021 - 2034 (USD Million, Kilo Tons)
- 8.1 Key trends
- 8.2 North America
- 8.2.1 U.S.
- 8.2.2 Canada
- 8.3 Europe
- 8.3.1 Germany
- 8.3.2 UK
- 8.3.3 France
- 8.3.4 Italy
- 8.3.5 Spain
- 8.3.6 Rest of Europe
- 8.4 Asia Pacific
- 8.4.1 China
- 8.4.2 India
- 8.4.3 Japan
- 8.4.4 Australia
- 8.4.5 South Korea
- 8.4.6 Rest of Asia Pacific
- 8.5 Latin America
- 8.5.1 Brazil
- 8.5.2 Mexico
- 8.5.3 Argentina
- 8.5.4 Rest of Latin America
- 8.6 Middle East & Africa
- 8.6.1 Saudi Arabia
- 8.6.2 South Africa
- 8.6.3 UAE
- 8.6.4 Rest of Middle East & Africa
Chapter 9 Company Profiles
- 9.1 Air Liquide S.A.
- 9.2 Air Products and Chemicals, Inc.
- 9.3 Linde plc
- 9.4 Siemens Energy AG
- 9.5 ENGIE
- 9.6 Plug Power Inc.
- 9.7 Bloom Energy Corporation
- 9.8 Nel Hydrogen
- 9.9 Cummins Inc.
- 9.10 McPhy Energy S.A.
- 9.11 thyssenkrupp AG
- 9.12 Ballard Power Systems Inc.
- 9.13 Reliance Industries Ltd.
- 9.14 Adani Green Energy Ltd.
- 9.15 Sinopec
 化學添加劑市場:按原料、形態、產品類型和應用分類-全球市場預測(2026-2032 年)丙烯醛二甲基縮醛市場:依等級、純度、應用、通路和最終用途產業分類-2026-2032年全球市場預測琥珀酸二鈉市場:依形態、等級、應用、通路和終端用戶產業分類-2026-2032年全球市場預測
 生物基琥珀酸鈉市場規模、佔有率和成長分析:按來源、產品等級、功能、終端用戶產業和地區分類-2026-2033年產業預測8-羥基喹啉銅鹽市場:2026-2032年全球市場預測(依產品類型、形態、純度等級、應用、終端用戶產業及通路分類)七葉苷市場:按產品形式、應用、最終用戶和銷售管道分類 - 2026-2032年全球預測
 2026年全球1,1'-羰基二咪唑(CDI)市場研究報告
 矽油噴塗劑市場規模、佔有率及成長分析:依產品類型、應用、終端用戶產業、通路及地區分類-2026-2033年產業預測全球無 PFAS 聚合物加工助劑市場(按聚合物類型、加工方式、應用和最終用途產業分類)預測(2026-2032 年)按產品類型、治療領域、給藥途徑、最終用戶、銷售管道和分銷管道分類的塞格他林市場全球預測(2026-2032 年)