


 |
市場調查報告書
商品編碼
1876657
溶劑回收系統市場機會、成長促進因素、產業趨勢分析及預測(2025-2034年)Solvent Recovery Systems Market Opportunity, Growth Drivers, Industry Trend Analysis, and Forecast 2025 - 2034 |
||||||
2024 年全球溶劑回收系統市場價值為 21 億美元,預計到 2034 年將以 10.9% 的複合年成長率成長至 61 億美元。
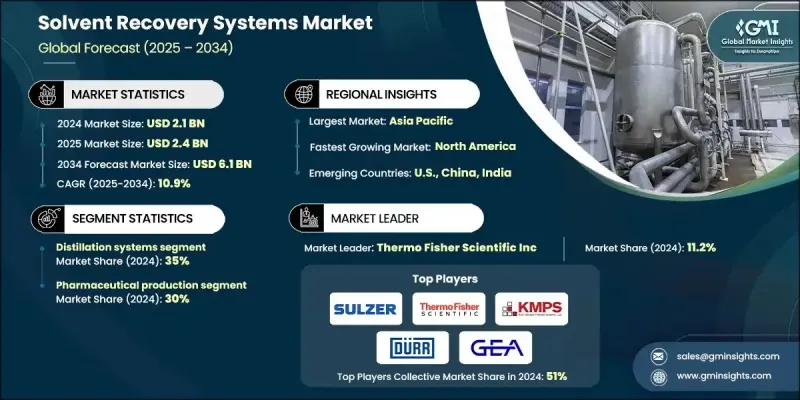
強勁的成長前景表明,各行業正迅速向永續營運、更嚴格的環境管理和更高的生產效率轉型。全球監管機構持續嚴格限制揮發性有機化合物(VOC)排放和危險廢棄物,並鼓勵企業採用溶劑回收而非處置的解決方案。區域和國家環境框架下日益嚴格的合規要求促使製造商投資高性能回收系統。同時,這些解決方案也帶來了顯著的成本優勢,使企業能夠減少高達50%的溶劑採購和廢棄物管理支出,通常兩年內即可收回成本。採用薄膜技術的更先進回收技術如今更勝一籌,與傳統蒸餾相比,可降低高達40%的能源消耗和資本支出。隨著各產業越來越重視資源循環利用,溶劑回收系統正成為營運規劃和長期永續發展目標的重要組成部分。
| 市場範圍 | |
|---|---|
| 起始年份 | 2024 |
| 預測年份 | 2025-2034 |
| 起始值 | 21億美元 |
| 預測值 | 61億美元 |
| 複合年成長率 | 10.9% |
真空蒸餾技術預計在2024年將佔據25%的市場佔有率,因為該技術對高溫下易分解的溶劑非常有效。這些系統在減壓條件下運行,可在較低溫度下進行分離,同時確保溶劑的品質。其效率通常可達90-95%,所提供的純度水準足以滿足對控制標準要求嚴格的應用需求。
預計到2024年,製藥製造業將佔據30%的市場佔有率,這主要得益於對純度的高要求以及對良好生產規範(GMP)的嚴格遵守。許多工廠需要能夠達到99%以上純度的回收系統來支持活性成分的生產,這推動了真空蒸餾和有機溶劑奈米過濾技術的應用。這些系統在保障產品完整性的同時,也最大限度地提高了溶劑的再利用率。隨著企業遵守嚴格的監管要求,需要進行全面的流程追蹤,具備內建文件功能的自動化設備也變得至關重要。
2024年美國溶劑回收系統市場規模為3.232億美元,預計2034年將達9.3億美元。北美在2024年佔據19.8%的市場佔有率,這主要得益於美國環保署(EPA)更嚴格的指令以及對工業永續發展日益成長的承諾。旨在減少揮發性有機化合物(VOC)排放的聯邦法規持續推動眾多製造領域的系統安裝。隨著製藥業在關鍵地區的擴張,對符合GMP和FDA要求的回收解決方案的需求依然旺盛,進一步促進了整體市場成長。
溶劑回收系統市場的主要參與者包括 Maratek Environmental、Thermo Fisher Scientific、Durr Group、Spooner AMCEC、Sulzer、Hydrite Chemical、鴻益環保設備、CBG Biotech、Koch Modular Process Systems、OFRU Recycling 和 GEA Group。這些公司依靠多種核心策略來提升其競爭力。許多公司大力投資先進的分離技術,以提高能源效率、降低營運成本,並支援對溶劑回收要求較高的應用。此外,各公司也專注於模組化和可客製化的系統設計,以滿足不同產業的需求。擴大全球製造能力和建立區域服務網路有助於縮短交貨週期並加強客戶支援。
目錄
第1章:方法論與範圍
第2章:執行概要
第3章:行業洞察
- 產業生態系分析
- 供應商格局
- 利潤率
- 每個階段的價值增加
- 影響價值鏈的因素
- 中斷
- 產業影響因素
- 成長促進因素
- 產業陷阱與挑戰
- 市場機遇
- 成長潛力分析
- 監管環境
- 北美洲
- 歐洲
- 亞太地區
- 拉丁美洲
- 中東和非洲
- 波特的分析
- PESTEL 分析
- 價格趨勢
- 按地區
- 未來市場趨勢
- 技術與創新格局
- 當前技術趨勢
- 新興技術
- 專利格局
- 貿易統計(HS編碼)(註:僅提供重點國家的貿易統計資料)
- 主要進口國
- 主要出口國
- 永續性和環境方面
- 永續實踐
- 減少廢棄物策略
- 生產中的能源效率
- 環保舉措
- 碳足跡考量
第4章:競爭格局
- 介紹
- 公司市佔率分析
- 按地區
- 北美洲
- 歐洲
- 亞太地區
- 拉丁美洲
- 中東和非洲
- 按地區
- 公司矩陣分析
- 主要市場參與者的競爭分析
- 競爭定位矩陣
- 關鍵進展
- 併購
- 合作夥伴關係與合作
- 新產品發布
- 擴張計劃
第5章:市場規模及預測:依製程類型分類,2021-2034年
- 主要趨勢
- 蒸餾系統
- 真空蒸餾系統
- 膜分離系統
- 微波增強恢復系統
- 吸附系統
第6章:市場規模及預測:依應用領域分類,2021-2034年
- 主要趨勢
- 汽車製造
- 噴漆車間及塗裝作業
- 零件清潔和除油
- 組裝過程中的溶劑混合與回收
- 電池製造(電動車和混合動力車)
- 其他
- 藥品生產
- 活性藥物成分(API)生產
- 實驗室溶劑回收
- 其他
- 印刷與包裝
- 柔版印刷
- 凹版印刷
- 平版印刷
- 其他
- 電子製造
- PCB製造與清洗
- 半導體晶圓加工
- 其他
- 航太與國防
- 複合材料製造
- 表面處理與準備
- 維護、修理和大修 (MRO)
- 其他
- 化學加工
- 其他
第7章:市場規模及預測:依安裝類型分類,2021-2034年
- 主要趨勢
- 現場系統
- 異地系統
第8章:市場規模及預測:依地區分類,2021-2034年
- 主要趨勢
- 北美洲
- 美國
- 加拿大
- 歐洲
- 英國
- 德國
- 法國
- 義大利
- 西班牙
- 歐洲其他地區
- 亞太地區
- 中國
- 印度
- 日本
- 韓國
- 澳洲
- 亞太其他地區
- 拉丁美洲
- 巴西
- 墨西哥
- 阿根廷
- 拉丁美洲其他地區
- 中東和非洲
- 南非
- 沙烏地阿拉伯
- 阿拉伯聯合大公國
- 中東和非洲其他地區
第9章:公司簡介
- Sulzer
- Thermo Fisher Scientific
- Koch Modular Process Systems
- Durr Group
- GEA Group
- Hydrite Chemical
- Maratek Environmental
- OFRU Recycling
- HongYi Environmental Equipment
- Spooner AMCEC
- CBG Biotech
- NexGen Enviro Systems
- TruSteel
- CleanPlanet Chemical
- Progressive Recovery
The Global Solvent Recovery Systems Market was valued at USD 2.1 billion in 2024 and is estimated to grow at a CAGR of 10.9% to reach USD 6.1 billion by 2034.
The strong growth outlook shows how quickly industries are moving toward sustainable operations, stricter environmental management, and improved production efficiency. Regulatory bodies worldwide continue enforcing aggressive limits on VOC emissions and hazardous waste, encouraging companies to adopt solutions that recover solvents rather than dispose of them. Increasing compliance demands under regional and national environmental frameworks have pushed manufacturers to invest in high-performance recovery systems. At the same time, these solutions deliver major cost advantages, enabling companies to reduce their solvent purchasing and waste management spending by up to 50%, with typical payback times often occurring within two years. More advanced recovery technologies using membranes now offer additional benefits, cutting energy use and capital expenses by as much as 40% compared with traditional distillation. As industries place greater emphasis on circular resource usage, solvent recovery systems are becoming an essential part of operational planning and long-term sustainability goals.
| Market Scope | |
|---|---|
| Start Year | 2024 |
| Forecast Year | 2025-2034 |
| Start Value | $2.1 Billion |
| Forecast Value | $6.1 Billion |
| CAGR | 10.9% |
The vacuum distillation technologies segment accounted for a 25% share in 2024, as they are effective for solvents that degrade under high heat. These systems operate under reduced pressure, allowing separation at lower temperatures while protecting solvent quality. Their efficiency ratings commonly reach 90-95%, providing purity levels suited for applications that require stringent control standards.
The pharmaceutical manufacturing segment held a 30% share in 2024, driven by demanding purity expectations and unwavering adherence to Good Manufacturing Practice guidelines. Many facilities require recovery systems capable of achieving purity levels above 99% to support active ingredient production, which fuels the adoption of vacuum distillation and organic solvent nanofiltration technologies. These systems safeguard product integrity while maximizing solvent reuse. Automated equipment with built-in documentation capabilities is also becoming essential as companies follow strict regulatory mandates that require comprehensive process tracking.
U.S. Solvent Recovery Systems Market generated USD 323.2 million in 2024 and is projected to reach USD 930 million by 2034. North America held a 19.8% share in 2024, supported by tougher EPA directives and a growing commitment to industrial sustainability. Federal regulations designed to reduce VOC emissions continue to accelerate system installations across many manufacturing segments. As the pharmaceutical sector expands in key regions, demand for recovery solutions that align with GMP and FDA expectations remains high, strengthening overall market growth.
Key companies participating in the Solvent Recovery Systems Market include Maratek Environmental, Thermo Fisher Scientific, Durr Group, Spooner AMCEC, Sulzer, Hydrite Chemical, HongYi Environmental Equipment, CBG Biotech, Koch Modular Process Systems, OFRU Recycling, and GEA Group. Companies in the Solvent Recovery Systems Market rely on several core strategies to expand their competitive standing. Many invest heavily in advanced separation technologies that improve energy efficiency, reduce operating costs, and support high-purity recovery for sensitive applications. Firms also focus on modular and customizable system designs to meet the needs of diverse industries. Expanding global manufacturing capability and building regional service networks help shorten lead times and strengthen customer support.
Table of Contents
Chapter 1 Methodology & Scope
- 1.1 Market scope and definition
- 1.2 Research design
- 1.2.1 Research approach
- 1.2.2 Data collection methods
- 1.3 Data mining sources
- 1.3.1 Global
- 1.3.2 Regional/Country
- 1.4 Base estimates and calculations
- 1.4.1 Base year calculation
- 1.4.2 Key trends for market estimation
- 1.5 Primary research and validation
- 1.5.1 Primary sources
- 1.6 Forecast model
- 1.7 Research assumptions and limitations
Chapter 2 Executive Summary
- 2.1 Industry 3600 synopsis
- 2.2 Key market trends
- 2.2.1 Process type
- 2.2.2 Application
- 2.2.3 Installation type
- 2.3 TAM analysis, 2025-2034
- 2.4 CXO perspectives: Strategic imperatives
- 2.4.1 Executive decision points
- 2.4.2 Critical success factors
- 2.5 Outlook and strategic recommendations
Chapter 3 Industry Insights
- 3.1 Industry ecosystem analysis
- 3.1.1 Supplier landscape
- 3.1.2 Profit margin
- 3.1.3 Value addition at each stage
- 3.1.4 Factor affecting the value chain
- 3.1.5 Disruptions
- 3.2 Industry impact forces
- 3.2.1 Growth drivers
- 3.2.2 Industry pitfalls and challenges
- 3.2.3 Market opportunities
- 3.3 Growth potential analysis
- 3.4 Regulatory landscape
- 3.4.1 North America
- 3.4.2 Europe
- 3.4.3 Asia Pacific
- 3.4.4 Latin America
- 3.4.5 Middle East & Africa
- 3.5 Porter's analysis
- 3.6 PESTEL analysis
- 3.7 Price trends
- 3.7.1 By region
- 3.8 Future market trends
- 3.9 Technology and innovation landscape
- 3.9.1 Current technological trends
- 3.9.2 Emerging technologies
- 3.10 Patent landscape
- 3.11 Trade statistics (HS code) (Note: the trade statistics will be provided for key countries only)
- 3.11.1 Major importing countries
- 3.11.2 Major exporting countries
- 3.12 Sustainability and environmental aspects
- 3.12.1 Sustainable practices
- 3.12.2 Waste reduction strategies
- 3.12.3 Energy efficiency in production
- 3.12.4 Eco-friendly initiatives
- 3.13 Carbon footprint considerations
Chapter 4 Competitive Landscape, 2024
- 4.1 Introduction
- 4.2 Company market share analysis
- 4.2.1 By region
- 4.2.1.1 North America
- 4.2.1.2 Europe
- 4.2.1.3 Asia Pacific
- 4.2.1.4 Latin America
- 4.2.1.5 Middle East & Africa
- 4.2.1 By region
- 4.3 Company matrix analysis
- 4.4 Competitive analysis of major market players
- 4.5 Competitive positioning matrix
- 4.6 Key developments
- 4.6.1 Mergers & acquisitions
- 4.6.2 Partnerships & collaborations
- 4.6.3 New product launches
- 4.6.4 Expansion plans
Chapter 5 Market Size and Forecast, By Process Type, 2021-2034 (USD Billion, Kilo Tons)
- 5.1 Key trends
- 5.2 Distillation systems
- 5.3 Vacuum distillation systems
- 5.4 Membrane separation systems
- 5.5 Microwave-enhanced recovery systems
- 5.6 Adsorption systems
Chapter 6 Market Size and Forecast, By Application, 2021-2034 (USD Billion, Kilo Tons)
- 6.1 Key trends
- 6.2 Automotive manufacturing
- 6.2.1 Paint shop & coating operations
- 6.2.2 Parts cleaning & degreasing
- 6.2.3 Solvent blending & recycling in assembly
- 6.2.4 Battery manufacturing (EVs & hybrids)
- 6.2.5 Others
- 6.3 Pharmaceutical production
- 6.3.1 Active pharmaceutical ingredient (API) manufacturing
- 6.3.2 Laboratory solvent recovery
- 6.3.3 Others
- 6.4 Printing & packaging
- 6.4.1 Flexographic printing
- 6.4.2 Gravure printing
- 6.4.3 Lithographic printing
- 6.4.4 Others
- 6.5 Electronics manufacturing
- 6.5.1 PCB manufacturing & cleaning
- 6.5.2 Semiconductor wafer processing
- 6.5.3 Others
- 6.6 Aerospace & defense
- 6.6.1 Composite material fabrication
- 6.6.2 Surface treatment & preparation
- 6.6.3 Maintenance, repair & overhaul (MRO)
- 6.6.4 Others
- 6.7 Chemical processing
- 6.7.1 Others
Chapter 7 Market Size and Forecast, By Installation Type, 2021-2034 (USD Billion, Kilo Tons)
- 7.1 Key trends
- 7.2 On-site systems
- 7.3 Off-site systems
Chapter 8 Market Size and Forecast, By Region, 2021-2034 (USD Billion, Kilo Tons)
- 8.1 Key trends
- 8.2 North America
- 8.2.1 U.S.
- 8.2.2 Canada
- 8.3 Europe
- 8.3.1 UK
- 8.3.2 Germany
- 8.3.3 France
- 8.3.4 Italy
- 8.3.5 Spain
- 8.3.6 Rest of Europe
- 8.4 Asia Pacific
- 8.4.1 China
- 8.4.2 India
- 8.4.3 Japan
- 8.4.4 South Korea
- 8.4.5 Australia
- 8.4.6 Rest of Asia Pacific
- 8.5 Latin America
- 8.5.1 Brazil
- 8.5.2 Mexico
- 8.5.3 Argentina
- 8.5.4 Rest of Latin America
- 8.6 Middle East & Africa
- 8.6.1 South Africa
- 8.6.2 Saudi Arabia
- 8.6.3 UAE
- 8.6.4 Rest of Middle East & Africa
Chapter 9 Company Profiles
- 9.1 Sulzer
- 9.2 Thermo Fisher Scientific
- 9.3 Koch Modular Process Systems
- 9.4 Durr Group
- 9.5 GEA Group
- 9.6 Hydrite Chemical
- 9.7 Maratek Environmental
- 9.8 OFRU Recycling
- 9.9 HongYi Environmental Equipment
- 9.10 Spooner AMCEC
- 9.11 CBG Biotech
- 9.12 NexGen Enviro Systems
- 9.13 TruSteel
- 9.14 CleanPlanet Chemical
- 9.15 Progressive Recovery
 溶劑回收和再利用市場按類型、技術、回收系統類型和最終用途產業分類-2025-2032年全球預測
 溶劑回收和再循環市場-全球產業規模、佔有率、趨勢、機會和預測,按技術、溶劑類型、最終用途產業、地區和競爭細分,2020-2030 年預測
 2025-2033年按類型(現場溶劑回收、場外溶劑回收)、應用(印刷工業、油漆和塗料工業、石油和化學工業、製藥工業等)和地區分類的溶劑回收市場報告
 到 2030 年溶劑回收和再循環市場預測:按溶劑類型、回收方法、技術、應用、最終用戶和地區進行的全球分析NMP 回收解決方案市場:材料類型、回收製程、最終用戶產業、產品形式、廢棄物來源、技術 - 2025-2030 年全球預測NMP 溶劑回收服務市場:依最終用途產業、技術、應用、服務類型、客戶類型 - 2025-2030 年全球預測
 全球溶劑回收再循環市場