


 |
市場調查報告書
商品編碼
1876603
零售受眾測量解決方案市場機會、成長促進因素、產業趨勢分析及預測(2025-2034 年)Retail Audience Measurement Solutions Market Opportunity, Growth Drivers, Industry Trend Analysis, and Forecast 2025 - 2034 |
||||||
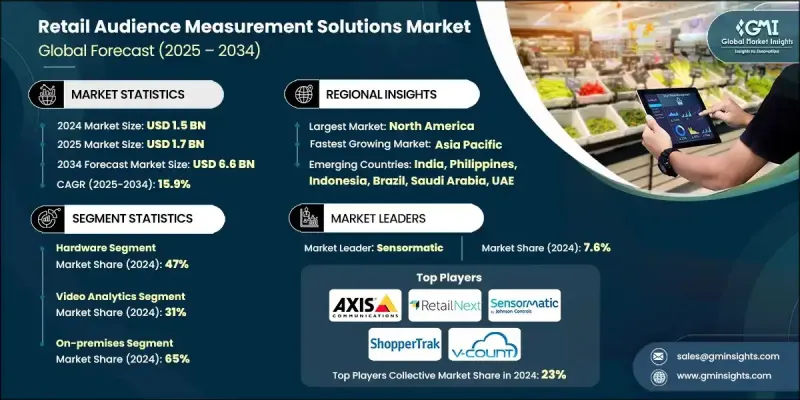
2024 年全球零售受眾測量解決方案市場價值為 15 億美元,預計到 2034 年將以 15.9% 的複合年成長率成長至 66 億美元。
實體零售環境的快速數位轉型正在重塑店內分析格局。人工智慧、電腦視覺和感測器融合等先進技術使零售商能夠即時洞察顧客行為,包括客流量、停留時間和人口統計資料。這些洞察使品牌能夠基於數據做出關於店鋪佈局、商品策略和營運效率的決策,同時嚴格遵守資料隱私法規。這些系統的整合減少了店舖管理中的低效環節,提高了轉換率,並增強了全通路客戶體驗。分析提供者、硬體製造商和人工智慧軟體開發人員之間的合作正在加速創新,從而催生出端到端的受眾測量平台。市場參與者也正在利用雲端原生基礎設施、隱私保護型人工智慧模型和多感測器分析功能來升級其軟體生態系統。這些進步正在促進高度可擴展、合規且精準的受眾測量系統的部署,從而改變零售商最佳化業績和提升消費者在實體零售空間參與度的方式。
| 市場範圍 | |
|---|---|
| 起始年份 | 2024 |
| 預測年份 | 2025-2034 |
| 起始值 | 15億美元 |
| 預測值 | 66億美元 |
| 複合年成長率 | 15.9% |
硬體領域佔據47%的市場佔有率,預計到2034年將以15.1%的複合年成長率成長。硬體有助於從零售環境中收集精準的即時資料。攝影機、熱感應器、Wi-Fi和藍牙追蹤器以及智慧計數器等設備構成了客流追蹤系統的核心。零售商越來越重視耐用且可擴展的硬體解決方案,這些方案能夠與分析平台無縫整合,從而提供準確的洞察。這項轉變的驅動力在於對智慧門市基礎設施日益成長的需求,而人工智慧驅動的決策在很大程度上依賴可靠且高品質的資料收集。
2024年,視訊分析領域約佔市場佔有率的31%,預計2025年至2034年間將以超過16.5%的複合年成長率成長。該領域的領先地位源於其能夠產生關於消費者行為、客流量和排隊管理的詳細即時洞察。透過採用人工智慧驅動的影片分析,零售商可以最佳化店鋪佈局、提升產品陳列效果並改善店內互動。這項技術使零售商能夠監控客流模式、識別客流高峰時段並分析顧客停留時間,從而幫助他們做出數據驅動的決策,提高銷售效率和營運績效。
美國零售受眾測量解決方案市場佔85%的佔有率,預計2024年市場規模將達到4.793億美元。在數位轉型計畫以及人工智慧和雲端分析技術日益普及的推動下,美國零售業正經歷著快速變革。先進的受眾洞察技術正在革新門市營運,提升行銷效率,並確保符合隱私法規。聯邦和州政府層級支持數位創新和資料治理的政策,正鼓勵零售商投資先進且符合隱私權法規的測量平台。
全球零售受眾測量解決方案市場的主要參與者包括 Dor Technologies、Quividi、RetailNext、Axis Communications、Sensormatic、Broox Technologies、Advertima、V-Count、ShopperTrak(泰科集團旗下)和 Density。這些公司正採取以創新、合作和數據驅動最佳化為核心的策略來拓展市場。許多公司正大力投資人工智慧、機器學習和電腦視覺技術,以提高店內分析的準確性。軟體開發商和硬體製造商之間的策略合作正在推動整合式端到端系統的建置。此外,各公司也正在向雲端和邊緣運算平台轉型,以實現更快、可擴展且符合隱私保護要求的資料處理。
目錄
第1章:方法論
- 市場範圍和定義
- 研究設計
- 研究方法
- 資料收集方法
- 資料探勘來源
- 全球的
- 地區/國家
- 基準估算和計算
- 基準年計算
- 市場估算的關鍵趨勢
- 初步研究和驗證
- 原始資料
- 預測模型
- 研究假設和局限性
第2章:執行概要
第3章:行業洞察
- 產業生態系分析
- 供應商格局
- 利潤率分析
- 成本結構
- 每個階段的價值增加
- 影響價值鏈的因素
- 中斷
- 產業影響因素
- 成長促進因素
- 人工智慧和電腦視覺技術的應用日益普及
- 店內業績和投資報酬率分析的需求激增
- 全通路和數據驅動型零售策略的成長
- 對健康、安全和入住率監測的需求不斷成長
- 產業陷阱與挑戰
- 嚴格的資料隱私和消費者保護法規
- 系統整合和資料管理的複雜性
- 市場機遇
- 零售媒體網路和受眾貨幣化的擴展
- 中小企業和加盟零售商對基於 SaaS 的採用率不斷提高
- 在購物中心、機場和公共場所的部署量不斷成長
- 即時分析與自動化系統的融合日益增強
- 成長促進因素
- 成長潛力分析
- 監管環境
- 北美洲
- 歐洲
- 亞太地區
- 拉丁美洲
- 波特的分析
- PESTEL 分析
- 技術與創新格局
- 當前技術趨勢
- 新興技術
- 專利分析
- 價格趨勢
- 按地區
- 搭車
- 成本細分分析
- 商業案例及投資報酬率分析
- 總擁有成本框架
- 投資報酬率計算方法
- 實施時間表和里程碑
- 風險評估與緩解策略
- 永續性和環境影響分析
- 永續實踐
- 減少廢棄物策略
- 生產中的能源效率
- 環保舉措
- 碳足跡考量
- 未來展望與機遇
- 新興應用機遇
- 投資需求及資金來源
- 風險評估與緩解策略
- 針對市場參與者的策略建議
- 客戶成功指標與KPI框架
- 供應商評估與選擇標準
- 實施時間表和專案管理
- 變革管理及組織影響
第4章:競爭格局
- 介紹
- 公司市佔率分析
- 北美洲
- 歐洲
- 亞太地區
- 拉丁美洲
- 主要市場參與者的競爭分析
- 競爭定位矩陣
- 戰略展望矩陣
- 關鍵進展
- 併購
- 合作夥伴關係與合作
- 新產品發布
- 擴張計劃和資金
第5章:市場估算與預測:依組件分類,2021-2034年
- 主要趨勢
- 硬體
- 感應器
- 相機
- 網路裝置
- 軟體
- 分析儀表板
- 數據視覺化和人工智慧模組
- API整合
- 服務
- 安裝和校準
- 管理分析和報告
- 維護與支援
第6章:市場估算與預測:依應用領域分類,2021-2034年
- 主要趨勢
- 客流量和人流量
- 隊列管理
- 店鋪佈局及陳列圖最佳化
- 人口統計和行為分析
- 其他
第7章:市場估計與預測:依技術分類,2021-2034年
- 主要趨勢
- 影片分析
- 紅外線/熱感
- 3D立體視覺感測器
- Wi-Fi/藍牙追蹤
- 人工智慧和機器學習演算法
- 其他
第8章:市場估算與預測:依部署模式分類,2021-2034年
- 主要趨勢
- 本地部署
- 雲
- 混合
第9章:市場估算與預測:依最終用途分類,2021-2034年
- 主要趨勢
- 超市和大型超市
- 便利商店
- 百貨公司
- 專賣店
- 其他
第10章:市場估計與預測:依地區分類,2021-2034年
- 主要趨勢
- 北美洲
- 美國
- 加拿大
- 歐洲
- 德國
- 英國
- 法國
- 義大利
- 西班牙
- 俄羅斯
- 亞太地區
- 中國
- 印度
- 日本
- 澳洲
- 韓國
- 菲律賓
- 印尼
- 拉丁美洲
- 巴西
- 墨西哥
- 阿根廷
- MEA
- 南非
- 沙烏地阿拉伯
- 阿拉伯聯合大公國
第11章:公司簡介
- 全球參與者
- Advertima
- Axis Communications
- Broox Technologies
- Circana
- Comscore
- Density
- Dor Technologies
- Nielsen
- Oracle
- Quividi
- RetailNext
- Sensormatic
- ShopperTrak (Tyco)
- The Trade Desk
- V-Count
- 區域玩家
- Criteo
- Databricks
- InfoSum
- iSpot.tv
- LiveRamp
- MetaRouter
- Palantir Technologies
- Snowflake
- 新興參與者
- Amplitude
- FullStory
- Heap
- Hotjar
- LogRocket
- Mixpanel
- Quantum Metric
The Global Retail Audience Measurement Solutions Market was valued at USD 1.5 billion in 2024 and is estimated to grow at a CAGR of 15.9% to reach USD 6.6 billion by 2034.
The rapid digital transformation of physical retail environments is reshaping the in-store analytics landscape. Advanced technologies such as artificial intelligence, computer vision, and sensor fusion are enabling retailers to capture real-time insights into shopper behavior, including footfall, dwell time, and demographic data. These insights empower brands to make data-driven decisions on store layouts, merchandising strategies, and operational efficiency while maintaining strict data privacy compliance. The integration of these systems reduces inefficiencies in store management, enhances conversion rates, and strengthens the omnichannel customer experience. Collaboration among analytics providers, hardware manufacturers, and AI software developers is accelerating innovation, resulting in end-to-end audience measurement platforms. Market participants are also modernizing their software ecosystems with cloud-native infrastructure, privacy-preserving AI models, and multi-sensor analytics capabilities. These advancements are facilitating the deployment of highly scalable, compliant, and accurate audience measurement systems that transform how retailers optimize performance and enhance consumer engagement in physical retail spaces.
| Market Scope | |
|---|---|
| Start Year | 2024 |
| Forecast Year | 2025-2034 |
| Start Value | $1.5 Billion |
| Forecast Value | $6.6 Billion |
| CAGR | 15.9% |
The hardware segment held a 47% share and is expected to grow at a CAGR of 15.1% through 2034. Hardware helps in collecting precise, real-time data from retail environments. Devices such as cameras, thermal sensors, Wi-Fi and Bluetooth trackers, and smart counters form the backbone of audience tracking systems. Retailers are increasingly prioritizing durable and scalable hardware solutions that seamlessly integrate with analytics platforms to deliver accurate insights. This shift is driven by the rising demand for intelligent store infrastructures, where AI-driven decisions depend heavily on reliable and high-quality data collection.
The video analytics segment accounted for approximately 31% of the market share in 2024 and is forecasted to grow at a CAGR of more than 16.5% between 2025 and 2034. The dominance of this segment stems from its ability to generate detailed, real-time insights into consumer behavior, foot traffic, and queue management. By adopting AI-powered video analytics, retailers can refine store layouts, enhance product placement, and improve in-store interactions. This technology allows retailers to monitor customer flow patterns, identify peak activity hours, and analyze dwell times, helping them make data-backed decisions to increase sales efficiency and operational performance.
United States Retail Audience Measurement Solutions Market held an 85% share, generating USD 479.3 million in 2024. The U.S. retail landscape is undergoing rapid evolution, fueled by large-scale digital transformation initiatives and the increasing adoption of AI and cloud-based analytics. Enhanced audience insight technologies are revolutionizing in-store operations, improving marketing effectiveness, and ensuring compliance with privacy regulations. Supportive federal and state-level policies promoting digital innovation and data governance are encouraging retailers to invest in sophisticated, privacy-compliant measurement platforms.
Prominent companies operating in the Global Retail Audience Measurement Solutions Market include Dor Technologies, Quividi, RetailNext, Axis Communications, Sensormatic, Broox Technologies, Advertima, V-Count, ShopperTrak (Tyco), and Density. Companies in the Retail Audience Measurement Solutions Market are adopting strategies centered on innovation, partnerships, and data-driven optimization to expand their market reach. Many are investing heavily in AI, machine learning, and computer vision to enhance the accuracy of in-store analytics. Strategic collaborations between software developers and hardware manufacturers are fostering the creation of integrated end-to-end systems. Firms are also transitioning to cloud-based and edge computing platforms to deliver faster, scalable, and privacy-compliant data processing.
Table of Contents
Chapter 1 Methodology
- 1.1 Market scope and definition
- 1.2 Research design
- 1.2.1 Research approach
- 1.2.2 Data collection methods
- 1.3 Data mining sources
- 1.3.1 Global
- 1.3.2 Regional/Country
- 1.4 Base estimates and calculations
- 1.4.1 Base year calculation
- 1.4.2 Key trends for market estimation
- 1.5 Primary research and validation
- 1.5.1 Primary sources
- 1.6 Forecast model
- 1.7 Research assumptions and limitations
Chapter 2 Executive Summary
- 2.1 Industry 360° synopsis, 2021 - 2034
- 2.2 Key market trends
- 2.2.1 Regional
- 2.2.2 Component
- 2.2.3 Technology
- 2.2.4 Deployment Mode
- 2.2.5 End Use
- 2.2.6 Application
- 2.3 TAM Analysis, 2025-2034
- 2.4 CXO perspectives: Strategic imperatives
- 2.4.1 Executive decision points
- 2.4.2 Critical success factors
- 2.5 Future outlook and strategic recommendations
Chapter 3 Industry Insights
- 3.1 Industry ecosystem analysis
- 3.1.1 Supplier landscape
- 3.1.2 Profit margin analysis
- 3.1.3 Cost structure
- 3.1.4 Value addition at each stage
- 3.1.5 Factor affecting the value chain
- 3.1.6 Disruptions
- 3.2 Industry impact forces
- 3.2.1 Growth drivers
- 3.2.1.1 Increase in adoption of AI and computer-vision technologies
- 3.2.1.2 Surge in demand for in-store performance and ROI analytics
- 3.2.1.3 Growth in omnichannel and data-driven retail strategies
- 3.2.1.4 Rise in demand for health, safety, and occupancy monitoring
- 3.2.2 Industry pitfalls and challenges
- 3.2.2.1 Stringent data privacy and consumer protection regulations
- 3.2.2.2 Complexity in system integration and data management
- 3.2.3 Market opportunities
- 3.2.3.1 Expansion of retail media networks and audience monetization
- 3.2.3.2 Increase in SaaS-based adoption among SMB and franchise retailers
- 3.2.3.3 Growth in deployments across malls, airports, and public spaces
- 3.2.3.4 Rising integration of real-time analytics with automation systems
- 3.2.1 Growth drivers
- 3.3 Growth potential analysis
- 3.4 Regulatory landscape
- 3.4.1 North America
- 3.4.2 Europe
- 3.4.3 Asia Pacific
- 3.4.4 LAMEA
- 3.5 Porter's analysis
- 3.6 PESTEL analysis
- 3.7 Technology and Innovation landscape
- 3.7.1 Current technological trends
- 3.7.2 Emerging technologies
- 3.8 Patent analysis
- 3.9 Price trends
- 3.9.1 By region
- 3.9.2 By vehicle
- 3.10 Cost breakdown analysis
- 3.11 Business Case & ROI Analysis
- 3.11.1 Total cost of ownership framework
- 3.11.2 ROI calculation methodologies
- 3.11.3 Implementation timeline & milestones
- 3.11.4 Risk assessment & mitigation strategies
- 3.12 Sustainability and environmental impact analysis
- 3.12.1 Sustainable practices
- 3.12.2 Waste reduction strategies
- 3.12.3 Energy efficiency in production
- 3.12.4 Eco-friendly initiatives
- 3.12.5 Carbon footprint considerations
- 3.13 Future outlook & opportunities
- 3.13.1 Emerging Application Opportunities
- 3.13.2 Investment Requirements & Funding Sources
- 3.13.3 Risk Assessment & Mitigation Strategies
- 3.13.4 Strategic Recommendations for Market Participants
- 3.14 Customer success metrics & KPI framework
- 3.15 Vendor evaluation & selection criteria
- 3.16 Implementation timelines & project management
- 3.17 Change management & organizational impact
Chapter 4 Competitive Landscape, 2024
- 4.1 Introduction
- 4.2 Company market share analysis
- 4.2.1 North America
- 4.2.2 Europe
- 4.2.3 Asia Pacific
- 4.2.4 LAMEA
- 4.3 Competitive analysis of major market players
- 4.4 Competitive positioning matrix
- 4.5 Strategic outlook matrix
- 4.6 Key developments
- 4.6.1 Mergers & acquisitions
- 4.6.2 Partnerships & collaborations
- 4.6.3 New Product Launches
- 4.6.4 Expansion Plans and funding
Chapter 5 Market Estimates & Forecast, By Component, 2021 - 2034 ($Bn, Units)
- 5.1 Key trends
- 5.2 Hardware
- 5.2.1 Sensors
- 5.2.2 Cameras
- 5.2.3 Network Devices
- 5.3 Software
- 5.3.1 Analytics dashboard
- 5.3.2 Data visualization and AI modules
- 5.3.3 API integrations
- 5.4 Services
- 5.4.1 Installation and calibration
- 5.4.2 Managed analytics & reporting
- 5.4.3 Maintenance & support
Chapter 6 Market Estimates & Forecast, By Application, 2021 - 2034 ($Bn, Units)
- 6.1 Key trends
- 6.2 Customer Traffic & Footfall
- 6.3 Queue Management
- 6.4 Store Layout & Planogram Optimization
- 6.5 Demographic & Behavioral Profiling
- 6.6 Others
Chapter 7 Market Estimates & Forecast, By Technology, 2021 - 2034 ($Bn, Units)
- 7.1 Key trends
- 7.2 Video Analytics
- 7.3 Infrared / Thermal Sensing
- 7.4 3D Stereo Vision Sensors
- 7.5 Wi-Fi / Bluetooth Tracking
- 7.6 AI & Machine Learning Algorithms
- 7.7 Other
Chapter 8 Market Estimates & Forecast, By Deployment Mode, 2021 - 2034 ($Bn, Units)
- 8.1 Key trends
- 8.2 On-Premises
- 8.3 Cloud
- 8.4 Hybrid
Chapter 9 Market Estimates & Forecast, By End Use, 2021 - 2034 ($Bn, Units)
- 9.1 Key trends
- 9.2 Supermarkets & Hypermarkets
- 9.3 Convenience stores
- 9.4 Department stores
- 9.5 Specialty stores
- 9.6 Others
Chapter 10 Market Estimates & Forecast, By Region, 2021 - 2034 ($Bn, Units)
- 10.1 Key trends
- 10.2 North America
- 10.2.1 US
- 10.2.2 Canada
- 10.3 Europe
- 10.3.1 Germany
- 10.3.2 UK
- 10.3.3 France
- 10.3.4 Italy
- 10.3.5 Spain
- 10.3.6 Russia
- 10.4 Asia Pacific
- 10.4.1 China
- 10.4.2 India
- 10.4.3 Japan
- 10.4.4 Australia
- 10.4.5 South Korea
- 10.4.6 Philippines
- 10.4.7 Indonesia
- 10.5 Latin America
- 10.5.1 Brazil
- 10.5.2 Mexico
- 10.5.3 Argentina
- 10.6 MEA
- 10.6.1 South Africa
- 10.6.2 Saudi Arabia
- 10.6.3 UAE
Chapter 11 Company Profiles
- 11.1 Global Players
- 11.1.1 Advertima
- 11.1.2 Axis Communications
- 11.1.3 Broox Technologies
- 11.1.4 Circana
- 11.1.5 Comscore
- 11.1.6 Density
- 11.1.7 Dor Technologies
- 11.1.8 Nielsen
- 11.1.9 Oracle
- 11.1.10 Quividi
- 11.1.11 RetailNext
- 11.1.12 Sensormatic
- 11.1.13 ShopperTrak (Tyco)
- 11.1.14 The Trade Desk
- 11.1.15 V-Count
- 11.2 Regional Players
- 11.2.1 Criteo
- 11.2.2 Databricks
- 11.2.3 InfoSum
- 11.2.4 iSpot.tv
- 11.2.5 LiveRamp
- 11.2.6 MetaRouter
- 11.2.7 Palantir Technologies
- 11.2.8 Snowflake
- 11.3 Emerging Players
- 11.3.1 Amplitude
- 11.3.2 FullStory
- 11.3.3 Heap
- 11.3.4 Hotjar
- 11.3.5 LogRocket
- 11.3.6 Mixpanel
- 11.3.7 Quantum Metric
 通訊測試與測量市場分析及預測(至2035年):依類型、產品、服務、技術、組件、應用、設備、部署類型、最終用戶與功能分類
 通訊測試與測量市場(按服務提供、技術、測試環境、分銷管道和最終用戶)—2025-2032 年全球預測
 零售受眾測量解決方案市場規模、佔有率和趨勢分析報告:按組件、應用、最終用途、地區和細分市場預測,2025 年至 2033 年
 通訊測試與測量市場機會、成長動力、產業趨勢分析及 2025 - 2034 年預測
 到 2030 年的通訊測試和測量市場預測:按產品類型、測試類型、產品、技術、應用、最終用戶和地區進行的全球分析
 全球通訊測試和測量市場規模、佔有率和趨勢分析報告,依測試解決方案(有線和無線)、產品(硬體、軟體和服務)、測試類型、最終用戶、區域展望和預測, 2024 - 2031
 通訊測試和測量市場:按產品、測試解決方案、測試類型、最終用戶、地區分類 - 到 2029 年的預測