


 |
市場調查報告書
商品編碼
1871210
智慧家庭產品市場機會、成長促進因素、產業趨勢分析及預測(2025-2034年)Smart Home Products Market Opportunity, Growth Drivers, Industry Trend Analysis, and Forecast 2025 - 2034 |
||||||
2024年全球智慧家庭產品市場價值為1,543億美元,預計到2034年將以9.6%的複合年成長率成長至3,849億美元。
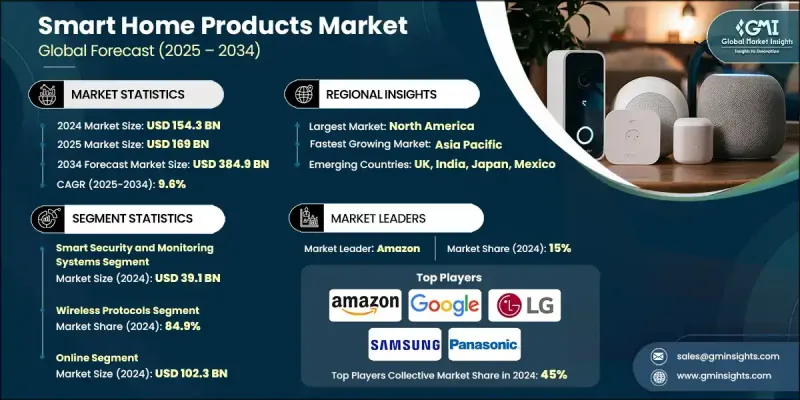
隨著家庭越來越傾向於使用旨在提升舒適度、能源效率和永續性的互聯技術,市場正在經歷快速轉型。推動這一領域發展的一大趨勢是將再生能源系統(尤其是太陽能)與智慧家庭設備結合。政府激勵措施,例如美國聯邦太陽能稅收抵免政策(安裝可享有30%的補貼),正在加速太陽能相容型智慧解決方案的普及。向環保生活方式的轉變促使製造商設計符合全球綠色建築標準的設備。根據美國綠色建築委員會估計,住宅空間中的節能技術可將能源消耗降低高達30%。市場上的公司正在利用尖端材料和人工智慧來提升產品的性能和功能。智慧恆溫器、智慧空氣清淨機和人工智慧機器人設備正成為永續智慧生活的重要組成部分,兼顧便利性和環保責任。日益增強的環保意識和自動化技術的進步將繼續推動全球智慧家庭技術的發展。
| 市場範圍 | |
|---|---|
| 起始年份 | 2024 |
| 預測年份 | 2025-2034 |
| 起始值 | 1543億美元 |
| 預測值 | 3849億美元 |
| 複合年成長率 | 9.6% |
2024年,智慧安防監控系統市場規模預計將達391億美元。家庭安全解決方案需求的激增以及物聯網整合度的提高推動了這一成長。根據美國能源部統計,智慧家居產業正以每年20%的速度成長,這主要得益於政府為促進節能和先進安防而推出的各項措施。製造商們積極回應,開發出不僅能提升安全性,還能最佳化能源消耗的智慧系統。專注於永續和節能安防系統的公司正積極響應政策激勵措施支持的綠色家居計劃,這進一步促進了已開發地區對智慧家庭的普及。
到了2024年,無線協定領域佔84.9%的市場。 Zigbee、Wi-Fi和Z-Wave等技術仍然是智慧家庭物聯網連接的基石,它們具有簡單、可靠和靈活等優點。雲端平台和行動應用程式的廣泛應用正促使消費者投資購買無線設備。無線系統使用戶能夠遠端控制照明、溫度和家電,從而提高便利性並減少能源浪費。這些系統還支援無縫升級和互通性,滿足了消費者對互聯節能生活環境日益成長的需求。便捷易用的安裝方式正持續推動無線技術在智慧家庭生態系統中佔據主導地位。
2024年,美國智慧家庭產品市佔率達到77.2%,並持續維持該地區領先地位。強勁的經濟情勢、不斷提升的消費者購買力以及智慧家庭系統日益普及,鞏固了美國作為產業成長關鍵驅動力的地位。美國消費者越來越青睞高階、技術先進的產品,這些產品能夠提供更佳的能源管理、永續性和舒適性。眾多全球知名品牌進駐美國市場,進一步增強了其影響力。這些公司致力於創新、整合和智慧基礎設施建設,以滿足消費者不斷變化的生活方式需求。
全球智慧家居產品市場的主要參與者包括LG、亞馬遜、戴森、三星、霍尼韋爾、谷歌、博世、iRobot、Ecobee、Ring、松下、施耐德電氣、西門子、Sonos和小米。為了鞏固市場地位,領先企業正致力於創新、合作和產品多元化。許多企業正透過人工智慧驅動的自動化、雲端整合以及與再生能源系統的兼容性來擴展其智慧生態系統。與技術提供者和綠色能源公司的合作正在提升產品的功能性和永續性。各公司也在加大研發投入,以開發具有更高能源效率和無縫互通性的設備。策略性併購以及向新興市場的擴張有助於品牌贏得更大的客戶群。
目錄
第1章:方法論與範圍
第2章:執行概要
第3章:行業洞察
- 產業生態系分析
- 供應商格局
- 利潤率
- 每個階段的價值增加
- 影響價值鏈的因素
- 產業影響因素
- 成長促進因素
- 對能源效率日益成長的需求
- 物聯網和無線連接擴展
- 安全問題
- 產業陷阱與挑戰
- 資料隱私與網路安全風險
- 高昂的初始成本和分散的生態系統
- 機會
- 新興市場的成長
- 與健康和醫療保健的融合
- 成長促進因素
- 成長潛力分析
- 未來市場趨勢
- 技術與創新格局
- 當前技術趨勢
- 新興技術
- 價格趨勢
- 按地區
- 依產品類型
- 監管環境
- 標準和合規要求
- 區域監理框架
- 認證標準
- 風險評估
- 差距分析
- 波特的分析
- PESTEL 分析
- 消費者行為分析
- 購買模式
- 偏好分析
- 消費者行為的區域差異
- 電子商務對購買決策的影響
第4章:競爭格局
- 介紹
- 公司市佔率分析
- 按地區
- 公司矩陣分析
- 主要市場參與者的競爭分析
- 競爭定位矩陣
- 關鍵進展
- 併購
- 合作夥伴關係與合作
- 新產品發布
- 擴張計劃
第5章:市場估算與預測:依產品類型分類,2021-2034年
- 主要趨勢
- 智慧安防監控系統
- 監視器
- 嬰兒監視器
- 智慧門鎖
- 其他(智慧型煙霧偵測器等)
- 智慧照明和電氣系統
- 智慧燈泡
- 智慧燈開關
- 智慧燈具
- 其他(智慧配電盤等)
- 智慧氣候控制與暖通空調系統
- 智慧型恆溫器
- 智慧暖通空調控制器
- 智慧型空氣清淨機
- 智慧加濕器和除濕器
- 其他(智慧空氣品質監測器等)
- 智慧娛樂與媒體系統
- 智慧音箱
- 智慧型串流媒體設備
- 智慧投影儀
- 智慧型遊戲機
- 其他(智慧VR/AR系統等)
- 智慧廚房和家電系統
- 智慧冰箱
- 智慧型烤箱和爐具
- 智慧洗碗機
- 智慧咖啡機
- 其他(智慧攪拌機等)
- 智慧洗衣和清潔系統
- 智慧型洗衣機
- 智慧型烘乾機
- 智慧機器人吸塵器
- 其他(智慧窗戶清潔器等)
- 智慧戶外及花園系統
- 智慧灑水控制器
- 智慧滴灌
- 智慧割草機
- 其他(智慧氣象站等)
- 智慧健康與保健系統
- 智慧空氣品質監測器
- 智慧睡眠監測器
- 智慧藥品發放器
- 其他(智慧跌倒偵測系統等)
- 智慧能源與公用事業系統
- 智慧電錶
- 智慧太陽能系統
- 智慧電池儲存
- 其他(智慧型負載控制器等)
- 其他(智慧連接與控制系統等)
第6章:市場估算與預測:以連結方式分類,2021-2034年
- 主要趨勢
- 無線協定
- ZigBee
- 無線上網
- 藍牙
- Z-Wave
- 其他
- 有線協議
- 乙太網路
- 電力線路通訊(PLC)
- 混合。
第7章:市場估計與預測:依價格分類,2021-2034年
- 主要趨勢
- 低價(低於 500 美元)
- 中等(500 美元至 1000 美元之間)
- 高價(1000 美元以上)
第8章:市場估算與預測:依安裝量分類,2021-2034年
- 主要趨勢
- 新建工程
- 改造
第9章:市場估算與預測:依配銷通路分類,2021-2034年
- 主要趨勢
- 線上
- 離線
第10章:市場估計與預測:依地區分類,2021-2034年
- 主要趨勢
- 北美洲
- 美國
- 加拿大
- 歐洲
- 德國
- 英國
- 法國
- 西班牙
- 義大利
- 亞太地區
- 中國
- 日本
- 印度
- 澳洲
- 韓國
- 拉丁美洲
- 巴西
- 墨西哥
- 阿根廷
- 中東和非洲
- 南非
- 沙烏地阿拉伯
- 阿拉伯聯合大公國
第11章:公司簡介
- Amazon
- Bosch
- Dyson
- Ecobee
- Honeywell
- iRobot
- LG
- Panasonic
- Ring
- Samsung
- Schneider Electric
- Siemens
- Sonos
- Xiaomi
The Global Smart Home Products Market was valued at USD 154.3 Billion in 2024 and is estimated to grow at a CAGR of 9.6% to reach USD 384.9 Billion by 2034.
The market is undergoing rapid transformation as households increasingly embrace connected technologies designed to improve comfort, energy efficiency, and sustainability. A growing trend shaping this sector is the integration of renewable energy systems, particularly solar power, with smart home devices. Government incentives such as the U.S. federal solar tax credit, which provides a 30% rebate on installation, are accelerating the adoption of solar-compatible smart solutions. The shift toward eco-friendly living has prompted manufacturers to design devices that align with global green building standards. Energy-efficient technologies in residential spaces are estimated to reduce energy usage by up to thirty percent, according to the United States Green Building Council. Companies across the market are leveraging cutting-edge materials and artificial intelligence to elevate product performance and functionality. Smart thermostats, intelligent air purifiers, and AI-enabled robotic devices are becoming key components in sustainable smart living, catering to both convenience and environmental responsibility. Growing environmental awareness and advances in automation continue to shape the evolution of smart home technologies globally.
| Market Scope | |
|---|---|
| Start Year | 2024 |
| Forecast Year | 2025-2034 |
| Start Value | $154.3 Billion |
| Forecast Value | $384.9 Billion |
| CAGR | 9.6% |
The smart security and monitoring systems segment generated USD 39.1 Billion in 2024. The surge in demand for home safety solutions and increased IoT integration has fueled this growth. According to the U.S. Department of Energy, the smart home sector is expanding at an annual rate of 20%, largely driven by government initiatives that promote energy conservation and advanced security. Manufacturers are responding by developing intelligent systems that not only enhance safety but also optimize energy consumption. Companies focusing on sustainable and energy-saving security systems are aligning with green home initiatives supported by policy incentives, which is reinforcing adoption across developed regions.
The wireless protocols segment held 84.9% share in 2024. Technologies such as Zigbee, Wi-Fi, and Z-Wave remain the backbone of IoT connectivity in smart homes, offering simplicity, reliability, and flexibility. The widespread adoption of cloud platforms and mobile apps is encouraging consumers to invest in wireless-enabled devices. Wireless systems enable homeowners to control lighting, temperature, and appliances remotely, improving convenience and reducing energy waste. These systems also allow for seamless upgrades and interoperability, matching the growing consumer demand for connected and energy-efficient living environments. The trend toward hassle-free, user-friendly installations continues to drive wireless technology's dominance across the smart home ecosystem.
United States Smart Home Products Market held a 77.2% share in 2024, maintaining a leading position in the region. Strong economic conditions, rising consumer purchasing power, and the growing popularity of home automation systems have solidified the U.S. as a key driver of industry growth. American consumers are increasingly drawn to premium, technologically advanced products that offer enhanced energy management, sustainability, and comfort. The presence of major global brands in the U.S. further strengthens its influence, with companies focusing on innovation, integration, and smart infrastructure development to support the evolving lifestyle needs of consumers.
Key players active in the Global Smart Home Products Market include LG, Amazon, Dyson, Samsung, Honeywell, Google, Bosch, iRobot, Ecobee, Ring, Panasonic, Schneider Electric, Siemens, Sonos, and Xiaomi. To strengthen their presence, leading companies are focusing on innovation, partnerships, and product diversification. Many are expanding their smart ecosystems through AI-driven automation, cloud integration, and compatibility with renewable energy systems. Collaborations with technology providers and green energy firms are enhancing product functionality and sustainability. Companies are also investing in R&D to develop devices with improved energy efficiency and seamless interoperability. Strategic mergers, acquisitions, and expansion into emerging markets help brands capture a larger customer base.
Table of Contents
Chapter 1 Methodology & Scope
- 1.1 Market scope and definition
- 1.2 Research design
- 1.2.1 Research approach
- 1.2.2 Data collection methods
- 1.3 Data mining sources
- 1.3.1 Global
- 1.3.2 Regional
- 1.4 Base estimates and calculations
- 1.4.1 Base year calculation
- 1.4.2 Key trends for market estimation
- 1.5 Primary research and validation
- 1.5.1 Primary sources
- 1.6 Forecast model
- 1.7 Research assumptions and limitations
Chapter 2 Executive Summary
- 2.1 Industry 360° synopsis
- 2.2 Key market trends
- 2.2.1 Regional
- 2.2.2 Product type
- 2.2.3 Connectivity
- 2.2.4 Price range
- 2.2.5 Installation
- 2.2.6 Distribution channel
- 2.3 CXO perspectives: Strategic imperatives
- 2.3.1 Key decision points for industry executives
- 2.3.2 Critical success factors for market players
- 2.4 Future outlook and strategic recommendations
Chapter 3 Industry Insights
- 3.1 Industry ecosystem analysis
- 3.1.1 Supplier landscape
- 3.1.2 Profit margin
- 3.1.3 Value addition at each stage
- 3.1.4 Factor affecting the value chain
- 3.2 Industry impact forces
- 3.2.1 Growth drivers
- 3.2.1.1 Rising demand for energy-efficiency
- 3.2.1.2 IoT and wireless connectivity expansion
- 3.2.1.3 Security and safety concerns
- 3.2.2 Industry pitfalls & challenges
- 3.2.2.1 Data privacy and cybersecurity risks
- 3.2.2.2 High initial costs and fragmented ecosystems
- 3.2.3 Opportunities
- 3.2.3.1 Growth in emerging markets
- 3.2.3.2 Integration with wellness and healthcare
- 3.2.1 Growth drivers
- 3.3 Growth potential analysis
- 3.4 Future market trends
- 3.5 Technology and innovation landscape
- 3.5.1 Current technological trends
- 3.5.2 Emerging technologies
- 3.6 Price trends
- 3.6.1 By region
- 3.6.2 By product type
- 3.7 Regulatory landscape
- 3.7.1 Standards and compliance requirements
- 3.7.2 Regional regulatory frameworks
- 3.7.3 Certification standards
- 3.8 Risk Assessment
- 3.9 Gap Analysis
- 3.10 Porter's analysis
- 3.11 PESTEL analysis
- 3.12 Consumer behaviour analysis
- 3.12.1 Purchasing patterns
- 3.12.2 Preference analysis
- 3.12.3 Regional variations in consumer behaviour
- 3.12.4 Impact of e-commerce on buying decision
Chapter 4 Competitive Landscape, 2024
- 4.1 Introduction
- 4.2 Company market share analysis
- 4.2.1 By region
- 4.2.1.1 North America
- 4.2.1.2 Europe
- 4.2.1.3 Asia Pacific
- 4.2.1.4 Latin America
- 4.2.1.5 Middle East and Africa
- 4.2.1 By region
- 4.3 Company matrix analysis
- 4.4 Competitive analysis of major market players
- 4.5 Competitive positioning matrix
- 4.6 Key developments
- 4.6.1 Mergers & acquisitions
- 4.6.2 Partnerships & collaborations
- 4.6.3 New product launches
- 4.6.4 Expansion plans
Chapter 5 Market Estimates & Forecast, By Product type, 2021-2034 (USD Billion) (Million Units)
- 5.1 Key trends
- 5.2 Smart security & monitoring systems
- 5.2.1 Security cameras
- 5.2.2 Baby monitors
- 5.2.3 Smart door locks
- 5.2.4 Others (smart smoke detectors etc.)
- 5.3 Smart lighting & electrical systems
- 5.3.1 Smart light bulbs
- 5.3.2 Smart light switches
- 5.3.3 Smart light fixtures
- 5.3.4 Others (smart electrical panels etc.)
- 5.4 Smart climate control & HVAC systems
- 5.4.1 Smart thermostats
- 5.4.2 Smart HVAC controllers
- 5.4.3 Smart air purifiers
- 5.4.4 Smart humidifiers & dehumidifiers
- 5.4.5 Others (smart air quality monitors etc.)
- 5.5 Smart entertainment & media systems
- 5.5.1 Smart speakers
- 5.5.2 Smart streaming devices
- 5.5.3 Smart projectors
- 5.5.4 Smart gaming consoles
- 5.5.5 Others (smart VR/AR systems etc.)
- 5.6 Smart kitchen & appliance systems
- 5.6.1 Smart refrigerators
- 5.6.2 Smart ovens & ranges
- 5.6.3 Smart dishwashers
- 5.6.4 Smart coffee makers
- 5.6.5 Others (smart blenders etc.)
- 5.7 Smart laundry & cleaning systems
- 5.7.1 Smart washing machines
- 5.7.2 Smart dryers
- 5.7.3 Smart robotic vacuums
- 5.7.4 Others (smart window cleaners etc.)
- 5.8 Smart outdoor & garden systems
- 5.8.1 Smart sprinkler controllers
- 5.8.2 Smart drip irrigation
- 5.8.3 Smart lawn mowers
- 5.8.4 Others (smart weather stations etc.)
- 5.9 Smart health & wellness system
- 5.9.1 Smart air quality monitors
- 5.9.2 Smart sleep monitors
- 5.9.3 Smart medicine dispensers
- 5.9.4 Others (smart fall detection systems etc.)
- 5.10 Smart energy & utility systems
- 5.10.1 Smart meters
- 5.10.2 Smart solar systems
- 5.10.3 Smart battery storage
- 5.10.4 Others (smart load controllers etc.)
- 5.11 Others (smart connectivity & control systems etc.)
Chapter 6 Market Estimates & Forecast, By Connectivity, 2021-2034 (USD Billion) (Million Units)
- 6.1 Key trends
- 6.2 Wireless protocols
- 6.2.1 ZigBee
- 6.2.2 Wi-Fi
- 6.2.3 Bluetooth
- 6.2.4 Z Wave
- 6.2.5 Others
- 6.3 Wired protocols
- 6.3.1 Ethernet
- 6.3.2 Powerline communication (PLC)
- 6.4 Hybrid.
Chapter 7 Market Estimates & Forecast, By Price, 2021-2034 (USD Billion) (Million Units)
- 7.1 Key trends
- 7.2 Low (below USD 500)
- 7.3 Medium (between USD 500 and USD 1,000)
- 7.4 High (above USD 1,000)
Chapter 8 Market Estimates & Forecast, By Installation, 2021-2034 (USD Billion) (Million Units)
- 8.1 Key trends
- 8.2 New construction
- 8.3 Retrofit
Chapter 9 Market Estimates & Forecast, By Distribution Channel, 2021-2034 (USD Billion) (Million Units)
- 9.1 Key trends
- 9.2 Online
- 9.3 Offline
Chapter 10 Market Estimates & Forecast, By Region, 2021-2034 (USD Billion) (Million Units)
- 10.1 Key trends
- 10.2 North America
- 10.2.1 U.S.
- 10.2.2 Canada
- 10.3 Europe
- 10.3.1 Germany
- 10.3.2 UK
- 10.3.3 France
- 10.3.4 Spain
- 10.3.5 Italy
- 10.4 Asia Pacific
- 10.4.1 China
- 10.4.2 Japan
- 10.4.3 India
- 10.4.4 Australia
- 10.4.5 South Korea
- 10.5 Latin America
- 10.5.1 Brazil
- 10.5.2 Mexico
- 10.5.3 Argentina
- 10.6 Middle East and Africa
- 10.6.1 South Africa
- 10.6.2 Saudi Arabia
- 10.6.3 UAE
Chapter 11 Company Profiles
- 11.1 Amazon
- 11.2 Bosch
- 11.3 Dyson
- 11.4 Ecobee
- 11.5 Google
- 11.6 Honeywell
- 11.7 iRobot
- 11.8 LG
- 11.9 Panasonic
- 11.10 Ring
- 11.11 Samsung
- 11.12 Schneider Electric
- 11.13 Siemens
- 11.14 Sonos
- 11.15 Xiaomi
