


 |
市場調查報告書
商品編碼
1871204
生物可分解食品感測器市場機會、成長促進因素、產業趨勢分析及預測(2025-2034年)Biodegradable Food Sensors Market Opportunity, Growth Drivers, Industry Trend Analysis, and Forecast 2025 - 2034 |
||||||
2024 年全球可生物分解食品感測器市場價值為 2.281 億美元,預計到 2034 年將以 17.8% 的複合年成長率成長至約 12 億美元。
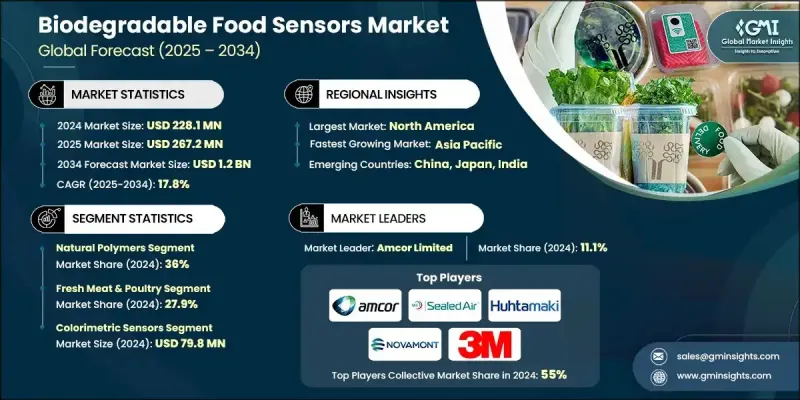
消費者對食源性疾病的日益關注以及對食品品質下降的擔憂,正在加速先進即時新鮮度監測系統的應用。這些可生物分解的感測器能夠持續檢測與食品腐敗相關的揮發性化合物,例如氨、硫化氫和揮發性胺類。消費者對更安全食品的需求不斷成長,推動了此類系統在多個品類中的應用,尤其是在肉類和海鮮等高風險領域。全球為遏制塑膠垃圾和緩解氣候變遷所做的努力也促進了可生物分解包裝的普及,從而推動了市場向可生物分解包裝替代方案的轉型。日益嚴格的監管壓力和永續發展目標促使企業投資於能夠增強食品安全保障的環保感測器技術。環保意識仍然是推動市場成長的主要動力,尤其是在歐洲和北美,這些地區正在日益實施嚴格的永續發展政策。包括美國食品藥物管理局(FDA)的指導意見和歐盟關於智慧包裝的計劃在內的政府支持性法規,為可生物分解感測器應用領域的市場擴張和技術創新創造了有利條件。
| 市場範圍 | |
|---|---|
| 起始年份 | 2024 |
| 預測年份 | 2025-2034 |
| 起始值 | 2.281億美元 |
| 預測值 | 12億美元 |
| 複合年成長率 | 17.8% |
2024年,天然聚合物基材料市佔率達36%。此類別包括殼聚醣、纖維素、澱粉和海藻酸鹽等可生物分解的基材,這些基材均以其優異的生物相容性和環境安全性而聞名。纖維素基感測器憑藉其卓越的機械強度、加工靈活性以及易於從可再生資源中獲取等優勢,在該領域佔據主導地位。市場對性能優異的永續天然材料的日益青睞,是推動該類別快速成長的關鍵因素。
海鮮和水產養殖領域佔據23.2%的市場佔有率,預計2024年市場規模將達到5,290萬美元。這些系統廣泛用於監測魚類新鮮度,其原理是透過檢測硫化氫和氨等腐敗氣體。在一些地區,感測器性能的校準目標與當地食品安全法規一致,從而確保準確檢測腐敗閾值,並提升消費者權益保護。
2024年,美國可生物分解食品感測器市場規模為6,480萬美元,預計2034年將達到3.487億美元。該地區的成長得益於強大的研究基礎設施、政府對永續技術的資助以及對清潔技術創新的積極投資。北美地區在高性能可生物分解感測器技術的突破性進展方面持續保持領先地位,這主要得益於強大的學術合作、創投支持以及有利的永續發展政策。
在全球可生物分解食品感測器市場中,一些知名企業佔據主導地位,包括 Sealed Air Corporation、巴斯夫 (BASF SE)、Vericool、FreshSurety、Amcor Limited、Transparent Path、NatureWorks LLC、Huhtamaki Oyj、Total Corbion PLA、3M Company、Novamont SpA 和 BT9。這些市場領導者正採取多種策略來鞏固其全球地位。各公司大力投資研發,致力於設計符合永續發展要求的高性能、完全可生物分解的感測器材料。他們積極尋求與包裝製造商、研究機構和食品生產商建立策略合作關係,以加速產品創新和市場滲透。許多公司也透過併購和合資等方式拓展業務版圖,進軍新興市場。此外,各企業也高度重視合規性和生態認證,以建立消費者信任。
目錄
第1章:方法論與範圍
第2章:執行概要
第3章:行業洞察
- 產業生態系分析
- 供應商格局
- 利潤率
- 每個階段的價值增加
- 影響價值鏈的因素
- 中斷
- 產業影響因素
- 成長促進因素
- 產業陷阱與挑戰
- 市場機遇
- 成長潛力分析
- 監管環境
- 北美洲
- 歐洲
- 亞太地區
- 拉丁美洲
- 中東和非洲
- 波特的分析
- PESTEL 分析
- 價格趨勢
- 按地區
- 未來市場趨勢
- 技術與創新格局
- 當前技術趨勢
- 新興技術
- 專利格局
- 貿易統計(HS編碼)(註:僅提供重點國家的貿易統計資料)
- 主要進口國
- 主要出口國
- 永續性和環境方面
- 永續實踐
- 減少廢棄物策略
- 生產中的能源效率
- 環保舉措
- 碳足跡考量
第4章:競爭格局
- 介紹
- 公司市佔率分析
- 按地區
- 北美洲
- 歐洲
- 亞太地區
- 拉丁美洲
- 中東和非洲
- 按地區
- 公司矩陣分析
- 主要市場參與者的競爭分析
- 競爭定位矩陣
- 關鍵進展
- 併購
- 合作夥伴關係與合作
- 新產品發布
- 擴張計劃
第5章:市場規模及預測:依材料類型分類,2021-2034年
- 主要趨勢
- 天然聚合物
- 基於殼聚醣的感測器
- 海藻酸鹽體系
- 纖維素及其衍生物
- 澱粉基材料
- 生物基塑膠
- PLA(聚乳酸)體系
- PHA(聚羥基脂肪酸酯)
- PCL(聚己內酯)
- 生物聚乙烯
- 蛋白質基材料
- 基於明膠的感測器
- 膠原蛋白系統
- 大豆蛋白
- 乳清蛋白
- 複合材料
- 天然纖維增強
- 奈米纖維素增強
第6章:市場規模及預測:依應用領域分類,2021-2034年
- 主要趨勢
- 新鮮肉類和家禽
- 變質檢測系統
- 病原體監測
- 溫度濫用指標
- 海鮮和水產養殖
- 新鮮度指標
- 細菌生長監測
- 冷鏈應用
- 新鮮農產品
- 成熟度監測
- 乙烯檢測
- 水分管理
- 乳製品
- pH監測系統
- 細菌污染檢測
- 延長保存期限
- 加工食品
- 包裝完整性監測
- 保存期限指標
第7章:市場規模及預測:依感測器技術類型分類,2021-2034年
- 主要趨勢
- 比色感應器
- 電化學感測器
- 光學感測器
- 氣體感測器
- 生物感測器
- 其他
第8章:市場規模及預測:依地區分類,2021-2034年
- 主要趨勢
- 北美洲
- 美國
- 加拿大
- 歐洲
- 英國
- 德國
- 法國
- 義大利
- 西班牙
- 歐洲其他地區
- 亞太地區
- 中國
- 印度
- 日本
- 韓國
- 澳洲
- 亞太其他地區
- 拉丁美洲
- 巴西
- 墨西哥
- 阿根廷
- 拉丁美洲其他地區
- 中東和非洲
- 南非
- 沙烏地阿拉伯
- 阿拉伯聯合大公國
- 中東和非洲其他地區
第9章:公司簡介
- Amcor Limited
- Sealed Air Corporation
- Huhtamaki
- 3M Company
- NatureWorks
- Novamont
- Total Corbion
- BASF
- Transparent Path
- Vericool
- FreshSurety
- BT9
The Global Biodegradable Food Sensors Market was valued at USD 228.1 million in 2024 and is estimated to grow at a CAGR of 17.8% to reach around USD 1.2 Billion by 2034.
Growing consumer awareness of foodborne illnesses and concerns about quality degradation are accelerating the use of advanced real-time freshness monitoring systems. These biodegradable sensors enable continuous detection of volatile compounds linked with spoilage, such as ammonia, hydrogen sulfide, and volatile amines. Rising demand for safer food products is propelling adoption across multiple categories, particularly in high-risk areas like meat and seafood. The market also benefits from global efforts to curb plastic waste and mitigate climate change, encouraging the transition to biodegradable packaging alternatives. Heightened regulatory pressures and sustainability goals are motivating companies to invest in eco-friendly sensor technologies that enhance food safety assurance. Environmental awareness continues to be a major growth driver, particularly across Europe and North America, where stringent sustainability policies are increasingly being implemented. Supportive government regulations, including guidance from the FDA and the European Union's initiatives on smart packaging, are creating favorable conditions for market expansion and technological innovation in biodegradable sensor applications.
| Market Scope | |
|---|---|
| Start Year | 2024 |
| Forecast Year | 2025-2034 |
| Start Value | $228.1 Million |
| Forecast Value | $1.2 Billion |
| CAGR | 17.8% |
The natural polymer-based materials segment held a 36% share in 2024. This category includes biodegradable substrates such as chitosan, cellulose, starch, and alginate, all known for their excellent biocompatibility and environmental safety. Cellulose-based sensors dominate this segment due to their superior mechanical strength, flexibility in processing, and easy availability from renewable resources. The increasing shift toward sustainable, naturally sourced materials that deliver strong performance is a key factor supporting rapid growth within this category.
The seafood and aquaculture segment held a 23.2% share and reached USD 52.9 million in 2024. These systems are widely used to monitor fish freshness by detecting spoilage gases like hydrogen sulfide and ammonia. In several regions, calibration targets for sensor performance are aligned with local food safety regulations, ensuring accurate detection of spoilage thresholds and improving consumer protection.
United States Biodegradable Food Sensors Market generated USD 64.8 million in 2024 and is projected to reach USD 348.7 million by 2034. The region's growth is supported by strong research infrastructure, government funding for sustainable technologies, and active investment in cleantech innovation. North America continues to be a hub for breakthroughs in high-performance biodegradable sensor technologies, driven by strong academic collaboration, venture capital support, and favorable sustainability policies.
Prominent companies shaping the Global Biodegradable Food Sensors Market include Sealed Air Corporation, BASF SE, Vericool, FreshSurety, Amcor Limited, Transparent Path, NatureWorks LLC, Huhtamaki Oyj, Total Corbion PLA, 3M Company, Novamont S.p.A., and BT9. Leading players in the Biodegradable Food Sensors Market are adopting multiple strategies to strengthen their global presence. Companies are investing heavily in research and development to design high-performance, fully biodegradable sensor materials that align with sustainability mandates. Strategic collaborations and partnerships with packaging manufacturers, research institutions, and food producers are being pursued to accelerate product innovation and market penetration. Many firms are also expanding their geographic reach through mergers, acquisitions, and joint ventures to tap into emerging markets. Furthermore, organizations are emphasizing regulatory compliance and eco-certifications to build consumer trust.
Table of Contents
Chapter 1 Methodology & Scope
- 1.1 Market scope and definition
- 1.2 Research design
- 1.2.1 Research approach
- 1.2.2 Data collection methods
- 1.3 Data mining sources
- 1.3.1 Global
- 1.3.2 Regional/Country
- 1.4 Base estimates and calculations
- 1.4.1 Base year calculation
- 1.4.2 Key trends for market estimation
- 1.5 Primary research and validation
- 1.5.1 Primary sources
- 1.6 Forecast model
- 1.7 Research assumptions and limitations
Chapter 2 Executive Summary
- 2.1 Industry 360° synopsis
- 2.2 Key market trends
- 2.2.1 Material base
- 2.2.2 Application
- 2.2.3 Sensor technology type
- 2.3 TAM analysis, 2025-2034
- 2.4 CXO perspectives: Strategic imperatives
- 2.4.1 Executive decision points
- 2.4.2 Critical success factors
- 2.5 Outlook and strategic recommendations
Chapter 3 Industry Insights
- 3.1 Industry ecosystem analysis
- 3.1.1 Supplier landscape
- 3.1.2 Profit margin
- 3.1.3 Value addition at each stage
- 3.1.4 Factor affecting the value chain
- 3.1.5 Disruptions
- 3.2 Industry impact forces
- 3.2.1 Growth drivers
- 3.2.2 Industry pitfalls and challenges
- 3.2.3 Market opportunities
- 3.3 Growth potential analysis
- 3.4 Regulatory landscape
- 3.4.1 North America
- 3.4.2 Europe
- 3.4.3 Asia Pacific
- 3.4.4 Latin America
- 3.4.5 Middle East & Africa
- 3.5 Porter's analysis
- 3.6 PESTEL analysis
- 3.6.1 Technology and innovation landscape
- 3.6.2 Current technological trends
- 3.6.3 Emerging technologies
- 3.7 Price trends
- 3.7.1 By region
- 3.8 Future market trends
- 3.9 Technology and innovation landscape
- 3.9.1 Current technological trends
- 3.9.2 Emerging technologies
- 3.10 Patent landscape
- 3.11 Trade statistics (HS code) (Note: the trade statistics will be provided for key countries only)
- 3.11.1 Major importing countries
- 3.11.2 Major exporting countries
- 3.12 Sustainability and environmental aspects
- 3.12.1 Sustainable practices
- 3.12.2 Waste reduction strategies
- 3.12.3 Energy efficiency in production
- 3.12.4 Eco-friendly initiatives
- 3.13 Carbon footprint considerations
Chapter 4 Competitive Landscape, 2024
- 4.1 Introduction
- 4.2 Company market share analysis
- 4.2.1 By region
- 4.2.1.1 North America
- 4.2.1.2 Europe
- 4.2.1.3 Asia Pacific
- 4.2.1.4 Latin America
- 4.2.1.5 Middle East & Africa
- 4.2.1 By region
- 4.3 Company matrix analysis
- 4.4 Competitive analysis of major market players
- 4.5 Competitive positioning matrix
- 4.6 Key developments
- 4.6.1 Mergers & acquisitions
- 4.6.2 Partnerships & collaborations
- 4.6.3 New product launches
- 4.6.4 Expansion plans
Chapter 5 Market Size and Forecast, By Material Base, 2021-2034 (USD Million) (Kilo Tons)
- 5.1 Key trends
- 5.2 Natural polymers
- 5.2.1 Chitosan-based sensors
- 5.2.2 Alginate systems
- 5.2.3 Cellulose & derivatives
- 5.2.4 Starch-based materials
- 5.3 Bio-based plastics
- 5.3.1 PLA (polylactic acid) systems
- 5.3.2 PHA (polyhydroxyalkanoates)
- 5.3.3 PCL (polycaprolactone)
- 5.3.4 Bio-polyethylene
- 5.4 Protein-based materials
- 5.4.1 Gelatin-based sensors
- 5.4.2 Collagen systems
- 5.4.3 Soy protein
- 5.4.4 Whey protein
- 5.5 Composite materials
- 5.5.1 Natural fiber reinforced
- 5.5.2 Nanocellulose enhanced
Chapter 6 Market Size and Forecast, By Application, 2021-2034 (USD Million) (Kilo Tons)
- 6.1 Key trends
- 6.2 Fresh meat & poultry
- 6.2.1 Spoilage detection systems
- 6.2.2 Pathogen monitoring
- 6.2.3 Temperature abuse indicators
- 6.3 Seafood & aquaculture
- 6.3.1 Freshness indicators
- 6.3.2 Bacterial growth monitoring
- 6.3.3 Cold chain applications
- 6.4 Fresh produce
- 6.4.1 Ripeness monitoring
- 6.4.2 Ethylene detection
- 6.4.3 Moisture management
- 6.5 Dairy products
- 6.5.1 pH monitoring systems
- 6.5.2 Bacterial contamination detection
- 6.5.3 Shelf-life extension
- 6.6 Processed foods
- 6.6.1 Package integrity monitoring
- 6.6.2 Shelf-life indicators
Chapter 7 Market Size and Forecast, By Sensor Technology Type, 2021-2034 (USD Million) (Kilo Tons)
- 7.1 Key trends
- 7.2 Colorimetric sensors
- 7.3 Electrochemical sensors
- 7.4 Optical sensors
- 7.5 Gas sensors
- 7.6 Biosensors
- 7.7 Others
Chapter 8 Market Size and Forecast, By Region, 2021-2034 (USD Million) (Kilo Tons)
- 8.1 Key trends
- 8.2 North America
- 8.2.1 U.S.
- 8.2.2 Canada
- 8.3 Europe
- 8.3.1 UK
- 8.3.2 Germany
- 8.3.3 France
- 8.3.4 Italy
- 8.3.5 Spain
- 8.3.6 Rest of Europe
- 8.4 Asia Pacific
- 8.4.1 China
- 8.4.2 India
- 8.4.3 Japan
- 8.4.4 South Korea
- 8.4.5 Australia
- 8.4.6 Rest of Asia Pacific
- 8.5 Latin America
- 8.5.1 Brazil
- 8.5.2 Mexico
- 8.5.3 Argentina
- 8.5.4 Rest of Latin America
- 8.6 Middle East & Africa
- 8.6.1 South Africa
- 8.6.2 Saudi Arabia
- 8.6.3 UAE
- 8.6.4 Rest of Middle East & Africa
Chapter 9 Company Profiles
- 9.1 Amcor Limited
- 9.2 Sealed Air Corporation
- 9.3 Huhtamaki
- 9.4 3M Company
- 9.5 NatureWorks
- 9.6 Novamont
- 9.7 Total Corbion
- 9.8 BASF
- 9.9 Transparent Path
- 9.10 Vericool
- 9.11 FreshSurety
- 9.12 BT9
 生質塑膠包裝市場:2026-2032年全球市場按產品類型、材料類型、應用和製造流程分類的預測
 竹製包裝市場規模、佔有率、成長及全球產業分析:按類型、應用和區域分類,預測2026-2034年
 生物分解感測器市場分析及預測(至2035年):按類型、產品類型、技術、組件、應用、材料類型、最終用戶、功能和安裝類型分類
 用於生質塑膠的生物塑膠市場:市場規模-按地區、應用和預測至2034年零廢棄生物發酵市場分析及預測(至2035年):依類型、產品、服務、技術、應用、製程、最終用戶、材料類型、設備及解決方案分類可生物分解紙和塑膠包裝市場:規模、佔有率、成長和全球產業分析:按類型、應用和地區分類,並預測至2026-2034年生質塑膠包裝市場規模、佔有率、成長及全球產業分析:按類型和應用分類,區域洞察及2026-2034年預測全球可生物分解紙和塑膠包裝市場規模、佔有率、趨勢和成長分析報告(2026-2034年)軟性包裝中的可生物分解生質塑膠:市場規模、平均價格和預測(2018-2034 年)
 2026年全球可生物分解紙和塑膠包裝市場報告