


 |
市場調查報告書
商品編碼
1871155
綠色氨生產市場機會、成長促進因素、產業趨勢分析及預測(2025-2034年)Green Ammonia Production Market Opportunity, Growth Drivers, Industry Trend Analysis, and Forecast 2025 - 2034 |
||||||
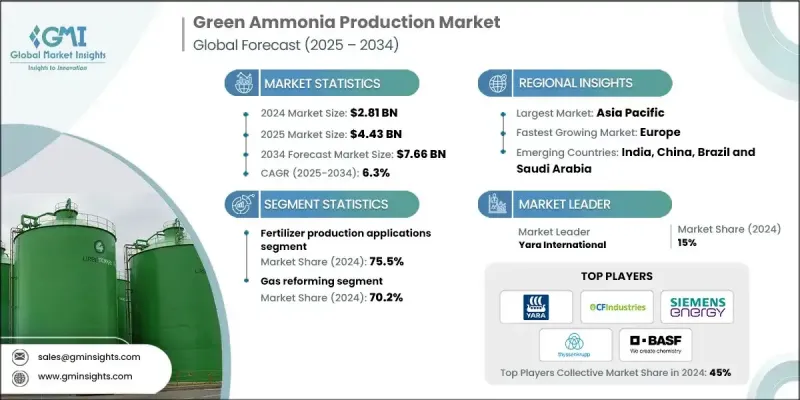
2024 年全球綠色氨生產市場價值為 28.1 億美元,預計到 2034 年將以 6.3% 的複合年成長率成長至 76.6 億美元。
由於綠色氨作為一種新一代能源載體,兼具高效能、低成本生產和多功能性等優點,市場正蓬勃發展。綠色氨技術利用鈣鈦礦結構化合物作為吸光層,能夠有效率地將太陽能轉換為電能。低溫溶液法製備工藝,例如旋塗、噴墨印刷和刮塗,顯著降低了生產成本。綠色氨能夠實現再生能源的長距離儲存和輸送,並正成為再生能源併網、發電和電網穩定的關鍵組成部分。擁有豐富再生資源的國家正在大力投資綠色氨出口項目,以供應再生能源能力有限的地區,使綠色氨成為全球貿易的低碳商品,並促進國際清潔能源合作和經濟發展。
| 市場範圍 | |
|---|---|
| 起始年份 | 2024 |
| 預測年份 | 2025-2034 |
| 起始值 | 28.1億美元 |
| 預測值 | 76.6億美元 |
| 複合年成長率 | 6.3% |
預計到2034年,製藥業將以10.5%的複合年成長率成長,這主要得益於該產業對永續化學原料和特種化學品生產日益成長的需求。工業脫碳措施正促使製造商採用更環保的替代方案,從而創造了對經認證的綠色氨的高階需求。
2024年,天然氣重整技術市佔率達到70.2%,預計2034年將以5.5%的複合年成長率成長。該製程受益於現有的天然氣基礎設施、二氧化碳儲存以及相比完全可再生氫能系統更低的資本成本。天然氣重整技術使生產商能夠在利用現有技術的同時減少排放,因此非常適合再生電力成本高或間歇性強的地區。碳定價、政策誘因以及氨作為一種低碳可交易商品的出現,進一步加速了該技術的普及應用。
預計到2024年,美國綠色氨生產市場規模將達到4.584億美元,主要得益於政府的大力投入和策略性的研究計畫。美國擁有豐富的風能和太陽能資源,這使得其能夠以經濟高效的方式生產綠色氫氣,用於合成氨。此外,人們對永續農業實踐的日益重視,也進一步推動了綠色氨作為傳統肥料更清潔替代品的應用。
綠色氨生產市場的主要參與者包括Fertiberia、Enaex、Orsted、IFFCO、Nutrien、CF Industries Holdings Inc.、AM Green Ammonia、Statkraft、Talus Renewables、ACME Group、PT Pupuk Sriwidjaja Palembang (Pusri)、Scatec、BASF、ENGIE Pupuk Sriwidjaja Palembang (Pusri)、Scatec、BASF、ENGIE、CSBP、Grok Palembang、Gusri這些公司正致力於技術創新、策略合作和產能擴張,以鞏固其市場地位。他們投資於低成本、高效率的生產方法以及可擴展的再生能源氨合成技術。與全球能源和化學企業的合作正在加速出口能力和市場滲透。此外,各企業也優先考慮認證和永續標準,以獲得綠色氨的溢價。
目錄
第1章:方法論與範圍
第2章:執行概要
第3章:行業洞察
- 產業生態系統
- 監管環境
- 綠色氨生產廠
- 操作
- 計劃
- 產業影響因素
- 成長促進因素
- 產業陷阱與挑戰
- 成長潛力分析
- 波特的分析
- PESTEL 分析
第4章:競爭格局
- 介紹
- 按地區分類的公司市佔率分析
- 北美洲
- 歐洲
- 亞太地區
- 世界其他地區
- 戰略儀錶板
- 策略舉措
- 公司標竿分析
- 創新與技術格局
第5章:市場規模及預測:依製程分類,2021-2034年
- 主要趨勢
- 氣體重整
- 水重整
- 其他
第6章:市場規模及預測:依最終用途分類,2021-2034年
- 主要趨勢
- 化肥生產
- 儲能
- 電子燃料
- 製藥
- 其他
第7章:市場規模及預測:依地區分類,2021-2034年
- 主要趨勢
- 北美洲
- 美國
- 加拿大
- 歐洲
- 德國
- 法國
- 義大利
- 英國
- 波蘭
- 亞太地區
- 中國
- 印度
- 日本
- 韓國
- 澳洲
- 世界其他地區
第8章:公司簡介
- ACME Group
- AM Green Ammonia
- BASF
- CSBP Limited
- CF Industries Holdings Inc.
- Envision Energy
- ENGIE
- Enaex
- First Ammonia
- Fertiberia
- Group DF
- IFFCO
- LSB Industries
- Nutrien
- Ørsted
- PT Pupuk Sriwidjaja Palembang (Pusri)
- Statkraft
- Scatec
- Talus Renewables
- Yara International
- Industry Segmentation
The Global Green Ammonia Production Market was valued at USD 2.81 Billion in 2024 and is estimated to grow at a CAGR of 6.3% to reach USD 7.66 Billion by 2034.
The market is gaining momentum due to green ammonia's role as a next-generation energy carrier that combines high efficiency, cost-effective production, and versatility. By using perovskite-structured compounds as light-absorbing layers, green ammonia technologies convert solar energy into electricity efficiently. Low-temperature solution-based fabrication methods, such as spin-coating, inkjet printing, and blade-coating, significantly reduce production costs. Green ammonia enables the storage and transport of renewable energy over long distances and is becoming a key component in renewable integration, power generation, and grid stabilization. Countries with abundant renewable resources are investing heavily in green ammonia export projects to supply regions with limited renewable capacity, transforming green ammonia into a globally traded, low-carbon commodity and fostering international clean energy collaboration and economic development.
| Market Scope | |
|---|---|
| Start Year | 2024 |
| Forecast Year | 2025-2034 |
| Start Value | $2.81 Billion |
| Forecast Value | $7.66 Billion |
| CAGR | 6.3% |
The pharmaceuticals segment is anticipated to grow at a CAGR of 10.5% through 2034, driven by the industry's growing interest in sustainable chemical feedstocks and specialty chemical production. Industrial decarbonization efforts are prompting manufacturers to adopt greener alternatives, creating premium demand for certified green ammonia.
The gas reforming segment held a 70.2% share in 2024 and is expected to grow at a 5.5% CAGR through 2034. This process benefits from existing natural gas infrastructure, access to CO2 storage, and lower capital costs compared to fully renewable hydrogen systems. Gas reforming allows producers to cut emissions while leveraging established technology, making it ideal for regions with high or intermittent renewable electricity costs. Carbon pricing, policy incentives, and the emergence of ammonia as a low-carbon tradeable commodity further accelerate adoption.
U.S. Green Ammonia Production Market was valued at USD 458.4 million by 2024, supported by strong government funding and strategic research initiatives. The U.S. benefits from abundant wind and solar resources, enabling cost-effective green hydrogen production for ammonia synthesis. Growing emphasis on sustainable agricultural practices is further driving the adoption of green ammonia as a cleaner alternative to conventional fertilizers.
Key players in the Green Ammonia Production Market include Fertiberia, Enaex, Orsted, IFFCO, Nutrien, CF Industries Holdings Inc., AM Green Ammonia, Statkraft, Talus Renewables, ACME Group, PT Pupuk Sriwidjaja Palembang (Pusri), Scatec, BASF, ENGIE, CSBP Limited, Group DF, Envision Energy, Yara International, and LSB Industries. Companies in the Green Ammonia Production Market are focusing on technological innovation, strategic partnerships, and capacity expansion to strengthen their market presence. Firms are investing in low-cost, high-efficiency production methods and scalable renewable energy integration for ammonia synthesis. Collaborations with global energy and chemical companies are accelerating export capabilities and market penetration. Players are also prioritizing certification and sustainability standards to command premium pricing for green ammonia.
Table of Contents
Chapter 1 Methodology & Scope
- 1.1 Research design
- 1.1.1 Research approach
- 1.1.2 Data collection methods
- 1.1.3 Base estimates and calculations
- 1.1.4 Base year calculation
- 1.1.5 Key trends for market estimates
- 1.2 Forecast model
- 1.3 Primary research & validation
- 1.3.1 Primary sources
- 1.4 Data mining sources
- 1.5 Market definitions
Chapter 2 Executive Summary
- 2.1 Industry 3600 synopsis, 2021 - 2034
- 2.2 Business trends
- 2.3 Process trends
- 2.4 End Use trends
- 2.5 Regional trends
Chapter 3 Industry Insights
- 3.1 Industry ecosystem
- 3.2 Regulatory landscape
- 3.3 Green ammonia production plants
- 3.3.1 Operational
- 3.3.2 Planned
- 3.4 Industry impact forces
- 3.4.1 Growth drivers
- 3.4.2 Industry pitfalls & challenges
- 3.5 Growth potential analysis
- 3.6 Porter's analysis
- 3.6.1 Bargaining power of suppliers
- 3.6.2 Bargaining power of buyers
- 3.6.3 Threat of new entrants
- 3.6.4 Threat of substitutes
- 3.7 PESTEL analysis
Chapter 4 Competitive landscape, 2025
- 4.1 Introduction
- 4.2 Company market share analysis, by region, 2024
- 4.2.1 North America
- 4.2.2 Europe
- 4.2.3 Asia Pacific
- 4.2.4 Rest of world
- 4.3 Strategic dashboard
- 4.4 Strategic initiatives
- 4.5 Company benchmarking
- 4.6 Innovation & technology landscape
Chapter 5 Market Size and Forecast, By Process, 2021 - 2034 (USD Million & Million Tonnes)
- 5.1 Key trends
- 5.2 Gas reforming
- 5.3 Water reforming
- 5.4 Others
Chapter 6 Market Size and Forecast, By End Use, 2021 - 2034 (USD Million & Million Tonnes)
- 6.1 Key trends
- 6.2 Fertilizer production
- 6.3 Energy storage
- 6.4 E-fuel
- 6.5 Pharmaceuticals
- 6.6 Others
Chapter 7 Market Size and Forecast, By Region, 2021 - 2034 (USD Million & Million Tonnes)
- 7.1 Key trends
- 7.2 North America
- 7.2.1 U.S.
- 7.2.2 Canada
- 7.3 Europe
- 7.3.1 Germany
- 7.3.2 France
- 7.3.3 Italy
- 7.3.4 UK
- 7.3.5 Poland
- 7.4 Asia Pacific
- 7.4.1 China
- 7.4.2 India
- 7.4.3 Japan
- 7.4.4 South Korea
- 7.4.5 Australia
- 7.5 Rest of World
Chapter 8 Company Profiles
- 8.1 ACME Group
- 8.2 AM Green Ammonia
- 8.3 BASF
- 8.4 CSBP Limited
- 8.5 CF Industries Holdings Inc.
- 8.6 Envision Energy
- 8.7 ENGIE
- 8.8 Enaex
- 8.9 First Ammonia
- 8.10 Fertiberia
- 8.11 Group DF
- 8.12 IFFCO
- 8.13 LSB Industries
- 8.14 Nutrien
- 8.15 Ørsted
- 8.16 PT Pupuk Sriwidjaja Palembang (Pusri)
- 8.17 Statkraft
- 8.18 Scatec
- 8.19 Talus Renewables
- 8.20 Yara International
- 8.21 Industry Segmentation


