

 |
市場調查報告書
商品編碼
1871150
鈣鈦礦量子點顯示應用市場機會、成長促進因素、產業趨勢分析及預測(2025-2034年)Perovskite Quantum Dots for Display Applications Market Opportunity, Growth Drivers, Industry Trend Analysis, and Forecast 2025 - 2034 |
||||||
2024 年全球鈣鈦礦量子點顯示應用市場價值為 2.471 億美元,預計到 2034 年將以 25% 的複合年成長率成長至 23 億美元。
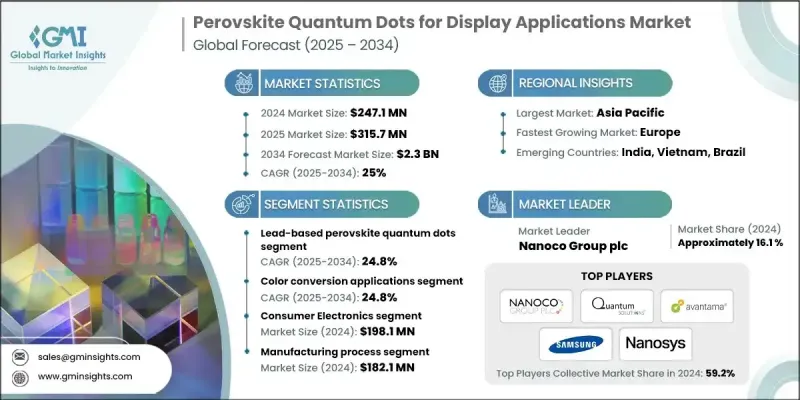
專業和消費性電子產品對廣色域和節能顯示器的需求不斷成長,推動了鈣鈦礦量子點(PQD)技術的快速發展。 PQD 具有高亮度、卓越的色彩精準度和低功耗等優點,是液晶顯示器(LCD)色彩轉換膜和新一代電致發光裝置的理想選擇。隨著製造商開發環保替代品以符合嚴格的法規(尤其是在歐洲),向無鉛 PQD 的過渡正在重塑整個產業。這些先進材料的光致發光量子產率(PLQY)接近 99%,在提高顯示器亮度和效率的同時,確保符合全球安全標準。向永續材料的轉變正在為高階消費性電子產品、穿戴式裝置和醫用顯示器帶來新的機會。隨著 PQD 技術的不斷發展,其鮮豔的色彩表現、卓越的能源效率和環保的特性使其成為全球下一代顯示器創新發展的關鍵推動力。
| 市場範圍 | |
|---|---|
| 起始年份 | 2024 |
| 預測年份 | 2025-2034 |
| 起始值 | 2.471億美元 |
| 預測值 | 23億美元 |
| 複合年成長率 | 25% |
2024年,鉛基鈣鈦礦量子點市場規模達到1.92億美元,預計2034年將維持24.8%的複合年成長率。鉛基和無鉛鈣鈦礦量子點均呈現成長勢頭,其中鉛基量子點憑藉其卓越的色彩純度和發光效率,在目前的商業化過程中佔據主導地位。然而,日益成長的環境合規性需求以及符合RoHS標準的替代材料的推出,正在加速錫基和鉍基材料的應用。在實現最佳性能和滿足監管標準之間取得平衡,並持續推動材料創新,全球供應商正調整研發路線圖,以滿足顯示器製造商的技術需求。
2024年,色彩轉換應用領域的市場規模為1.673億美元,預計2025年至2034年間將以24.8%的複合年成長率成長。採用鈣鈦礦量子點的色彩轉換膜因其卓越的光學效率和在顯示器整合方面的靈活性而廣泛應用。隨著製造商在追求永續發展的同時又不犧牲視覺質量,無鉛材料與含鉛材料一樣日益受到重視。符合環保標準的高性能鈣鈦礦量子點的持續研發,反映了原始設備製造商對可靠、可擴展的先進顯示系統解決方案日益成長的需求。
2024年,中國鈣鈦礦量子點顯示應用市場規模達7,440萬美元,預計2034年將以25.2%的複合年成長率成長。中國仍然是全球鈣鈦礦量子點創新和大規模顯示器製造的中心,這得益於強勁的國內需求和對先進顯示技術的巨額投資。中國在顯示面板生產領域的領先地位正在推動鈣鈦礦量子點加速整合到商用顯示器中,鞏固其在這一新興市場的主導地位。
鈣鈦礦量子點顯示應用市場的主要參與者包括Nanoco Group plc、Quantum Solutions、Avantama AG、三星電子和Nanosys Inc.。為了鞏固市場地位,這些領導企業正優先考慮永續創新和策略合作。他們大力投資研發,以開發無鉛、高效、穩定性更高且相容性更強的鈣鈦礦量子點,以實現大規模生產。與顯示器製造商和材料供應商的合作有助於加速商業化進程並確保符合監管要求。此外,各公司也正在擴大產能,以滿足全球對環保顯示技術日益成長的需求。
目錄
第1章:方法論
- 市場範圍和定義
- 研究設計
- 研究方法
- 資料收集方法
- 資料探勘來源
- 全球的
- 地區/國家
- 基準估算和計算
- 基準年計算
- 市場估算的關鍵趨勢
- 初步研究和驗證
- 原始資料
- 預測模型
- 研究假設和局限性
第2章:執行概要
第3章:行業洞察
- 產業生態系分析
- 供應商格局
- 利潤率
- 每個階段的價值增加
- 影響價值鏈的因素
- 中斷
- 產業影響因素
- 成長促進因素
- 產業陷阱與挑戰
- 市場機遇
- 成長潛力分析
- 監管環境
- 北美洲
- 歐洲
- 亞太地區
- 拉丁美洲
- 中東和非洲
- 波特的分析
- PESTEL 分析
- 價格趨勢
- 按地區
- 未來市場趨勢
- 專利格局
- 貿易統計(HS編碼)(註:僅提供重點國家的貿易統計資料)
- 主要進口國
- 主要出口國
- 永續性和環境方面
- 永續實踐
- 減少廢棄物策略
- 生產中的能源效率
- 環保舉措
- 碳足跡考量
第4章:競爭格局
- 介紹
- 公司市佔率分析
- 按地區
- 北美洲
- 歐洲
- 亞太地區
- 拉丁美洲
- MEA
- 按地區
- 公司矩陣分析
- 主要市場參與者的競爭分析
- 競爭定位矩陣
- 關鍵進展
- 併購
- 合作夥伴關係與合作
- 新產品發布
- 擴張計劃
第5章:市場估計與預測:依技術組成分類,2025-2034年
- 主要趨勢
- 鉛基鈣鈦礦量子點
- 全無機銫鉛鹵化物(CsPbX3)
- 有機-無機雜化鈣鈦礦
- 無鉛鈣鈦礦量子點
- 鉍基鈣鈦礦
- 其他無鉛替代品
第6章:市場估算與預測:依顯示技術整合度分類,2025-2034年
- 主要趨勢
- 顏色轉換應用
- LCD背光增強
- 微型LED顏色轉換
- OLED色彩增強
- 電致發光應用
第7章:市場估算與預測:依最終用途應用分類,2025-2034年
- 主要趨勢
- 消費性電子產品
- 電視顯示器
- 智慧型手機和行動顯示器
- 顯示器和IT顯示器
- 新興高價值應用
- 擴增實境/虛擬實境(AR/VR)
- 汽車顯示器
- 軟性穿戴顯示器
第8章:市場估算與預測:依製造流程分類,2025-2034年
- 合成方法
- 熱注入膠體合成
- 室溫反溶劑法
- 連續流和放大方法
- 模式化和整合技術
- 噴墨列印
- 光刻
- 卷對卷加工
第9章:市場估計與預測:依地區分類,2025-2034年
- 主要趨勢
- 北美洲
- 美國
- 加拿大
- 歐洲
- 德國
- 英國
- 法國
- 義大利
- 西班牙
- 歐洲其他地區
- 亞太地區
- 中國
- 印度
- 日本
- 澳洲
- 韓國
- 亞太其他地區
- 拉丁美洲
- 巴西
- 墨西哥
- 阿根廷
- 拉丁美洲其他地區
- 中東和非洲
- 沙烏地阿拉伯
- 南非
- 阿拉伯聯合大公國
- 中東和非洲其他地區
第10章:公司簡介
- Nanoco Group plc
- Quantum Solutions
- Avantama AG
- Samsung Electronics (SAIT)
- Nanosys Inc.
- QNOVA (formerly Quantum Solutions USA)
- BASF SE
- LG Display
- QustomDot (Spin-off from Ghent University)
- Ossila Ltd.
- Merck KGaA (EMD Performance Materials)
- UbiQD Inc.
The Global Perovskite Quantum Dots for Display Applications Market was valued at USD 247.1 million in 2024 and is estimated to grow at a CAGR of 25% to reach USD 2.3 Billion by 2034.
The rapid expansion is driven by the increasing demand for wide color gamut and energy-efficient displays across professional and consumer electronics. Perovskite quantum dots (PQDs) deliver high brightness, excellent color accuracy, and reduced power consumption, making them ideal for LCD color-conversion films and next-generation electroluminescent devices. The ongoing transition toward lead-free PQDs is reshaping the industry as manufacturers develop environmentally friendly alternatives to comply with stringent regulations, particularly in Europe. These advanced materials achieve photoluminescence quantum yields (PLQY) close to 99%, enhancing display brightness and efficiency while ensuring compliance with global safety standards. The shift toward sustainable materials is unlocking new opportunities in high-end consumer electronics, wearable devices, and medical-grade displays. As PQD technology continues to evolve, the combination of vivid color performance, energy efficiency, and eco-friendly composition positions it as a key enabler of next-generation display innovation worldwide.
| Market Scope | |
|---|---|
| Start Year | 2024 |
| Forecast Year | 2025-2034 |
| Start Value | $247.1 Million |
| Forecast Value | $2.3 Billion |
| CAGR | 25% |
The lead-based perovskite quantum dots segment reached USD 192 million in 2024 and is estimated to record a CAGR of 24.8% through 2034. Both lead-based and lead-free PQDs are gaining traction, with the former dominating current commercialization due to their superior color purity and luminous efficiency. However, the growing focus on environmental compliance and the introduction of RoHS-compatible alternatives are accelerating the adoption of tin- and bismuth-based materials. The balance between achieving optimal performance and meeting regulatory standards continues to drive material innovation, as global suppliers align R&D roadmaps to match the technological needs of display manufacturers.
The color conversion application segment was valued at USD 167.3 million in 2024 and is projected to grow at a CAGR of 24.8% between 2025 and 2034. Color conversion films using perovskite quantum dots are witnessing widespread adoption due to their superior optical efficiency and flexibility in display integration. Lead-free materials are gaining relevance alongside their lead-based counterparts as manufacturers pursue sustainability without compromising visual quality. The constant development of eco-compliant, high-performance PQDs reflects the growing expectations of original equipment manufacturers seeking reliable, scalable solutions for advanced display systems.
China Perovskite Quantum Dots for Display Applications Market generated USD 74.4 million in 2024 and is expected to grow at a CAGR of 25.2% through 2034. The country remains the global hub for PQD innovation and large-scale display manufacturing, benefiting from strong domestic demand and substantial investment in advanced display technologies. China's leadership in display panel production is fueling accelerated PQD integration into commercial displays, solidifying its dominance in this emerging market.
Key players active in the Perovskite Quantum Dots for Display Applications Market include Nanoco Group plc, Quantum Solutions, Avantama AG, Samsung Electronics, and Nanosys Inc. To strengthen their foothold, leading companies in the perovskite quantum dots for display applications market are prioritizing sustainable innovation and strategic collaboration. They are investing heavily in R&D to develop lead-free, high-efficiency PQDs with improved stability and compatibility for mass production. Partnerships with display manufacturers and material suppliers are helping accelerate commercialization and ensure regulatory compliance. Companies are also expanding production capacities to meet the rising global demand for eco-friendly display technologies.
Table of Contents
Chapter 1 Methodology
- 1.1 Market scope and definition
- 1.2 Research design
- 1.2.1 Research approach
- 1.2.2 Data collection methods
- 1.3 Data mining sources
- 1.3.1 Global
- 1.3.2 Regional/Country
- 1.4 Base estimates and calculations
- 1.4.1 Base year calculation
- 1.4.2 Key trends for market estimation
- 1.5 Primary research and validation
- 1.5.1 Primary sources
- 1.6 Forecast model
- 1.7 Research assumptions and limitations
Chapter 2 Executive Summary
- 2.1 Industry 360° synopsis
- 2.2 Key market trends
- 2.2.1 Regional
- 2.2.2 Technology Composition
- 2.2.3 Display Technology Integration
- 2.2.4 End Use Application
- 2.3 TAM Analysis, 2025-2034
- 2.4 CXO perspectives: Strategic imperatives
- 2.4.1 Executive decision points
- 2.4.2 Critical success factors
- 2.5 Future Outlook and Strategic Recommendations
Chapter 3 Industry Insights
- 3.1 Industry ecosystem analysis
- 3.1.1 Supplier Landscape
- 3.1.2 Profit Margin
- 3.1.3 Value addition at each stage
- 3.1.4 Factor affecting the value chain
- 3.1.5 Disruptions
- 3.2 Industry impact forces
- 3.2.1 Growth drivers
- 3.2.2 Industry pitfalls and challenges
- 3.2.3 Market opportunities
- 3.3 Growth potential analysis
- 3.4 Regulatory landscape
- 3.4.1 North America
- 3.4.2 Europe
- 3.4.3 Asia Pacific
- 3.4.4 Latin America
- 3.4.5 Middle East & Africa
- 3.5 Porter's analysis
- 3.6 PESTEL analysis
- 3.6.1 Technology and Innovation landscape
- 3.6.2 Current technological trends
- 3.6.3 Emerging technologies
- 3.7 Price trends
- 3.7.1 By region
- 3.8 Future market trends
- 3.9 Patent Landscape
- 3.10 Trade statistics (HS code) (Note: the trade statistics will be provided for key countries only)
- 3.10.1 Major importing countries
- 3.10.2 Major exporting countries
- 3.11 Sustainability and Environmental Aspects
- 3.11.1 Sustainable Practices
- 3.11.2 Waste Reduction Strategies
- 3.11.3 Energy Efficiency in Production
- 3.11.4 Eco-friendly Initiatives
- 3.12 Carbon Footprint Considerations
Chapter 4 Competitive Landscape, 2024
- 4.1 Introduction
- 4.2 Company market share analysis
- 4.2.1 By region
- 4.2.1.1 North America
- 4.2.1.2 Europe
- 4.2.1.3 Asia Pacific
- 4.2.1.4 LATAM
- 4.2.1.5 MEA
- 4.2.1 By region
- 4.3 Company matrix analysis
- 4.4 Competitive analysis of major market players
- 4.5 Competitive positioning matrix
- 4.6 Key developments
- 4.6.1 Mergers & acquisitions
- 4.6.2 Partnerships & collaborations
- 4.6.3 New Product Launches
- 4.6.4 Expansion Plans
Chapter 5 Market Estimates and Forecast, By Technology Composition, 2025 - 2034 (USD Million)
- 5.1 Key trends
- 5.2 Lead-Based Perovskite Quantum Dots
- 5.2.1 All-Inorganic Cesium Lead Halide (CsPbX3)
- 5.2.2 Hybrid Organic-Inorganic Perovskites
- 5.3 Lead-Free Perovskite Quantum Dots
- 5.3.1 Bismuth-Based Perovskites
- 5.3.2 Other Lead-Free Alternatives
Chapter 6 Market Estimates and Forecast, By Display Technology Integration, 2025 - 2034 (USD Million)
- 6.1 Key trends
- 6.2 Color Conversion Applications
- 6.2.1 LCD Backlight Enhancement
- 6.2.2 Micro-LED Color Conversion
- 6.2.3 OLED Color Enhancement
- 6.3 Electroluminescent Applications
Chapter 7 Market Estimates and Forecast, By End Use Application, 2025 - 2034 (USD Million)
- 7.1 Key trends
- 7.2 Consumer Electronics
- 7.2.1 Television Displays
- 7.2.2 Smartphone and Mobile Displays
- 7.2.3 Monitor and IT Displays
- 7.3 Emerging High-Value Applications
- 7.3.1 Augmented Reality/Virtual Reality (AR/VR)
- 7.3.2 Automotive Displays
- 7.3.3 Flexible and Wearable Displays
Chapter 8 Market Estimates and Forecast, By Manufacturing Process, 2025 - 2034 (USD Million)
- 8.1 Synthesis Methods
- 8.1.1 Hot-Injection Colloidal Synthesis
- 8.1.2 Room-Temperature Anti-Solvent Methods
- 8.1.3 Continuous Flow and Scale-Up Methods
- 8.2 Patterning and Integration Technologies
- 8.2.1 Inkjet Printing
- 8.2.2 Photolithography
- 8.2.3 Roll-to-Roll Processing
Chapter 9 Market Estimates and Forecast, By Region, 2025 - 2034 (USD Million)
- 9.1 Key trends
- 9.2 North America
- 9.2.1 U.S.
- 9.2.2 Canada
- 9.3 Europe
- 9.3.1 Germany
- 9.3.2 UK
- 9.3.3 France
- 9.3.4 Italy
- 9.3.5 Spain
- 9.3.6 Rest of Europe
- 9.4 Asia Pacific
- 9.4.1 China
- 9.4.2 India
- 9.4.3 Japan
- 9.4.4 Australia
- 9.4.5 South Korea
- 9.4.6 Rest of Asia Pacific
- 9.5 Latin America
- 9.5.1 Brazil
- 9.5.2 Mexico
- 9.5.3 Argentina
- 9.5.4 Rest of Latin America
- 9.6 Middle East & Africa
- 9.6.1 Saudi Arabia
- 9.6.2 South Africa
- 9.6.3 UAE
- 9.6.4 Rest of Middle East & Africa
Chapter 10 Company Profiles
- 10.1 Nanoco Group plc
- 10.2 Quantum Solutions
- 10.3 Avantama AG
- 10.4 Samsung Electronics (SAIT)
- 10.5 Nanosys Inc.
- 10.6 QNOVA (formerly Quantum Solutions USA)
- 10.7 BASF SE
- 10.8 LG Display
- 10.9 QustomDot (Spin-off from Ghent University)
- 10.10 Ossila Ltd.
- 10.11 Merck KGaA (EMD Performance Materials)
- 10.12 UbiQD Inc.
 銦鎵鋅氧化物市場:2026-2032年全球市場預測(按裝置類型、沉積技術、基板、厚度、遷移率範圍、應用和最終用途產業分類)下一代顯示材料市場:按材料類型、技術、外形規格和應用分類-2026-2032年全球市場預測
 液晶顯示材料市場預測:至2034年-按材料類型、技術、應用和地區分類的全球分析
 2026年全球超快雷射圖形化顯示器市場報告彩色濾光玻璃市場按類型、厚度、技術和應用分類-2026年至2032年全球預測液晶間隔微球市場依產品類型、間隔尺寸、表面處理、應用、終端用戶產業及通路分類,全球預測(2026-2032年)
 銦鎵鋅氧化物(IGZO):市場佔有率分析、產業趨勢與統計、成長預測(2026-2031)
 採用量子點薄膜的新型顯示器:全球市場佔有率和排名、總收入和需求預測(2025-2031年)銦鎵鋅氧化物(IGZO):全球市場佔有率和排名、總收入和需求預測(2025-2031年)
 透明電極的全球市場