


 |
市場調查報告書
商品編碼
1871127
鈉離子電池化學品市場機會、成長促進因素、產業趨勢分析及預測(2025-2034年)Sodium-Ion Battery Chemicals Market Opportunity, Growth Drivers, Industry Trend Analysis, and Forecast 2025 - 2034 |
||||||
2024 年全球鈉離子電池化學品市場價值為 1.5 億美元,預計到 2034 年將以 55% 的複合年成長率成長至 85 億美元。
鈉離子電池市場的快速成長得益於其成本效益,這主要歸功於儲量豐富的無鈷材料以及最佳化的電解液-正極組合。工業和電網級用戶優先考慮每千瓦時成本、循環壽命和安全性,這使得鈉離子電池在這些領域極具吸引力。由於體積能量的限制,移動出行領域的應用仍持謹慎態度,預計一旦能量密度超過200 Wh/kg,應用範圍將進一步擴大。區域政策也發揮關鍵作用:歐盟強調可回收性和報廢管理,支持高鈉電池技術的發展;而中國「十四五」規劃下的產業戰略則加速了國內試點計畫和材料規模化生產。電網級應用確保了對上游化學品(尤其是電解液和添加劑)的穩定需求,而性能提升、成本降低和正極材料的創新則鞏固了鈉離子電池在工業、電網和特定移動出行領域的市場地位。
| 市場範圍 | |
|---|---|
| 起始年份 | 2024 |
| 預測年份 | 2025-2034 |
| 起始值 | 1.5億美元 |
| 預測值 | 85億美元 |
| 複合年成長率 | 55% |
2024年,正極活性材料市場規模達6,000萬美元。由於在能量密度和循環壽命性能方面發揮關鍵作用,正極活性材料佔據了最大的價值佔有率;負極材料約佔30%,其餘部分為輔助化學品和其他材料。早期鈉離子電池的能量密度約為175 Wh/kg,隨著磷酸釩鈉和NASICON正極技術的進步,預計到2027年,能量密度將超過200 Wh/kg。正極技術的創新是能量密度提升的主要驅動力,而硬碳負極則有助於提高首圈效率和長期容量維持率。
電網級儲能領域佔70%的市場佔有率,預計2024年市場規模將達到1.05億美元。鈉離子電池為再生能源併網和負荷均衡提供了經濟高效且熱安全的解決方案。此外,在低速電動車領域,鈉離子電池的應用也日益普及,因為在這些領域,經濟性和安全性比體積能量密度更為重要。
2024年,北美鈉離子電池化學品市場規模達1,800萬美元。聯邦政府對研發和商業化的資助,以及工業和資料中心應用領域的私人資本投資,是推動市場成長的關鍵因素。美國政府機構的各項措施正將大量資源投入替代化學品的規模化生產。製造項目,尤其是在北卡羅來納州和密西根州的項目,凸顯了工業UPS、電網服務和電信應用領域的早期應用。北美受益於強大的供應商生態系統,而加拿大則利用其國內材料資源和地理優勢。
鈉離子電池化學品市場的主要參與者包括TIAMAT SAS、海納電池科技有限公司、Altris AB、寧德時代(CATL)、法拉第(Reliance旗下)等。各公司致力於推動正負極化學技術的進步,以提高能量密度和循環壽命,力求使鈉離子電池在移動出行領域得到廣泛應用。與電網營運商和工業終端用戶的策略合作有助於確保可預測的需求並加速市場普及。各公司大力投資研發,以改進電解液配方和安全添加劑,進而實現產品差異化。擴大產能和在地化生產有助於降低供應鏈風險並縮短產品上市時間。各公司利用政府激勵措施和資助計畫來加速商業化和試點計畫。與學術機構和材料供應商的合作也為創新提供了支持。此外,行銷工作著重強調安全性、永續性和成本優勢,以加強品牌定位,並在電網、工業和細分行動移動領域建立客戶信任。
目錄
第1章:方法論
- 市場範圍和定義
- 研究設計
- 研究方法
- 資料收集方法
- 資料探勘來源
- 全球的
- 地區/國家
- 基準估算和計算
- 基準年計算
- 市場估算的關鍵趨勢
- 初步研究和驗證
- 原始資料
- 預測模型
- 研究假設和局限性
第2章:執行概要
第3章:行業洞察
- 產業生態系分析
- 供應商格局
- 利潤率
- 每個階段的價值增加
- 影響價值鏈的因素
- 中斷
- 產業影響因素
- 成長促進因素
- 產業陷阱與挑戰
- 供應鏈的複雜性
- 市場機遇
- 成長潛力分析
- 監管環境
- 北美洲
- 歐洲
- 亞太地區
- 拉丁美洲
- 中東和非洲
- 波特的分析
- PESTEL 分析
- 價格趨勢
- 按地區
- 活性物質
- 未來市場趨勢
- 技術與創新格局
- 當前技術趨勢
- 新興技術
- 專利格局
- 貿易統計(註:僅提供重點國家的貿易統計)
- 主要進口國
- 主要出口國
- 永續性和環境方面
- 永續實踐
- 減少廢棄物策略
- 生產中的能源效率
- 環保舉措
- 碳足跡考量
第4章:競爭格局
- 介紹
- 公司市佔率分析
- 按地區
- 北美洲
- 歐洲
- 亞太地區
- 拉丁美洲
- MEA
- 按地區
- 公司矩陣分析
- 主要市場參與者的競爭分析
- 競爭定位矩陣
- 關鍵進展
- 併購
- 合作夥伴關係與合作
- 新產品發布
- 擴張計劃
第5章:市場估算與預測:依活性成分類型分類,2021-2034年
- 主要趨勢
- 陰極活性材料
- 層狀過渡金屬氧化物(TMLO)
- NASICON型材料
- 普魯士藍類似物(PBA)
- 多陰離子化合物
- 陽極活性材料
- 硬碳材料
- 生質能衍生硬碳
- 石油焦衍生的硬碳
- 合成硬碳
- 鈦基負極材料
- 新興陽極材料
- 其他
第6章:市場估算與預測:依輔助材料分類,2021-2034年
- 主要趨勢
- 電解質材料
- 鈉鹽
- 高氯酸鈉(NaClO4)
- 高級鈉鹽
- 有機溶劑
- 碳酸酯溶劑(EC、DMC、PC、EMC)
- 替代溶劑體系
- 電解質添加劑
- 成膜助劑(FEC、VC)
- 專業性能添加劑
- 黏合劑材料
- 羧甲基纖維素鈉(Na-CMC)
- 聚偏二氟乙烯(PVDF)
- 替代黏合劑系統
- 導電添加劑
- 炭黑
- 先進導電材料
- 其他材料
第7章:市場估計與預測:依應用領域分類,2021-2034年
- 主要趨勢
- 電網級儲能應用
- 公用事業規模儲能系統(>10兆瓦)
- 再生能源併網系統
- 電動車快速充電基礎設施
- 交通運輸應用
- 電動汽車系統
- 特種運輸
- 工業和商業應用
- 資料中心UPS系統
- 工業備用電源
- 電信基礎設施
- 其他應用
第8章:市場估算與預測:依地區分類,2021-2034年
- 主要趨勢
- 北美洲
- 美國
- 加拿大
- 歐洲
- 德國
- 英國
- 法國
- 義大利
- 西班牙
- 歐洲其他地區
- 亞太地區
- 中國
- 印度
- 日本
- 澳洲
- 韓國
- 亞太其他地區
- 拉丁美洲
- 巴西
- 墨西哥
- 阿根廷
- 拉丁美洲其他地區
- 中東和非洲
- 沙烏地阿拉伯
- 南非
- 阿拉伯聯合大公國
- 中東和非洲其他地區
第9章:公司簡介
- Contemporary Amperex Technology Co., Limited (CATL)
- HiNa Battery Technology Co., Ltd.
- Faradion Limited (acquired by Reliance Industries)
- TIAMAT SAS
- Altris AB
- Kuraray Co., Ltd.
- Sumitomo Bakelite Co., Ltd.
- BTR New Material Group Co., Ltd.
- Shengquan Group Co., Ltd.
- Kureha Corporation
- Tinci Materials Technology Co., Ltd.
- DFD New Energy Materials Co., Ltd.
- CAPCHEM Technology Co., Ltd.
- YONGTA Chemical Technology Co., Ltd.
- RTXC New Energy Technology Co., Ltd.
- NGK Insulators, Ltd.
- AMTE Power plc
- MSE Supplies LLC
- MTI
- XTL Corporation
- NATRIUM Energy Technology Co., Ltd.
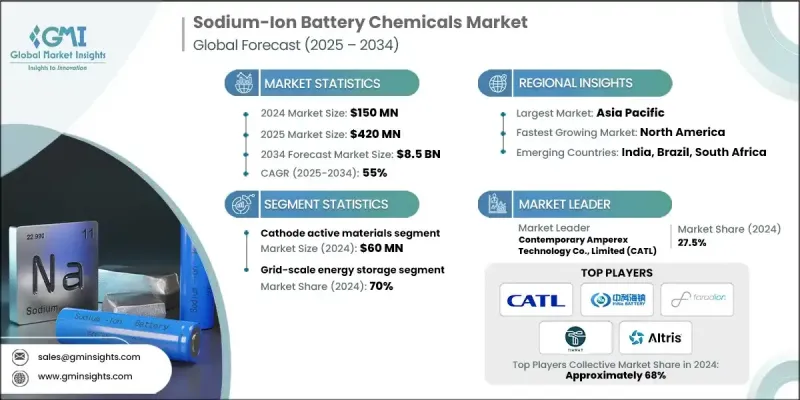
The Global Sodium-Ion Battery Chemicals Market was valued at USD 150 million in 2024 and is estimated to grow at a CAGR of 55% to reach USD 8.5 Billion by 2034.
The market's rapid growth is fueled by the cost-effectiveness of sodium-ion systems, which rely on abundant, cobalt-free materials and optimized electrolyte-cathode pairings. Industrial and grid-scale users prioritize cost per kilowatt-hour, cycle life, and safety, which makes sodium-ion chemistry particularly attractive in these sectors. Mobility applications remain cautious due to volumetric energy constraints, with wider adoption expected once energy densities surpass 200 Wh/kg. Regional policies also play a key role: the EU emphasizes recyclability and end-of-life management, supporting sodium-heavy chemistries, while China's industrial strategy under the 14th Five-Year Plan accelerates domestic pilots and materials scale-up. Grid-focused adoption ensures predictable demand for upstream chemicals, particularly electrolytes and additives, while performance improvements, cost reductions, and cathode innovations strengthen the market foothold in industrial, grid, and select mobility niches.
| Market Scope | |
|---|---|
| Start Year | 2024 |
| Forecast Year | 2025-2034 |
| Start Value | $150 Million |
| Forecast Value | $8.5 Billion |
| CAGR | 55% |
The cathode active materials segment generated USD 60 million in 2024. They hold the largest value share due to their critical role in energy density and lifecycle performance, while anode materials account for roughly 30%, with the remainder in supporting chemicals and other materials. Early-generation sodium-ion cells deliver about 175 Wh/kg, with advancements in sodium vanadium phosphate and NASICON cathodes expected to push energy density above 200 Wh/kg by 2027. Cathode innovation drives the greatest Wh/kg gains, while hard carbon anodes improve first-cycle efficiency and long-term capacity retention.
The grid-scale energy storage segment held a 70% share, valued at USD 105 million in 2024. Sodium-ion batteries offer cost-efficient and thermally safe solutions for renewable energy integration and load-leveling. Additionally, they are gaining traction in low-speed electric vehicles, where affordability and safety outweigh volumetric energy density requirements.
North America Sodium-Ion Battery Chemicals Market reached USD 18 million in 2024. Federal funding for R&D and commercialization, along with private capital investment targeting industrial and data center applications, are key growth drivers. Initiatives by U.S. government agencies funnel substantial resources into scaling alternative chemistries. Manufacturing projects, particularly in North Carolina and Michigan, highlight early adoption in industrial UPS, grid services, and telecom applications. North America benefits from a strong supplier ecosystem, while Canada leverages its domestic materials base and geographic advantages.
Key players in the Sodium-Ion Battery Chemicals Market include TIAMAT SAS, HiNa Battery Technology Co., Ltd., Altris AB, Contemporary Amperex Technology Co., Limited (CATL), Faradion (Reliance), and others. Companies are focusing on advancing cathode and anode chemistries to increase energy density and cycle life, aiming to make sodium-ion viable for mobility applications. Strategic partnerships with grid operators and industrial end-users help secure predictable demand and accelerate adoption. Firms are investing heavily in R&D to enhance electrolyte formulations and safety additives, which differentiate their offerings. Expanding manufacturing capacity and localizing production reduces supply chain risks and shortens time-to-market. Companies leverage government incentives and funding programs to accelerate commercialization and pilot projects. Collaborations with academic institutions and material suppliers support innovation. Additionally, marketing efforts emphasize safety, sustainability, and cost advantages to strengthen brand positioning and build customer trust across grid, industrial, and niche mobility segments.
Table of Contents
Chapter 1 Methodology
- 1.1 Market scope and definition
- 1.2 Research design
- 1.2.1 Research approach
- 1.2.2 Data collection methods
- 1.3 Data mining sources
- 1.3.1 Global
- 1.3.2 Regional/Country
- 1.4 Base estimates and calculations
- 1.4.1 Base year calculation
- 1.4.2 Key trends for market estimation
- 1.5 Primary research and validation
- 1.5.1 Primary sources
- 1.6 Forecast model
- 1.7 Research assumptions and limitations
Chapter 2 Executive Summary
- 2.1 Industry 360° synopsis
- 2.2 Key market trends
- 2.2.1 Regional
- 2.2.2 Active Material Type
- 2.2.3 Supporting Materials
- 2.2.4 Application
- 2.3 TAM Analysis, 2025-2034
- 2.4 CXO perspectives: Strategic imperatives
- 2.4.1 Executive decision points
- 2.4.2 Critical success factors
- 2.5 Future Outlook and Strategic Recommendations
Chapter 3 Industry Insights
- 3.1 Industry ecosystem analysis
- 3.1.1 Supplier Landscape
- 3.1.2 Profit Margin
- 3.1.3 Value addition at each stage
- 3.1.4 Factor affecting the value chain
- 3.1.5 Disruptions
- 3.2 Industry impact forces
- 3.2.1 Growth drivers
- 3.2.2 Industry pitfalls and challenges
- 3.2.2.1 Supply chain complexity
- 3.2.3 Market opportunities
- 3.3 Growth potential analysis
- 3.4 Regulatory landscape
- 3.4.1 North America
- 3.4.2 Europe
- 3.4.3 Asia Pacific
- 3.4.4 Latin America
- 3.4.5 Middle East & Africa
- 3.5 Porter's analysis
- 3.6 PESTEL analysis
- 3.7 Price trends
- 3.7.1 By region
- 3.7.2 By active material
- 3.8 Future market trends
- 3.9 Technology and Innovation landscape
- 3.9.1 Current technological trends
- 3.9.2 Emerging technologies
- 3.10 Patent Landscape
- 3.11 Trade statistics (Note: the trade statistics will be provided for key countries only)
- 3.11.1 Major importing countries
- 3.11.2 Major exporting countries
- 3.12 Sustainability and Environmental Aspects
- 3.12.1 Sustainable Practices
- 3.12.2 Waste Reduction Strategies
- 3.12.3 Energy Efficiency in Production
- 3.12.4 Eco-friendly Initiatives
- 3.13 Carbon Footprint Considerations
Chapter 4 Competitive Landscape, 2024
- 4.1 Introduction
- 4.2 Company market share analysis
- 4.2.1 By region
- 4.2.1.1 North America
- 4.2.1.2 Europe
- 4.2.1.3 Asia Pacific
- 4.2.1.4 LATAM
- 4.2.1.5 MEA
- 4.2.1 By region
- 4.3 Company matrix analysis
- 4.4 Competitive analysis of major market players
- 4.5 Competitive positioning matrix
- 4.6 Key developments
- 4.6.1 Mergers & acquisitions
- 4.6.2 Partnerships & collaborations
- 4.6.3 New Product Launches
- 4.6.4 Expansion Plans
Chapter 5 Market Estimates and Forecast, By Active Material Type, 2021- 2034 (USD Million, Kilo Tons)
- 5.1 Key trends
- 5.2 Cathode active materials
- 5.2.1 Layered transition metal oxides (TMLO)
- 5.2.2 NASICON-type materials
- 5.2.3 Prussian blue analogues (PBAs)
- 5.2.4 Polyanionic compounds
- 5.3 Anode active materials
- 5.3.1 Hard carbon materials
- 5.3.2 Biomass-derived hard carbon
- 5.3.3 Petroleum coke-derived hard carbon
- 5.3.4 Synthetic hard carbon
- 5.3.5 Titanium-based anode materials
- 5.3.6 Emerging anode materials
- 5.4 Others
Chapter 6 Market Estimates and Forecast, By Supporting Materials, 2021- 2034 (USD Million, Kilo Tons)
- 6.1 Key trends
- 6.2 Electrolyte materials
- 6.2.1 Sodium salts
- 6.2.2 Sodium perchlorate (NaClO4)
- 6.2.3 Advanced sodium salts
- 6.3 Organic solvents
- 6.3.1 Carbonate solvents (EC, DMC, PC, EMC)
- 6.3.2 Alternative solvent systems
- 6.4 Electrolyte additives
- 6.4.1 Film-forming additives (FEC, VC)
- 6.4.2 Specialized performance additives
- 6.5 Binder materials
- 6.5.1 Sodium carboxymethyl cellulose (Na-CMC)
- 6.5.2 Polyvinylidene fluoride (PVDF)
- 6.5.3 Alternative binder systems
- 6.6 Conductive additives
- 6.6.1 Carbon black
- 6.6.2 Advanced conductive materials
- 6.7 Other materials
Chapter 7 Market Estimates and Forecast, By Application, 2021 - 2034 (USD Million, Kilo Tons)
- 7.1 Key trends
- 7.2 Grid-scale energy storage applications
- 7.2.1 Utility-scale storage systems (>10 MW)
- 7.2.2 Renewable energy integration systems
- 7.2.3 EV fast charging infrastructure
- 7.3 Transportation applications
- 7.3.1 Electric vehicle systems
- 7.3.2 Specialized transportation
- 7.4 Industrial & commercial applications
- 7.4.1 Data center UPS systems
- 7.4.2 Industrial backup power
- 7.4.3 Telecommunications infrastructure
- 7.5 Other applications
Chapter 8 Market Estimates and Forecast, By Region, 2021 - 2034 (USD Million, Kilo Tons)
- 8.1 Key trends
- 8.2 North America
- 8.2.1 U.S.
- 8.2.2 Canada
- 8.3 Europe
- 8.3.1 Germany
- 8.3.2 UK
- 8.3.3 France
- 8.3.4 Italy
- 8.3.5 Spain
- 8.3.6 Rest of Europe
- 8.4 Asia Pacific
- 8.4.1 China
- 8.4.2 India
- 8.4.3 Japan
- 8.4.4 Australia
- 8.4.5 South Korea
- 8.4.6 Rest of Asia Pacific
- 8.5 Latin America
- 8.5.1 Brazil
- 8.5.2 Mexico
- 8.5.3 Argentina
- 8.5.4 Rest of Latin America
- 8.6 Middle East & Africa
- 8.6.1 Saudi Arabia
- 8.6.2 South Africa
- 8.6.3 UAE
- 8.6.4 Rest of Middle East & Africa
Chapter 9 Company Profiles
- 9.1 Contemporary Amperex Technology Co., Limited (CATL)
- 9.2 HiNa Battery Technology Co., Ltd.
- 9.3 Faradion Limited (acquired by Reliance Industries)
- 9.4 TIAMAT SAS
- 9.5 Altris AB
- 9.6 Kuraray Co., Ltd.
- 9.7 Sumitomo Bakelite Co., Ltd.
- 9.8 BTR New Material Group Co., Ltd.
- 9.9 Shengquan Group Co., Ltd.
- 9.10 Kureha Corporation
- 9.11 Tinci Materials Technology Co., Ltd.
- 9.12 DFD New Energy Materials Co., Ltd.
- 9.13 CAPCHEM Technology Co., Ltd.
- 9.14 YONGTA Chemical Technology Co., Ltd.
- 9.15 RTXC New Energy Technology Co., Ltd.
- 9.16 NGK Insulators, Ltd.
- 9.17 AMTE Power plc
- 9.18 MSE Supplies LLC
- 9.19 MTI
- 9.20 XTL Corporation
- 9.21 NATRIUM Energy Technology Co., Ltd.
 鈉離子電池市場預測至 2034 年—按電池類型、組件、電池容量、技術、應用、最終用戶和地區進行全球分析。
 全球鈉離子電池市場(至2040年):按電池類型、技術、應用、終端用戶產業、地區和主要企業分類
 鈉離子電池市場:2026-2032 年全球市場預測,按類型、技術、電池容量、組件、電池設計、負極材料、正極材料、電解液類型、應用和銷售管道。
 突破性創新推動鈉離子電池的商業化
 鈉離子電池市場規模、佔有率和趨勢分析報告:按技術、最終用途、地區和細分市場預測(2026-2033 年)全球鈉離子電池市場預測(至2034年):按電池類型、技術類型、組件、形狀、應用和地區分類
 日本鈉離子電池市場規模、佔有率、趨勢和預測:按類型、應用和地區分類,2026-2034年鈉離子電池市場規模、佔有率、趨勢及預測(按類型、應用和地區分類,2026-2034年)
 2026年全球鈉離子電池市場報告鈉離子電池市場規模、佔有率、成長、全球產業分析:依類型、應用、區域洞察和預測(2026-2034 年)