


 |
市場調查報告書
商品編碼
1858880
循環經濟解決方案市場機會、成長促進因素、產業趨勢分析及預測Circular Economy Solutions Market Opportunity, Growth Drivers, Industry Trend Analysis, and Forecast |
||||||
2024 年全球循環經濟解決方案市值為 2.7 兆美元,預計到 2034 年將以 8.2% 的複合年成長率成長至 5.8 兆美元。
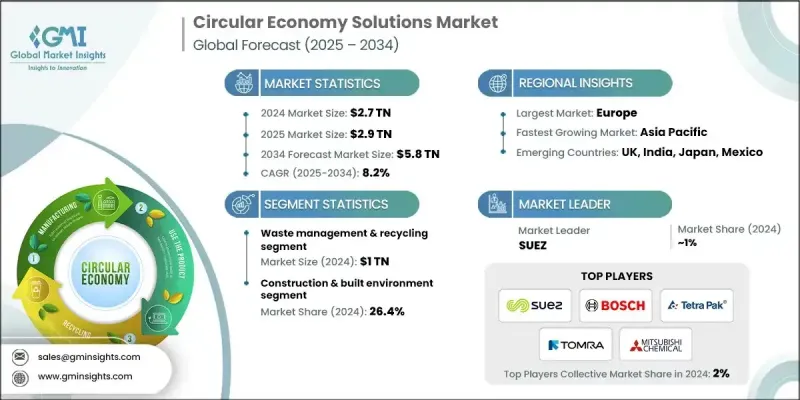
隨著資源短缺和供應鏈不穩定持續為各行各業帶來挑戰,企業正擴大採用循環經濟模式來提高營運效率並最大限度地減少浪費。這項轉變的驅動力在於保障材料供應、降低成本並同時促進永續發展。企業正在將回收和再利用系統融入核心營運,逐步擺脫傳統的線性模式。物聯網和人工智慧等數位技術如今能夠實現即時生命週期追蹤和預測性維護,從而提升這些系統的效能。專注於先進材料回收、高效能循環和智慧基礎設施的企業正引領這項轉型。數位平台也迅速發展,促進了翻新產品交易、備件市場和共享服務。這一成長趨勢凸顯了市場向閉迴路模式和循環驅動型創新轉變的更廣泛趨勢,從而提升了企業的長期韌性和資源最佳化利用率。
| 市場範圍 | |
|---|---|
| 起始年份 | 2024 |
| 預測年份 | 2025-2034 |
| 起始值 | 2.7兆美元 |
| 預測值 | 5.8兆美元 |
| 複合年成長率 | 8.2% |
到2024年,廢棄物管理和回收領域預計將創造1兆美元的產值,成為循環經濟框架中最成熟、最容易推廣的部分。市政當局和企業廣泛採用這些系統,以提高資源回收率並減少垃圾掩埋量。威立雅和巴斯夫等行業領導者正在利用先進的分類技術和物流創新來改善收集和處理模式。該領域持續受益於支持永續發展和循環經濟實踐的監管舉措,從而促進各行業之間的快速整合。
2024年,電子電氣設備產業市佔率預計將達到20.1%,這主要得益於日益增強的環保意識以及回收和翻新技術的發展。消費者對永續電子產品的需求不斷成長,以及遏制電子垃圾產生的努力,都推動了該行業的成長。整個產業的公司都在致力於可拆卸設計和延長產品壽命,從而增強了對循環電子解決方案的需求。
預計到2024年,美國循環經濟解決方案市佔率將達到77.1%。消費者意識的增強和企業責任框架的完善正在推動該地區對循環經濟實踐的需求。環境、社會和治理(ESG)策略的採納、綠色建築認證的增加以及生產者延伸責任政策的擴展,使美國在該市場中處於領先地位。各行各業的企業都在積極採用產品生命週期服務和永續物流,以滿足不斷變化的監管要求和消費者期望。
全球循環經濟解決方案市場的主要參與者包括 Tomra Systems、Tetra Pak、Cylib、蘇伊士集團 (SUEZ)、威立雅 (Veolia)、巴斯夫 (BASF)、Circularise、優美科 (Umicore)、ENEOS、Carbios、Trinseo、Li Industries、Bosch (Bosch)、Reinverse 和三菱化學。為了鞏固其在循環經濟解決方案市場的地位,領先企業正致力於整合包括人工智慧 (AI) 和物聯網 (IoT) 在內的智慧技術,以實現即時追蹤、預測分析和生命週期管理。許多企業正在與技術供應商建立策略合作夥伴關係,以改善材料回收流程並支援閉迴路模式。對環保材料和可擴展回收技術的研發投入也在推動產品創新。此外,企業正在拓展其翻新產品和產品即服務 (PaaS) 模式的服務,以滿足日益成長的環保意識消費者的需求。
目錄
第1章:方法論與範圍
第2章:執行概要
第3章:行業洞察
- 產業生態系分析
- 供應商格局
- 利潤率
- 每個階段的價值增加
- 影響價值鏈的因素
- 產業影響因素
- 成長促進因素
- 監管壓力與永續發展要求
- 資源稀缺性和成本效益
- 消費者對永續解決方案的需求
- 產業陷阱與挑戰
- 初始投資額高,且投資報酬率存在不確定性
- 基礎設施分散且缺乏標準化
- 機會
- 數位化賦能與智慧技術
- 新的商業模式和收入來源
- 成長促進因素
- 成長潛力分析
- 未來市場趨勢
- 技術與創新格局
- 當前技術趨勢
- 新興技術
- 監管環境
- 標準和合規要求
- 區域監理框架
- 認證標準
- 差距分析
- 風險評估與緩解
- 波特的分析
- PESTEL 分析
第4章:競爭格局
- 介紹
- 公司市佔率分析
- 按地區
- 公司矩陣分析
- 主要市場參與者的競爭分析
- 競爭定位矩陣
- 關鍵進展
- 併購
- 合作夥伴關係與合作
- 新產品發布
- 擴張計劃
第5章:市場估算與預測:依解類型分類,2021-2034年
- 廢棄物管理與回收
- 先進的分選和分離系統
- 化學回收與解聚
- 物料回收設施(MRF)及處理
- 有機廢棄物處理和沼氣生產
- 電子垃圾(電子廢棄物)回收
- 再製造和翻新服務
- 汽車零件再製造
- 電子及IT設備翻新
- 工業機械設備修復
- 航太與國防零件回收
- 產品即服務 (PaaS) 模式
- 設備租賃與績效合約
- 出行即服務與共享交通
- 照明即服務與能源效能
- 包裝即服務和可重複使用容器
- 工業共生與資源交換
- 垃圾發電整合系統
- 依產品交換與材料匹配平台
- 生態工業園區開發
- 碳捕獲、利用與封存(CCUS)一體化
- 其他(數位化溯源和資料平台等)
第6章:市場估算與預測:依平台類型分類,2021-2034年
- 產品和材料交換
- 二手交易市場
- 共享平台
- 循環供應鏈網路
- 其他(永續物流平台等)
第7章:市場估計與預測:依應用領域分類,2021-2034年
- 建築與建成環境
- 塑膠及包裝
- 電子電器設備
- 紡織品和服裝
- 食品與農業
- 汽車與運輸
- 其他(農業等)
第8章:市場估算與預測:依地區分類,2021-2034年
- 鑰匙
- 北美洲
- 美國
- 加拿大
- 歐洲
- 德國
- 英國
- 法國
- 西班牙
- 義大利
- 亞太地區
- 中國
- 日本
- 印度
- 澳洲
- 韓國
- 拉丁美洲
- 巴西
- 墨西哥
- 阿根廷
- MEA
- 南非
- 沙烏地阿拉伯
- 阿拉伯聯合大公國
第9章:公司簡介
- BASF
- Bosch
- Carbios
- Circularise
- Cylib
- ENEOS
- Li Industries
- Mitsubishi Chemical
- Refinverse
- SUEZ
- Tetra Pak
- Tomra Systems
- Trinseo
- Umicore
- Veolia
The Global Circular Economy Solutions Market was valued at USD 2.7 trillion in 2024 and is estimated to grow at a CAGR of 8.2% to reach USD 5.8 trillion by 2034.
As resource scarcity and supply chain instability continue to challenge industries, companies are increasingly adopting circular models to enhance operational efficiency and minimize waste. This shift is being driven by a need to safeguard material availability and reduce costs while promoting sustainability. Businesses are integrating recovery and reuse systems into core operations, transitioning away from conventional linear models. Digital technologies like IoT and AI are now enabling real-time lifecycle tracking and predictive maintenance, enhancing the effectiveness of these systems. Companies focused on advanced material recovery, efficient recycling, and smart infrastructure are leading this transition. Digital platforms have also expanded rapidly, facilitating refurbished goods trading, spare parts marketplaces, and shared services. This growth trend underscores a broader market movement toward closed-loop models and circularity-driven innovation, improving long-term resilience and resource optimization.
| Market Scope | |
|---|---|
| Start Year | 2024 |
| Forecast Year | 2025-2034 |
| Start Value | $2.7 Trillion |
| Forecast Value | $5.8 Trillion |
| CAGR | 8.2% |
The waste management and recycling segment generated USD 1 trillion in 2024, representing the most developed and readily scalable part of circular economy frameworks. These systems are widely adopted by municipalities and corporations to improve resource recovery and reduce landfill waste. Industry leaders like Veolia and BASF are leveraging advanced sorting technologies and logistical innovations to refine collection and processing models. This segment continues to benefit from regulatory initiatives that support sustainability and circularity practices, encouraging quicker integration across industries.
The electronics and electrical equipment segment held a 20.1% share in 2024, propelled by rising environmental consciousness and technology-driven advancements in recycling and refurbishing. Growing consumer preference for sustainable electronics and the push to curb e-waste generation have fueled this segment. Companies across the sector are focusing on design for disassembly and extended product life, strengthening demand for circular electronics solutions.
United States Circular Economy Solutions Market held a 77.1% share in 2024. Strong consumer awareness and corporate responsibility frameworks are driving the regional demand for circular practices. Adoption of environmental, social, and governance (ESG) strategies, increased certification for green buildings, and expansion of extended producer responsibility policies have positioned the U.S. at the forefront of this market. Businesses across sectors are embracing product lifecycle services and sustainable logistics to align with evolving regulatory and consumer expectations.
Key players in the Global Circular Economy Solutions Market include Tomra Systems, Tetra Pak, Cylib, SUEZ, Veolia, BASF, Circularise, Umicore, ENEOS, Carbios, Trinseo, Li Industries, Bosch, Reinverse, and Mitsubishi Chemical. To strengthen their foothold in the Circular Economy Solutions Market, leading companies are focusing on integrating smart technologies, including AI and IoT, to enable real-time tracking, predictive analytics, and lifecycle management. Many are forming strategic partnerships with technology providers to enhance material recovery processes and support closed-loop models. Investments in R&D for eco-friendly materials and scalable recycling technologies are also shaping product innovation. Additionally, businesses are expanding their services around refurbished products and product-as-a-service models to tap into the evolving preferences of environmentally conscious consumers.
Table of Contents
Chapter 1 Methodology & Scope
- 1.1 Market scope and definition
- 1.2 Research design
- 1.2.1 Research approach
- 1.2.2 Data collection methods
- 1.3 Data mining sources
- 1.3.1 Global
- 1.3.2 Regional
- 1.4 Base estimates and calculations
- 1.4.1 Base year calculation
- 1.4.2 Key trends for market estimation
- 1.5 Primary research and validation
- 1.5.1 Primary sources
- 1.6 Forecast model
- 1.7 Research assumptions and limitations
Chapter 2 Executive Summary
- 2.1 Industry 360° synopsis
- 2.2 Key market trends
- 2.2.1 Regional
- 2.2.2 Solution type
- 2.2.3 Platforms type
- 2.2.4 Application
- 2.3 CXO perspectives: Strategic imperatives
- 2.3.1 Key decision points for industry executives
- 2.3.2 Critical success factors for market players
- 2.4 Future outlook and strategic recommendations
Chapter 3 Industry Insights
- 3.1 Industry ecosystem analysis
- 3.1.1 Supplier landscape
- 3.1.2 Profit margin
- 3.1.3 Value addition at each stage
- 3.1.4 Factor affecting the value chain
- 3.2 Industry impact forces
- 3.2.1 Growth drivers
- 3.2.1.1 Regulatory pressure & sustainability mandates
- 3.2.1.2 Resource scarcity & cost efficiency
- 3.2.1.3 Consumer demand for sustainable solutions
- 3.2.2 Industry pitfalls & challenges
- 3.2.2.1 High initial investment & ROI uncertainty
- 3.2.2.2 Fragmented infrastructure & lack of standardization
- 3.2.3 Opportunities
- 3.2.3.1 Digital enablement & smart technologies
- 3.2.3.2 New business models & revenue streams
- 3.2.1 Growth drivers
- 3.3 Growth potential analysis
- 3.4 Future market trends
- 3.5 Technology and innovation landscape
- 3.5.1 Current technological trends
- 3.5.2 Emerging technologies
- 3.6 Regulatory landscape
- 3.6.1 Standards and compliance requirements
- 3.6.2 Regional regulatory frameworks
- 3.6.3 Certification standards
- 3.7 Gap Analysis
- 3.8 Risk assessment and mitigation
- 3.9 Porter's analysis
- 3.10 PESTEL analysis
Chapter 4 Competitive Landscape, 2024
- 4.1 Introduction
- 4.2 Company market share analysis
- 4.2.1 By region
- 4.2.1.1 North America
- 4.2.1.2 Europe
- 4.2.1.3 Asia Pacific
- 4.2.1.4 Latin America
- 4.2.1.5 Middle East and Africa
- 4.2.1 By region
- 4.3 Company matrix analysis
- 4.4 Competitive analysis of major market players
- 4.5 Competitive positioning matrix
- 4.6 Key developments
- 4.6.1 Mergers & acquisitions
- 4.6.2 Partnerships & collaborations
- 4.6.3 New product launches
- 4.6.4 Expansion plans
Chapter 5 Market Estimates & Forecast, By Solution Type, 2021-2034 (USD Trillion)
- 5.1 Waste management & recycling
- 5.1.1 Advanced sorting & separation systems
- 5.1.2 Chemical recycling & depolymerization
- 5.1.3 Material recovery facilities (MRF) & processing
- 5.1.4 Organic waste processing & biogas generation
- 5.1.5 Electronic waste (E-waste) recovery
- 5.2 Remanufacturing & refurbishment services
- 5.2.1 Automotive component remanufacturing
- 5.2.2 Electronics & IT equipment refurbishment
- 5.2.3 Industrial machinery & equipment restoration
- 5.2.4 Aerospace & defense component recovery
- 5.3 Product-as-a-service (PaaS) models
- 5.3.1 Equipment leasing & performance contracting
- 5.3.2 Mobility-as-a-service & shared transportation
- 5.3.3 Lighting-as-a-service & energy performance
- 5.3.4 Packaging-as-a-service & reusable container
- 5.4 Industrial symbiosis & resource exchange
- 5.4.1 Waste-to-energy integration systems
- 5.4.2 By-product exchange & material matching platforms
- 5.4.3 Eco-industrial park development
- 5.4.4 Carbon capture, utilization & storage (CCUS) integration
- 5.5 Others (digital traceability & data platforms etc.)
Chapter 6 Market Estimates & Forecast, By Platforms Type, 2021-2034 (USD Trillion)
- 6.1 Product & material exchanges
- 6.2 Reuse & resale marketplaces
- 6.3 Sharing platforms
- 6.4 Circular supply chain networks
- 6.5 Others (sustainable logistics platforms etc.)
Chapter 7 Market Estimates & Forecast, By Application, 2021-2034 (USD Trillion)
- 7.1 Construction & built environment
- 7.2 Plastics & packaging
- 7.3 Electronics & electrical equipment
- 7.4 Textiles & apparel
- 7.5 Food & agriculture
- 7.6 Automotive & transportation
- 7.7 Others (agriculture etc.)
Chapter 8 Market Estimates & Forecast, By Region, 2021-2034 (USD Trillion)
- 8.1 Key
- 8.2 North America
- 8.2.1 U.S.
- 8.2.2 Canada
- 8.3 Europe
- 8.3.1 Germany
- 8.3.2 UK
- 8.3.3 France
- 8.3.4 Spain
- 8.3.5 Italy
- 8.4 Asia Pacific
- 8.4.1 China
- 8.4.2 Japan
- 8.4.3 India
- 8.4.4 Australia
- 8.4.5 South Korea
- 8.5 Latin America
- 8.5.1 Brazil
- 8.5.2 Mexico
- 8.5.3 Argentina
- 8.6 MEA
- 8.6.1 South Africa
- 8.6.2 Saudi Arabia
- 8.6.3 UAE
Chapter 9 Company Profiles
- 9.1 BASF
- 9.2 Bosch
- 9.3 Carbios
- 9.4 Circularise
- 9.5 Cylib
- 9.6 ENEOS
- 9.7 Li Industries
- 9.8 Mitsubishi Chemical
- 9.9 Refinverse
- 9.10 SUEZ
- 9.11 Tetra Pak
- 9.12 Tomra Systems
- 9.13 Trinseo
- 9.14 Umicore
- 9.15 Veolia