


 |
市場調查報告書
商品編碼
1844302
認知代理市場機會、成長動力、產業趨勢分析及 2025 - 2034 年預測Cognitive Agent Market Opportunity, Growth Drivers, Industry Trend Analysis, and Forecast 2025 - 2034 |
||||||
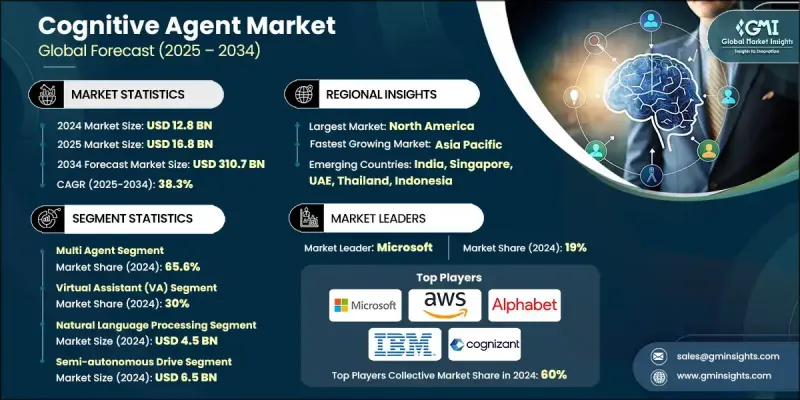
2024 年全球認知代理市場價值為 128 億美元,預計到 2034 年將以 38.3% 的複合年成長率成長至 3107 億美元。
認知代理的需求正受到企業推動,這些企業希望增強決策能力、實現客戶互動自動化並提升營運效率。這些先進的系統超越了傳統的虛擬助手,利用尖端技術理解情境、學習過往經驗,並獨立或在極少人工干預的情況下執行任務。商業、金融服務、保險、醫療保健、零售、製造、政府和教育等行業正在採用認知代理來支援客戶服務、詐欺檢測、供應鏈最佳化和勞動力管理等功能。隨著企業和政府適應遠距辦公和客戶服務需求,全球疫情加速了包括認知代理在內的人工智慧解決方案的採用。 2019-2020年期間,人工智慧相關投資大幅成長了40%,標誌著企業正轉向人工智慧驅動的解決方案,以在疫情期間維持營運並為客戶提供優質服務。
| 市場範圍 | |
|---|---|
| 起始年份 | 2024 |
| 預測年份 | 2025-2034 |
| 起始值 | 128億美元 |
| 預測值 | 3107億美元 |
| 複合年成長率 | 38.3% |
多智慧體領域在2024年佔了65.6%的佔有率,預計2025年至2034年的複合年成長率將達到37.1%。該領域的蓬勃發展得益於其能夠協調多個人工智慧系統,以協作的方式解決任務。多智慧體系統可以互動、共享資料,並增強決策能力以最佳化效能,使其成為管理科技、金融和物流等行業大規模動態營運的理想選擇。
虛擬助理領域在 2024 年佔據了 30% 的佔有率,預計將快速成長,2025 年至 2034 年的複合年成長率為 35.5%。這些助手越來越受歡迎,因為它們可以改善客戶互動並提供無縫的用戶體驗,提供可處理數百萬用戶的可擴展性,同時整合到更廣泛的數位生態系統中。
2024年,美國認知代理市場規模達44億美元。憑藉先進的技術基礎設施和廣泛的企業應用,美國繼續在全球認知代理市場佔據主導地位。諸如「國家人工智慧計畫」等政府支持措施促進了人工智慧技術的發展,鼓勵成熟的科技公司和新創公司投資各行各業的認知代理解決方案。
全球認知代理市場的主要參與者包括 IBM、微軟、OpenAI、Salesforce、Cognizant、甲骨文、NVIDIA、Google、埃森哲和亞馬遜網路服務。認知代理市場中的公司正在採取各種策略來擴大其市場佔有率。這些措施包括策略合作夥伴關係、合併和收購,以增強技術產品並擴大市場覆蓋範圍。一些公司也大力投資研發,以改善其認知代理的功能,使其能夠提供更複雜的決策、自動化客戶服務和流程最佳化功能。此外,公司正專注於將認知代理整合到現有的業務工作流程中,以便為各行各業的客戶提供附加價值。
目錄
第1章:方法論與範圍
第2章:執行摘要
第3章:行業洞察
- 產業生態系統分析
- 供應商格局
- 雲端服務供應商
- 人工智慧平台提供商
- 系統整合商
- 硬體和基礎設施供應商
- 安全與治理解決方案提供商
- 產業特定AI解決方案提供商
- 成本結構
- 利潤率
- 每個階段的增值
- 影響供應鏈的因素
- 破壞者
- 供應商格局
- 對部隊的影響
- 成長動力
- 越來越多的企業採用人工智慧虛擬助手
- 對生成式人工智慧、機器學習和 NLP 技術的投資不斷增加
- 各行各業對自動化的需求不斷成長
- 擴展雲端基礎設施和人工智慧即服務產品
- 產業陷阱與挑戰
- 資料隱私、網路安全和監管問題
- 與傳統 IT 系統的整合複雜性高
- 市場機會
- 人工智慧技術提供者與產業特定參與者之間的合作
- 多智慧體系統與完全自主認知智慧體的開發
- 成長動力
- 技術趨勢與創新生態系統
- 現有技術
- 大型語言模型演化
- 多模式人工智慧整合
- 強化學習的進步
- 神經架構搜尋
- 新興技術
- 代理的聯邦學習
- 邊緣人工智慧與分散式運算
- 量子計算整合
- 腦機介面開發
- 現有技術
- 成長潛力分析
- 監管格局
- NIST人工智慧風險管理框架
- 歐盟人工智慧合規要求
- GDPR資料保護影響
- 特定行業的人工智慧法規
- 國際人工智慧治理標準
- 道德人工智慧發展指南
- 成本分解分析
- 開發和培訓成本
- 基礎設施和計算費用
- 整合和客製化成本
- 持續維護和更新
- 合規與治理成本
- 波特的分析
- PESTEL分析
- 專利分析
- 永續性和環境方面
- 環境影響評估與生命週期分析
- 社會影響力和社區關係
- 治理與企業責任
- 永續技術發展
- 用例
- AI模型與演算法分析
- 基礎模型景觀
- 微調和客製化方法
- 模型性能基準測試
- 訓練資料要求
- 電腦資源最佳化
- 投資格局分析
- 認知人工智慧的創投
- 企業投資與收購活動
- 政府資助人工智慧研究
- 學術研究投資
- 客戶行為分析
- 企業採用決策因素
- 用例優先模式
- 供應商評估標準
- 實施方法偏好
- 性能和品質標準
- 代理響應準確度指標
- 處理速度和延遲要求
- 可擴充性和吞吐量基準
- 可靠性和可用性標準
- 風險評估框架
- 人工智慧模型偏見和公平風險
- 資料隱私和安全風險
- 監理合規風險
- 技術過時的風險
- 道德人工智慧與負責任的發展
- 人工智慧倫理框架實施
- 偏見檢測和緩解策略
- 公平與包容性考慮
- 透明度和可解釋性要求
第4章:競爭格局
- 介紹
- 公司市佔率分析
- 北美洲
- 歐洲
- 亞太地區
- 拉丁美洲
- 中東和非洲
- 競爭定位矩陣
- 戰略展望矩陣
- 關鍵進展
- 併購
- 夥伴關係與合作
- 新產品發布
- 擴張計劃和資金
第5章:市場估計與預測:按代理商,2021 - 2034 年
- 主要趨勢
- 虛擬助理(VA)
- 對話式客戶代理
- 數位工作者
- 決策支持
- 其他
第6章:市場估計與預測:按系統,2021 - 2034
- 主要趨勢
- 單一代理
- 多代理
第7章:市場估計與預測:依自主水平,2021 - 2034 年
- 主要趨勢
- 半自主
- 完全自主
- 輔助(人機互動)
第8章:市場估計與預測:依技術分類,2021 - 2034 年
- 主要趨勢
- 機器學習(ML)
- 自然語言處理
- 電腦視覺
- 機器人流程自動化(RPA)
- 認知運算
- 其他
第9章:市場估計與預測:依最終用途,2021 - 2034
- 主要趨勢
- 銀行、金融服務和保險(BFSI)
- 醫療保健與生命科學
- 零售與電子商務
- 媒體與娛樂
- 製造業
- 政府和公共部門
- 教育
- 運輸與物流
- 能源與公用事業
- 其他
第 10 章:市場估計與預測:按地區,2021 年至 2034 年
- 北美洲
- 美國
- 加拿大
- 歐洲
- 英國
- 德國
- 法國
- 義大利
- 西班牙
- 比利時
- 荷蘭
- 瑞典
- 亞太地區
- 中國
- 印度
- 日本
- 澳洲
- 新加坡
- 韓國
- 越南
- 印尼
- 拉丁美洲
- 巴西
- 墨西哥
- 阿根廷
- 多邊環境協定
- 南非
- 沙烏地阿拉伯
- 阿拉伯聯合大公國
第 11 章:公司簡介
- 全球參與者
- OpenAI
- Microsoft
- Amazon Web Services
- IBM
- Anthropic
- Salesforce
- Meta Platforms
- NVIDIA
- Oracle
- 區域參與者
- UiPath
- Automation Anywhere
- ServiceNow
- Baidu
- Alibaba Cloud
- Tencent
- SAP
- Palantir Technologies
- DataRobot
- H2O.ai
- 新興企業
- Cohere
- Stability AI
- Hugging Face
- Adept AI
- Character.AI
- Jasper AI
- Copy.ai
- Rasa
- Moveworks
- Avanade
The Global Cognitive Agent Market was valued at USD 12.8 billion in 2024 and is estimated to grow at a CAGR of 38.3% to reach USD 310.7 billion by 2034.
The demand for cognitive agents is being driven by organizations looking to enhance decision-making, automate customer interactions, and increase operational efficiency. These advanced systems move beyond traditional virtual assistants, leveraging cutting-edge technologies to understand context, learn from past experiences, and perform tasks either independently or with minimal human input. Industries such as BFSI, healthcare, retail, manufacturing, government, and education are adopting cognitive agents to support functions like customer service, fraud detection, supply chain optimization, and workforce management. The global pandemic accelerated the adoption of AI solutions, including cognitive agents, as companies and governments adjusted to remote work and customer service demands. During 2019-2020, AI-related investments saw a significant 40% increase, signaling a shift towards AI-driven solutions to sustain operations and service customers amid disruptions.
| Market Scope | |
|---|---|
| Start Year | 2024 |
| Forecast Year | 2025-2034 |
| Start Value | $12.8 Billion |
| Forecast Value | $310.7 Billion |
| CAGR | 38.3% |
The multi-agent segment held a 65.6% share in 2024 and is projected to grow at a CAGR of 37.1% from 2025 to 2034. This segment thrives due to its ability to coordinate with multiple AI systems to solve tasks in a collaborative manner. Multi-agent systems can interact, share data, and enhance decision-making to optimize performance, making them ideal for managing large-scale, dynamic operations in industries like technology, finance, and logistics.
The virtual assistant segment held a 30% share in 2024 and is expected to grow rapidly, at a CAGR of 35.5% from 2025 to 2034. These assistants are becoming increasingly popular for improving customer interactions and providing seamless user experiences, offering scalability that can handle millions of users while integrating into broader digital ecosystems.
U.S. Cognitive Agent Market generated USD 4.4 billion in 2024. With its advanced technological infrastructure and substantial enterprise adoption, the U.S. continues to dominate the global cognitive agent market. Government support, like the National AI Initiative, fosters the development of AI technologies, encouraging both established tech companies and startups to invest in cognitive agent solutions across various industries.
Major players in the Global Cognitive Agent Market include IBM, Microsoft, OpenAI, Salesforce, Cognizant, Oracle, NVIDIA, Google, Accenture, and Amazon Web Services. Companies in the cognitive agent market are adopting a variety of strategies to expand their market presence. These include strategic partnerships, mergers, and acquisitions to enhance technology offerings and improve market reach. Some companies are also heavily investing in R&D to improve the functionality of their cognitive agents, enabling them to offer more sophisticated decision-making, automated customer service, and process optimization capabilities. Additionally, companies are focusing on the integration of cognitive agents into existing business workflows to provide added value for customers across industries.
Table of Contents
Chapter 1 Methodology & Scope
- 1.1 Market scope and definition
- 1.2 Research design
- 1.2.1 Research approach
- 1.2.2 Data collection methods
- 1.3 Data mining sources
- 1.3.1 Global
- 1.3.2 Regional/Country
- 1.4 Base estimates and calculations
- 1.4.1 Base year calculation
- 1.4.2 Key trends for market estimation
- 1.5 Primary research and validation
- 1.5.1 Primary sources
- 1.6 Forecast model
- 1.6.1.1 Research assumptions and limitations
Chapter 2 Executive Summary
- 2.1 Industry 360° synopsis
- 2.2 Key market trends
- 2.2.1 Regional
- 2.2.2 Agent
- 2.2.3 System
- 2.2.4 Autonomy Level
- 2.2.5 Technology
- 2.2.6 End use
- 2.3 TAM Analysis, 2025-2034
- 2.4 CXO perspectives: Strategic imperatives
- 2.4.1 Key decision points for industry executives
- 2.4.2 Critical success factors for market players
- 2.5 Future outlook and strategic recommendations
Chapter 3 Industry Insights
- 3.1 Industry ecosystem analysis
- 3.1.1 Supplier landscape
- 3.1.1.1 Cloud service providers
- 3.1.1.2 AI platform providers
- 3.1.1.3 System integrators
- 3.1.1.4 Hardware & infrastructure providers
- 3.1.1.5 Security & governance solution providers
- 3.1.1.6 Industry-specific AI solution providers
- 3.1.2 Cost structure
- 3.1.3 Profit margin
- 3.1.4 Value addition at each stage
- 3.1.5 Factors impacting the supply chain
- 3.1.6 Disruptors
- 3.1.1 Supplier landscape
- 3.2 Impact on forces
- 3.2.1 Growth drivers
- 3.2.1.1 Increasing enterprise adoption of AI-powered virtual assistants
- 3.2.1.2 Rising investments in generative AI, machine learning, and NLP technologies
- 3.2.1.3 Growing demand for automation across industries
- 3.2.1.4 Expansion of cloud infrastructure and AI-as-a-Service offerings
- 3.2.2 Industry pitfalls & challenges
- 3.2.2.1 Data privacy, cybersecurity, and regulatory concerns
- 3.2.2.2 High integration complexity with legacy IT systems
- 3.2.3 Market opportunities
- 3.2.3.1 Collaboration between AI tech providers and industry-specific players
- 3.2.3.2 Development of multi-agent systems and fully autonomous cognitive agents
- 3.2.1 Growth drivers
- 3.3 Technology trends & innovation ecosystem
- 3.3.1 Current technologies
- 3.3.1.1 Large language model evolution
- 3.3.1.2 Multi-modal AI integration
- 3.3.1.3 Reinforcement learning advances
- 3.3.1.4 Neural architecture search
- 3.3.2 Emerging technologies
- 3.3.2.1 Federated learning for agents
- 3.3.2.2 Edge AI & distributed computing
- 3.3.2.3 Quantum computing integration
- 3.3.2.4 Brain-computer interface development
- 3.3.1 Current technologies
- 3.4 Growth potential analysis
- 3.5 Regulatory landscape
- 3.5.1 NIST AI risk management framework
- 3.5.2 EU AI compliance requirements
- 3.5.3 GDPR data protection impact
- 3.5.4 Sector-specific AI regulations
- 3.5.5 International AI governance standards
- 3.5.6 Ethical AI development guidelines
- 3.6 Cost breakdown analysis
- 3.6.1 Development & training costs
- 3.6.2 Infrastructure & computing expenses
- 3.6.3 Integration & customization costs
- 3.6.4 Ongoing maintenance & updates
- 3.6.5 Compliance & governance costs
- 3.7 Porter's analysis
- 3.8 PESTEL analysis
- 3.9 Patent analysis
- 3.10 Sustainability and environmental aspects
- 3.10.1 Environmental impact assessment & lifecycle analysis
- 3.10.2 Social impact & community relations
- 3.10.3 Governance & corporate responsibility
- 3.10.4 Sustainable technological development
- 3.11 Use cases
- 3.12 AI model & algorithm analysis
- 3.12.1 Foundation model landscape
- 3.12.2 Fine-tuning & customization approaches
- 3.12.3 Model performance benchmarking
- 3.12.4 Training data requirements
- 3.12.5 Computer resource optimization
- 3.13 Investment landscape analysis
- 3.13.1 Venture capital investment in cognitive AI
- 3.13.2 Corporate investment & acquisition activity
- 3.13.3 Government AI research funding
- 3.13.4 Academic research investment
- 3.14 Customer behavior analysis
- 3.14.1 Enterprise adoption decision factors
- 3.14.2 Use case prioritization patterns
- 3.14.3 Vendor evaluation criteria
- 3.14.4 Implementation approach preferences
- 3.15 Performance & quality standards
- 3.15.1 Agent response accuracy metrics
- 3.15.2 Processing speed & latency requirements
- 3.15.3 Scalability & throughput benchmarks
- 3.15.4 Reliability & availability standards
- 3.16 Risk assessment framework
- 3.16.1 AI model bias & fairness risks
- 3.16.2 Data privacy & security risks
- 3.16.3 Regulatory compliance risks
- 3.16.4 Technology obsolescence risks
- 3.17 Ethical AI & responsible development
- 3.17.1 AI ethics framework implementation
- 3.17.2 Bias detection & mitigation strategies
- 3.17.3 Fairness & inclusive considerations
- 3.17.4 Transparency & explainability requirements
Chapter 4 Competitive Landscape, 2024
- 4.1 Introduction
- 4.2 Company market share analysis
- 4.2.1 North America
- 4.2.2 Europe
- 4.2.3 Asia Pacific
- 4.2.4 Latin America
- 4.2.5 Middle East & Africa
- 4.3 Competitive positioning matrix
- 4.4 Strategic outlook matrix
- 4.5 Key developments
- 4.5.1 Mergers & acquisitions
- 4.5.2 Partnerships & collaborations
- 4.5.3 New product launches
- 4.5.4 Expansion plans and funding
Chapter 5 Market Estimates & Forecast, By Agent, 2021 - 2034 ($Bn)
- 5.1 Key trends
- 5.2 Virtual Assistants (VA)
- 5.3 Conversational Customer Agents
- 5.4 Digital Workers
- 5.5 Decision-Support
- 5.6 Others
Chapter 6 Market Estimates & Forecast, By System, 2021 - 2034 ($Bn)
- 6.1 Key trends
- 6.2 Single agent
- 6.3 Multi agent
Chapter 7 Market Estimates & Forecast, By Autonomy Level, 2021 - 2034 ($Bn)
- 7.1 Key trends
- 7.2 Semi-autonomous
- 7.3 Fully autonomous
- 7.4 Assistive (Human-in-the-loop)
Chapter 8 Market Estimates & Forecast, By Technology, 2021 - 2034 ($Bn)
- 8.1 Key trends
- 8.2 Machine Learning (ML)
- 8.3 Natural Language Processing
- 8.4 Computer Vision
- 8.5 Robotics Process Automation (RPA)
- 8.6 Cognitive Computing
- 8.7 Others
Chapter 9 Market Estimates & Forecast, By End Use, 2021 - 2034 ($Bn)
- 9.1 Key trends
- 9.2 Banking, Financial Services & Insurance (BFSI)
- 9.3 Healthcare & Life Sciences
- 9.4 Retail & e-commerce
- 9.5 Media & Entertainment
- 9.6 Manufacturing
- 9.7 Government & Public Sector
- 9.8 Education
- 9.9 Transportation & Logistics
- 9.10 Energy & Utilities
- 9.11 Others
Chapter 10 Market Estimates & Forecast, By Region, 2021 - 2034 ($Bn)
- 10.1 North America
- 10.1.1 US
- 10.1.2 Canada
- 10.2 Europe
- 10.2.1 UK
- 10.2.2 Germany
- 10.2.3 France
- 10.2.4 Italy
- 10.2.5 Spain
- 10.2.6 Belgium
- 10.2.7 Netherlands
- 10.2.8 Sweden
- 10.3 Asia Pacific
- 10.3.1 China
- 10.3.2 India
- 10.3.3 Japan
- 10.3.4 Australia
- 10.3.5 Singapore
- 10.3.6 South Korea
- 10.3.7 Vietnam
- 10.3.8 Indonesia
- 10.4 Latin America
- 10.4.1 Brazil
- 10.4.2 Mexico
- 10.4.3 Argentina
- 10.5 MEA
- 10.5.1 South Africa
- 10.5.2 Saudi Arabia
- 10.5.3 UAE
Chapter 11 Company Profiles
- 11.1 Global players
- 11.1.1 OpenAI
- 11.1.2 Microsoft
- 11.1.3 Google
- 11.1.4 Amazon Web Services
- 11.1.5 IBM
- 11.1.6 Anthropic
- 11.1.7 Salesforce
- 11.1.8 Meta Platforms
- 11.1.9 NVIDIA
- 11.1.10 Oracle
- 11.2 Regional players
- 11.2.1 UiPath
- 11.2.2 Automation Anywhere
- 11.2.3 ServiceNow
- 11.2.4 Baidu
- 11.2.5 Alibaba Cloud
- 11.2.6 Tencent
- 11.2.7 SAP
- 11.2.8 Palantir Technologies
- 11.2.9 DataRobot
- 11.2.10 H2O.ai
- 11.3 Emerging players
- 11.3.1 Cohere
- 11.3.2 Stability AI
- 11.3.3 Hugging Face
- 11.3.4 Adept AI
- 11.3.5 Character.AI
- 11.3.6 Jasper AI
- 11.3.7 Copy.ai
- 11.3.8 Rasa
- 11.3.9 Moveworks
- 11.3.10 Avanade