


 |
市場調查報告書
商品編碼
1844294
被動紅外線感測器市場機會、成長動力、產業趨勢分析及2025-2034年預測Passive Infrared Sensors Market Opportunity, Growth Drivers, Industry Trend Analysis, and Forecast 2025 - 2034 |
||||||
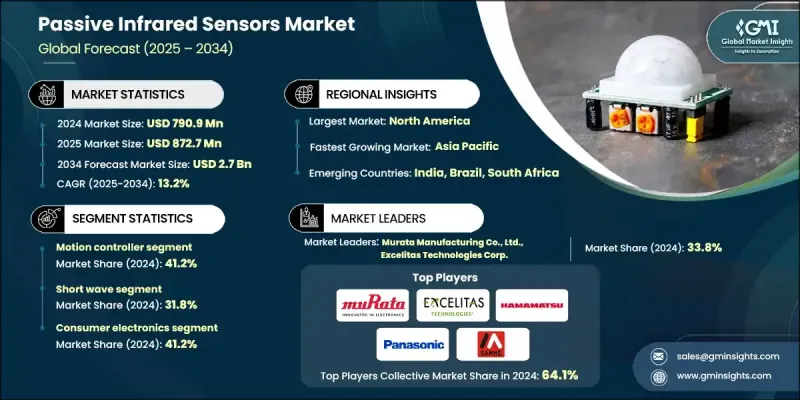
2024 年全球被動紅外線感測器市場價值為 7.909 億美元,預計到 2034 年將以 13.2% 的複合年成長率成長至 27 億美元。
智慧家庭自動化的日益普及是推動這一成長的關鍵因素之一。隨著消費者在連網裝置上的投資不斷增加,對 PIR 感測器的需求激增,因為這些感測器對於在智慧照明系統、安全警報和 HVAC(暖氣、通風和空調)應用中實現運動偵測至關重要。 PIR 感測器以其低功耗和可靠的運動偵測功能而聞名,正成為提升便利性、安全性和能源效率不可或缺的一部分。語音助理和物聯網設備的興起進一步擴展了 PIR 感測器在提供無縫自動化的多功能設備中的應用。此外,全球對永續性和能源效率的重視促進了 PIR 感測器在節能建築解決方案中的應用。這些感測器透過偵測人體存在並減少不必要的能源消耗,有助於最佳化照明、暖氣和冷氣系統的控制。隨著各國政府實施更嚴格的能源效率法規以及企業採用綠建築認證,這一趨勢尤其重要。
| 市場範圍 | |
|---|---|
| 起始年份 | 2024 |
| 預測年份 | 2025-2034 |
| 起始值 | 7.909億美元 |
| 預測值 | 27億美元 |
| 複合年成長率 | 13.2% |
運動控制器市場佔41.2%的市場佔有率,2024年價值3.26億美元。運動控制器因其在安防系統、照明控制和能源管理解決方案中的關鍵作用,繼續主導PIR感測器市場。其價格實惠、功耗低且易於整合,使其成為住宅、商業和工業應用中的必備產品。
2024年,長波PIR感測器市場規模達3.823億美元。長波PIR感測器在戶外和大面積應用領域需求旺盛,例如周界安防、軍事監視、交通監控和智慧城市基礎設施。人們對先進安防系統、公共安全和國防現代化的日益關注,正在推動該領域的擴張。希望保持市場領先地位的公司應優先開發具有增強連接性、降低誤報率和提高性能的遠端感測器,以滿足大型基礎設施和國防專案的需求。
2024年,美國被動紅外線感測器市場規模達2.458億美元,複合年成長率達14%,這得益於家庭自動化的蓬勃發展、先進安防系統需求的不斷成長以及智慧基礎設施項目的興起。智慧家庭的普及、能源效率的日益提升以及政府推動永續建築實踐的激勵措施,都在加速PIR感測器在各個領域的應用。此外,美國國防和航太工業的蓬勃發展,也推動了用於監控和監測應用的高性能PIR感測器需求的不斷成長。
全球被動紅外線感測器市場的主要參與者包括通用動力公司、博世安防系統有限責任公司、霍尼韋爾國際公司、賽普拉斯半導體公司、Elmos 半導體公司、安訊士公司、意法半導體公司、松下控股公司、Excelitas Technologies Corp.、愛特梅爾公司、村田製作所、濱松光子學株式會、日本航空儀社和日本航空公司(Eyocom 商社、濱松光子學株式會和日本航空公司和日本航空公司。被動紅外線感測器市場的公司正在採用幾種關鍵策略來鞏固其市場地位。這些策略包括投資於創新感測器技術的開發、專注於提高感測器性能和提高能源效率。公司也在擴大其產品組合,以滿足對先進 PIR 感測器日益成長的需求,特別是在智慧家庭、安全和能源管理等應用領域。另一個重要策略是建立策略夥伴關係和合作關係,以進入新市場並分享技術專長。
目錄
第1章:方法論與範圍
第2章:執行摘要
第3章:行業洞察
- 產業生態系統分析
- 供應商概況
- 利潤率
- 成本結構
- 每個階段的增值
- 影響價值鏈的因素
- 中斷
- 產業衝擊力
- 成長動力
- 智慧家庭自動化的普及率不斷提高
- 對節能建築解決方案的需求不斷成長
- 物聯網和連接設備的擴展
- 安全和監控要求不斷提高
- 汽車駕駛輔助系統的成長
- 產業陷阱與挑戰
- 惡劣環境下的感測器精度問題
- 來自替代感測技術的競爭日益激烈
- 成長動力
- 成長潛力分析
- 監管格局
- 北美洲
- 歐洲
- 亞太地區
- 拉丁美洲
- 中東和非洲
- 波特的分析
- PESTEL分析
- 技術和創新格局
- 當前的技術趨勢
- 新興技術
- 價格趨勢
- 歷史價格分析(2021-2024)
- 價格趨勢促進因素
- 區域價格差異
- 價格預測(2025-2034)
- 定價策略
- 新興商業模式
- 合規性要求
- 永續性措施
- 永續材料評估
- 碳足跡分析
- 循環經濟實施
- 永續性認證和標準
- 永續性投資報酬率分析
- 全球消費者情緒分析
- 專利分析
第4章:競爭格局
- 介紹
- 公司市佔率分析
- 按地區
- 北美洲
- 歐洲
- 亞太地區
- 拉丁美洲
- 中東和非洲
- 市場集中度分析
- 按地區
- 關鍵參與者的競爭基準
- 財務績效比較
- 收入
- 利潤率
- 研發
- 產品組合比較
- 產品範圍廣度
- 科技
- 創新
- 地理位置比較
- 全球足跡分析
- 服務網路覆蓋
- 各地區市場滲透率
- 競爭定位矩陣
- 領導者
- 挑戰者
- 追蹤者
- 利基市場參與者
- 戰略展望矩陣
- 財務績效比較
- 2021-2024 年關鍵發展
- 併購
- 夥伴關係與合作
- 技術進步
- 擴張和投資策略
- 永續發展舉措
- 數位轉型舉措
- 新興/新創企業競爭對手格局
第5章:市場估計與預測:按設備,2021 - 2034 年
- 主要趨勢
- 煙霧偵測器
- 熱探測器
- 運動控制器
- 其他設備
第6章:市場估計與預測:按範圍,2021 - 2034
- 主要趨勢
- 短波被動紅外線感測器
- 中波被動紅外線感測器
- 長波被動紅外線感測器
第7章:市場估計與預測:按應用,2021 - 2034
- 主要趨勢
- 消費性電子產品
- 智慧型手機和智慧型行動裝置
- 相機
- 其他電子
- 衛生保健
- 病人監護系統
- 發熱篩檢設備
- 睡眠追蹤系統
- 紅外線溫度計
- 其他
- 工業的
- 汽車
- 國防和航太
第8章:市場估計與預測:按地區,2021 - 2034 年
- 主要趨勢
- 北美洲
- 美國
- 加拿大
- 歐洲
- 德國
- 英國
- 法國
- 西班牙
- 義大利
- 荷蘭
- 亞太地區
- 中國
- 印度
- 日本
- 澳洲
- 韓國
- 拉丁美洲
- 巴西
- 墨西哥
- 阿根廷
- 中東和非洲
- 沙烏地阿拉伯
- 南非
- 阿拉伯聯合大公國
第9章:公司簡介
- Atmel Corporation
- Axis Communications AB
- Bosch Security Systems, LLC
- Current Corporation
- Cypress Semiconductor
- Elmos Semiconductor
- Epson Toyocom Corporation
- Excelitas Technologies Corp.
- General Dynamics Corporation
- Hamamatsu Photonics KK
- Honeywell International Inc.
- Murata Manufacturing Co., Ltd.
- Ningbo Sanhe Sensor Co., Ltd.
- Nippon Avionics Co., Ltd
- Panasonic Holdings Corporation
- STMicroelectronics NV
The Global Passive Infrared Sensors Market was valued at USD 790.9 million in 2024 and is estimated to grow at a CAGR of 13.2% to reach USD 2.7 billion by 2034.
The increasing popularity of smart home automation is one of the key factors driving this growth. As consumers invest more in connected devices, the demand for PIR sensors has surged, as these sensors are essential for enabling motion detection in smart lighting systems, security alarms, and HVAC (heating, ventilation, and air conditioning) applications. PIR sensors, known for their low power consumption and reliable motion-detection capabilities, are becoming integral to enhance convenience, security, and energy efficiency. The rise of voice assistants and IoT devices further expands the use of PIR sensors in multifunctional devices that offer seamless automation. Additionally, the global emphasis on sustainability and energy efficiency has promoted the adoption of PIR sensors in energy-saving building solutions. These sensors help optimize the control of lighting, heating, and cooling systems by detecting human presence and reducing unnecessary energy use. This trend is particularly important as governments implement stricter energy efficiency regulations and companies adopt green building certifications.
| Market Scope | |
|---|---|
| Start Year | 2024 |
| Forecast Year | 2025-2034 |
| Start Value | $790.9 Million |
| Forecast Value | $2.7 Billion |
| CAGR | 13.2% |
The motion controller segment held a 41.2% share and was valued at USD 326 million in 2024. Motion controllers continue to dominate the PIR sensor market due to their crucial role in security systems, lighting control, and energy management solutions. Their affordability, low power usage, and easy integration make them essential in residential, commercial, and industrial applications.
The long-wave PIR sensor segment generated USD 382.3 million in 2024. Long-wave PIR sensors are in high demand for outdoor and large-area applications, such as perimeter security, military surveillance, traffic monitoring, and smart city infrastructure. The growing focus on advanced security systems, public safety, and defense modernization is driving this segment's expansion. Companies looking to maintain leadership in the market should prioritize the development of long-range sensors with enhanced connectivity, reduced false alarms, and higher performance to cater to large-scale infrastructure and defense projects.
United States Passive Infrared Sensors Market generated USD 245.8 million in 2024, with a CAGR of 14% fueled by a surge in home automation, the increasing demand for advanced security systems, and a rise in smart infrastructure projects. The adoption of smart homes, a heightened focus on energy efficiency, and government incentives promoting sustainable building practices are all accelerating the use of PIR sensors in various sectors. Additionally, the strong U.S. defense and aerospace industries contribute to the growing demand for high-performance PIR sensors used in surveillance and monitoring applications.
Key players operating in the Global Passive Infrared Sensors Market include General Dynamics Corporation, Bosch Security Systems, LLC, Honeywell International Inc., Cypress Semiconductor, Elmos Semiconductor, Axis Communications AB, STMicroelectronics N.V., Panasonic Holdings Corporation, Excelitas Technologies Corp., Atmel Corporation, Murata Manufacturing Co., Ltd., Hamamatsu Photonics K.K., Ningbo Sanhe Sensor Co., Ltd., Espon Toyocom Corporation, and Nippon Avionics Co., Ltd. Companies in the Passive Infrared Sensors Market are employing several key strategies to solidify their market position. These strategies include investing in the development of innovative sensor technologies, focusing on improving sensor performance, and enhancing energy efficiency. Firms are also expanding their product portfolios to meet the growing demand for advanced PIR sensors, especially in applications such as smart homes, security, and energy management. Another important strategy is forming strategic partnerships and collaborations to access new markets and share technological expertise.
Table of Contents
Chapter 1 Methodology and Scope
- 1.1 Market scope and definition
- 1.2 Research design
- 1.2.1 Research approach
- 1.2.2 Data collection methods
- 1.3 Data mining sources
- 1.3.1 Global
- 1.3.2 Regional/Country
- 1.4 Base estimates and calculations
- 1.4.1 Base year calculation
- 1.4.2 Key trends for market estimation
- 1.5 Primary research and validation
- 1.5.1 Primary sources
- 1.6 Forecast model
- 1.7 Research assumptions and limitations
Chapter 2 Executive Summary
- 2.1 Industry snapshot
- 2.2 Key market trends
- 2.2.1 Packaging type trends
- 2.2.2 Material trends
- 2.2.3 Application trends
- 2.2.4 Regional
- 2.3 TAM Analysis, 2025-2034 (USD Billion)
- 2.4 CXO perspectives: Strategic imperatives
- 2.4.1 Executive decision points
- 2.4.2 critical success factors
- 2.5 Future outlook and strategic recommendations
Chapter 3 Industry Insights
- 3.1 Industry ecosystem analysis
- 3.1.1 Supplier Landscape
- 3.1.2 Profit Margin
- 3.1.3 Cost structure
- 3.1.4 Value addition at each stage
- 3.1.5 Factor affecting the value chain
- 3.1.6 Disruptions
- 3.2 Industry impact forces
- 3.2.1 Growth drivers
- 3.2.1.1 Growing adoption of smart home automation
- 3.2.1.2 Rising need for energy-efficient building solutions
- 3.2.1.3 Expansion of IoT and connected devices
- 3.2.1.4 Increasing security and surveillance requirements
- 3.2.1.5 Growth in automotive driver assistance systems
- 3.2.2 Industry pitfalls and challenges
- 3.2.2.1 Sensor accuracy issues in harsh environments
- 3.2.2.2 Rising competition from alternative sensing technologies
- 3.2.1 Growth drivers
- 3.3 Growth potential analysis
- 3.4 Regulatory landscape
- 3.4.1 North America
- 3.4.2 Europe
- 3.4.3 Asia Pacific
- 3.4.4 Latin America
- 3.4.5 Middle East & Africa
- 3.5 Porter’s analysis
- 3.6 PESTEL analysis
- 3.7 Technology and innovation landscape
- 3.7.1 Current technological trends
- 3.7.2 Emerging technologies
- 3.8 Price trends
- 3.8.1 Historical price analysis (2021-2024)
- 3.8.2 Price trend drivers
- 3.8.3 Regional price variations
- 3.8.4 Price forecast (2025-2034)
- 3.9 Pricing strategies
- 3.10 Emerging business models
- 3.11 Compliance requirements
- 3.12 Sustainability measures
- 3.12.1 Sustainable materials assessment
- 3.12.2 Carbon footprint analysis
- 3.12.3 Circular economy implementation
- 3.12.4 Sustainability certifications and standards
- 3.12.5 Sustainability ROI analysis
- 3.13 Global consumer sentiment analysis
- 3.14 Patent analysis
Chapter 4 Competitive Landscape, 2024
- 4.1 Introduction
- 4.2 Company market share analysis
- 4.2.1 By region
- 4.2.1.1 North America
- 4.2.1.2 Europe
- 4.2.1.3 Asia Pacific
- 4.2.1.4 Latin America
- 4.2.1.5 Middle East & Africa
- 4.2.2 Market Concentration Analysis
- 4.2.1 By region
- 4.3 Competitive benchmarking of key players
- 4.3.1 Financial performance comparison
- 4.3.1.1 Revenue
- 4.3.1.2 Profit margin
- 4.3.1.3 R&D
- 4.3.2 Product portfolio comparison
- 4.3.2.1 Product range breadth
- 4.3.2.2 Technology
- 4.3.2.3 Innovation
- 4.3.3 Geographic presence comparison
- 4.3.3.1 Global footprint analysis
- 4.3.3.2 Service network coverage
- 4.3.3.3 Market penetration by region
- 4.3.4 Competitive positioning matrix
- 4.3.4.1 Leaders
- 4.3.4.2 Challengers
- 4.3.4.3 Followers
- 4.3.4.4 Niche players
- 4.3.5 Strategic outlook matrix
- 4.3.1 Financial performance comparison
- 4.4 Key developments, 2021-2024
- 4.4.1 Mergers and acquisitions
- 4.4.2 Partnerships and collaborations
- 4.4.3 Technological advancements
- 4.4.4 Expansion and investment strategies
- 4.4.5 Sustainability initiatives
- 4.4.6 Digital transformation initiatives
- 4.5 Emerging/ startup competitors landscape
Chapter 5 Market Estimates and Forecast, By Device, 2021 - 2034 (USD Million & Units)
- 5.1 Key trends
- 5.2 Smoke detector
- 5.3 Heat detector
- 5.4 Motion controller
- 5.5 Other devices
Chapter 6 Market Estimates and Forecast, By Range, 2021 - 2034 (USD Million & Units)
- 6.1 Key trends
- 6.2 Short wave passive infrared sensor
- 6.3 Mid wave passive infrared sensor
- 6.4 Long wave passive infrared sensor
Chapter 7 Market Estimates and Forecast, By Application, 2021 - 2034 (USD Million & Units)
- 7.1 Key trends
- 7.2 Consumer electronics
- 7.2.1 Smartphones and smart mobile devices
- 7.2.2 Cameras
- 7.2.3 Other electronic
- 7.3 Healthcare
- 7.3.1 Patient monitoring systems
- 7.3.2 Fever screening devices
- 7.3.3 Sleep tracking systems
- 7.3.4 Infrared thermometers
- 7.3.5 Others
- 7.4 Industrial
- 7.5 Automotive
- 7.6 Defense and aerospace
Chapter 8 Market Estimates and Forecast, By Region, 2021 - 2034 (USD Million & Units)
- 8.1 Key trends
- 8.2 North America
- 8.2.1 U.S.
- 8.2.2 Canada
- 8.3 Europe
- 8.3.1 Germany
- 8.3.2 UK
- 8.3.3 France
- 8.3.4 Spain
- 8.3.5 Italy
- 8.3.6 Netherlands
- 8.4 Asia Pacific
- 8.4.1 China
- 8.4.2 India
- 8.4.3 Japan
- 8.4.4 Australia
- 8.4.5 South Korea
- 8.5 Latin America
- 8.5.1 Brazil
- 8.5.2 Mexico
- 8.5.3 Argentina
- 8.6 Middle East and Africa
- 8.6.1 Saudi Arabia
- 8.6.2 South Africa
- 8.6.3 UAE
Chapter 9 Company Profiles
- 9.1 Atmel Corporation
- 9.2 Axis Communications AB
- 9.3 Bosch Security Systems, LLC
- 9.4 Current Corporation
- 9.5 Cypress Semiconductor
- 9.6 Elmos Semiconductor
- 9.7 Epson Toyocom Corporation
- 9.8 Excelitas Technologies Corp.
- 9.9 General Dynamics Corporation
- 9.10 Hamamatsu Photonics K.K.
- 9.11 Honeywell International Inc.
- 9.12 Murata Manufacturing Co., Ltd.
- 9.13 Ningbo Sanhe Sensor Co., Ltd.
- 9.14 Nippon Avionics Co., Ltd
- 9.15 Panasonic Holdings Corporation
- 9.16 STMicroelectronics N.V
 紅外線檢測器市場報告:按類型、波長範圍、技術、應用和地區分類(2026-2034 年)
 PIR運動偵測器市場按技術、安裝方式、電源、安裝方式、最終用戶和應用分類-全球預測,2026-2032年
 紅外線檢測器市場分析及預測(至2035年):按類型、產品類型、技術、應用、材質、最終用戶、功能、安裝類型、設備和模式分類被動式紅外線偵測器市場分析及預測(至2035年):按類型、產品類型、技術、組件、應用、形狀、材質、設備、部署模式和最終用戶分類工業用PIR探測器市場按技術、產品類型、安裝方式、終端用戶產業和銷售管道-全球預測,2026-2032年按類型、技術、最終用戶、應用程式和銷售管道分類的PbS紅外線檢測器陣列市場,全球預測,2026-2032年雙色紅外線檢測器市場:按檢測器類型、冷卻方式、波長範圍、應用和最終用戶行業分類——2026-2032年全球預測
 紅外線探測器市場-全球產業規模、佔有率、趨勢、機會及預測(依技術類型、光譜範圍、終端用戶產業、區域及競爭格局分類,2021-2031年預測)日本紅外線探測器市場報告(按類型、光譜範圍、技術(碲鎘汞、砷化銦鎵、熱釋電、熱電堆、微測輻射熱計及其他)、應用和地區分類,2026-2034年)
 紅外線檢測器市場規模、佔有率和成長分析(按類型、波長、技術、產業垂直領域、應用和地區分類)-2026-2033年產業預測