

 |
市場調查報告書
商品編碼
1844290
智慧塵埃市場機會、成長動力、產業趨勢分析及 2025 - 2034 年預測Smart Dust Market Opportunity, Growth Drivers, Industry Trend Analysis, and Forecast 2025 - 2034 |
||||||
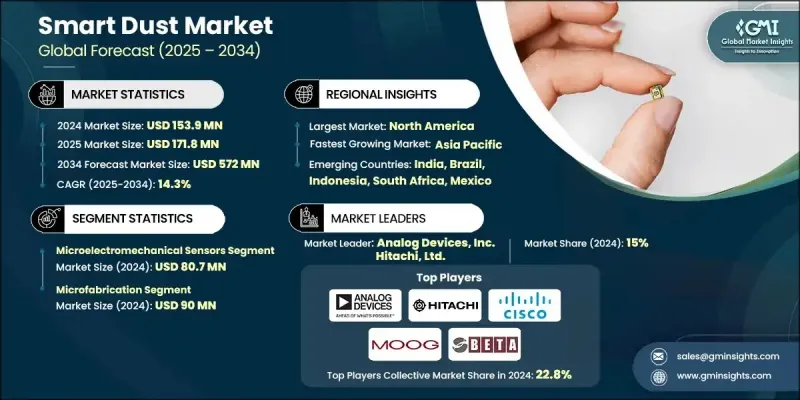
2024 年全球智慧塵埃市場價值為 1.539 億美元,預計到 2034 年將以 14.3% 的複合年成長率成長至 5.72 億美元。
這一成長得益於幾個關鍵因素,包括電子設備和感測器的小型化、工業物聯網生態系統中部署的不斷增加、環境監測需求的不斷成長、無線通訊技術的突破以及醫療保健和生物醫學應用的創新。隨著感測器和電子元件尺寸的不斷縮小,智慧微塵網路的功能正在向多個領域擴展。國家層級對微電子技術的投入正在推動超緊湊感測技術的生產。在醫療保健領域,對醫學研究的投資為可植入和穿戴式微型感測器開闢了新的可能性。在智慧微塵系統中引入人工智慧和機器學習是一項重大進展,它實現了本地化資料處理,並減少了對持續外部通訊的依賴。基於人工智慧的智慧微塵現在可以進行自主決策、執行即時分析並檢測操作異常。這些特性使智慧微塵特別適用於工業自動化、科學研究和遠端現場操作等對時間敏感的應用,在這些應用中,邊緣智慧和超低延遲至關重要。
| 市場範圍 | |
|---|---|
| 起始年份 | 2024 |
| 預測年份 | 2025-2034 |
| 起始值 | 1.539億美元 |
| 預測值 | 5.72億美元 |
| 複合年成長率 | 14.3% |
2024年,微機電感測器 (MEMS) 市場規模達到8,070萬美元。隨著導航、瞄準和態勢感知等國防應用對緊湊型節能感測器的需求不斷成長,該市場將持續成長。 MEMS在空中和地面無人系統中的應用,使其能夠在惡劣條件下實現更好的環境感知和可靠的通訊。企業要想在該領域保持競爭力,就需要開發具有更高靈敏度、更耐用性和更低功耗的國防級MEMS解決方案,以滿足嚴格的政府標準並獲得高價值的國防合約。
2024年,微加工領域的市場價值達9,000萬美元。隨著對微型電子產品和整合感測器的國防設備的需求不斷成長,微加工技術正在推動緊湊型高精度系統的進步。這些改進正在賦能能源生產、士兵穿戴技術和自主感測器等領域的新功能。為了滿足產業預期,製造商正在投資高性能微加工技術,這些技術經過專門設計,能夠承受軍事環境,同時滿足監管要求。
2024年,美國智慧塵埃市場價值5,230萬美元,這得益於戰略國防專案對用於即時監控和戰場分析的智慧塵埃系統的投資。美國正在投資智慧塵埃平台,這些平台能夠在不危及人員生命的情況下,從危險或偏遠地區傳輸關鍵資料。瞄準美國市場的製造商必須專注於開發安全、堅固耐用且高度可擴展的系統,這些系統必須與國防基礎設施相容,並能適應嚴苛的現場條件。
全球智慧塵埃產業的主要參與者包括霍尼韋爾國際公司、穆格公司、英特爾公司、博世感測器技術有限公司、通用電氣公司、Lightricity 有限公司、德州儀器公司、高通科技公司、日立有限公司、EnOcean 有限公司、Smartdust Solutions 有限公司、TE Connectivity 有限公司、意控股公司、BARM 控股半導體公司公司、思科系統公司、安森美半導體、ABB 有限公司、博通公司、Sonardyne 國際有限公司、亞德諾公司、挪威科技工業聯合會 (SINTEF) 和國際商業機器公司。為了在智慧塵埃市場建立和維持競爭優勢,各公司正在優先開發具有嵌入式人工智慧和即時處理能力的超低功耗、緊湊型感測器系統。他們正在投資先進的微製造技術,以生產高性能環境的國防級和醫療級組件。與政府機構、研發機構和行業參與者建立策略合作夥伴關係正在幫助製造商進入新市場並獲得長期合約。
目錄
第1章:方法論與範圍
第2章:執行摘要
第3章:行業洞察
- 產業生態系統分析
- 供應商格局
- 利潤率
- 成本結構
- 每個階段的增值
- 影響價值鏈的因素
- 中斷
- 產業衝擊力
- 成長動力
- 感測器和電子設備的小型化
- 工業物聯網 (IIoT) 的採用率不斷上升
- 無線通訊協定的進步
- 醫療保健和生物醫學創新
- 日益成長的環境監測需求
- 陷阱與挑戰
- 高昂的實施和整合成本
- 資料安全和隱私問題
- 成長動力
- 成長潛力分析
- 監管格局
- 北美洲
- 歐洲
- 亞太地區
- 拉丁美洲
- 中東和非洲
- 波特的分析
- PESTEL分析
- 技術和創新格局
- 當前的技術趨勢
- 新興技術
- 新興商業模式
- 合規性要求
- 專利和智慧財產權分析
- 地緣政治與貿易動態
第4章:競爭格局
- 介紹
- 公司市佔率分析
- 按地區
- 北美洲
- 歐洲
- 亞太地區
- 拉丁美洲
- 中東和非洲
- 市場集中度分析
- 按地區
- 關鍵參與者的競爭基準
- 財務績效比較
- 收入
- 利潤率
- 研發
- 產品組合比較
- 產品範圍廣度
- 科技
- 創新
- 地理位置比較
- 全球足跡分析
- 服務網路覆蓋
- 各地區市場滲透率
- 競爭定位矩陣
- 領導者
- 挑戰者
- 追蹤者
- 利基市場參與者
- 戰略展望矩陣
- 財務績效比較
- 2021-2024 年關鍵發展
- 併購
- 夥伴關係與合作
- 技術進步
- 擴張和投資策略
- 永續發展舉措
- 數位轉型舉措
- 新興/新創企業競爭對手格局
第5章:市場估計與預測:按類型,2021 - 2034
- 主要趨勢
- 微機電感測器
- 機器人
- 其他
第6章:市場估計與預測:按組件,2021 - 2034
- 主要趨勢
- 感應器
- 電源單元
- 類比和數位 I/O 模組
- 訊號處理單元
- 控制電路
- 光傳輸模組
- 射頻模組
- 其他
第7章:市場估計與預測:按製造程序,2021-2034 年
- 主要趨勢
- 3D列印
- 微加工
第 8 章:市場估計與預測:按最終用途應用,2021 - 2034 年
- 主要趨勢
- 軍事和國防
- 監視和偵察
- 戰鬥態勢感知
- 邊境監控和追蹤
- 其他
- 醫療保健和生命科學
- 病人監護
- 生物醫學研究
- 其他
- 製造業和工業
- 製程控制自動化
- 預測性維護
- 其他
- 電信和IT
- 能源和公用事業
- 農業
- 航太和研究機構
- 其他
第9章:市場估計與預測:按地區,2021 - 2034
- 主要趨勢
- 北美洲
- 美國
- 加拿大
- 歐洲
- 德國
- 英國
- 法國
- 西班牙
- 義大利
- 荷蘭
- 亞太地區
- 中國
- 印度
- 日本
- 澳洲
- 韓國
- 拉丁美洲
- 巴西
- 墨西哥
- 阿根廷
- 中東和非洲
- 沙烏地阿拉伯
- 南非
- 阿拉伯聯合大公國
第10章:公司簡介
- 全球關鍵參與者
- Texas Instruments Inc.
- IBM Corporation
- Analog Devices, Inc.
- Intel Corporation
- Honeywell International Inc.
- 區域關鍵參與者
- 北美洲
- Broadcom Inc.
- Moog Inc.
- BetaBatt, Inc..
- 歐洲
- STMicroelectronics NV
- TE Connectivity Ltd.
- EnOcean GmbH
- SINTEF
- Asia-Pacific
- Hitachi, Ltd.
- NXP Semiconductors NV
- Bosch Sensortec GmbH
- 北美洲
- 顛覆者/利基市場參與者
- ARM Holdings plc
- Smartdust Solutions Ltd.
- Lightricity Ltd.
- CubeWorks, Inc.
- Sonardyne International Limited
- General Electric Company
- Cisco Systems, Inc.
- Onsemi
The Global Smart Dust Market was valued at USD 153.9 million in 2024 and is estimated to grow at a CAGR of 14.3% to reach USD 572 million by 2034.
The growth is owing to several key factors, including miniaturization of electronics and sensors, rising deployment in industrial IoT ecosystems, growing demand for environmental monitoring, breakthroughs in wireless communication technologies, and innovation in healthcare and biomedical applications. As sensor and electronics components continue to shrink in size, the capabilities of smart dust networks are expanding across multiple sectors. National-level investments in microelectronics are encouraging the production of ultra-compact sensing technologies. In the healthcare sector, investments in medical research are opening new possibilities for implantable and wearable micro-sensors. The introduction of artificial intelligence and machine learning within smart dust systems is a major development, enabling localized data processing and reducing reliance on continuous external communication. AI-powered smart dust can now carry out autonomous decision-making, perform real-time analytics, and detect operational anomalies. These features make smart dust especially suitable for time-sensitive applications across industrial automation, scientific research, and remote field operations where edge intelligence and ultra-low latency are critical.
| Market Scope | |
|---|---|
| Start Year | 2024 |
| Forecast Year | 2025-2034 |
| Start Value | $153.9 million |
| Forecast Value | $572 million |
| CAGR | 14.3% |
The microelectromechanical sensors (MEMS) segment generated USD 80.7 million in 2024. This segment continues to grow on the back of increased demand for compact, energy-saving sensors in defense applications such as navigation, targeting, and situational awareness. The adoption of MEMS in aerial and ground-based unmanned systems is enabling better environmental sensing and reliable communication under harsh conditions. For companies to remain competitive in this space, they need to develop defense-grade MEMS solutions with enhanced sensitivity, durability, and minimal energy consumption to meet stringent government standards and secure high-value defense contracts.
The microfabrication segment was valued at USD 90 million in 2024. With growing demand for miniaturized electronics and sensor-integrated defense equipment, microfabrication is driving advances in compact, high-precision systems. These improvements are enabling new capabilities in energy generation, soldier-wearable tech, and autonomous sensors. To meet industry expectations, manufacturers are investing in high-performance microfabrication technologies that are specifically engineered to withstand military environments while also meeting regulatory requirements.
U.S. Smart Dust Market was valued at USD 52.3 million in 2024, fueled by strategic defense programs investing in smart dust systems for real-time surveillance and battlefield analytics. The country is investing in smart dust platforms that can deliver critical data from dangerous or remote locations without endangering human lives. Manufacturers targeting the U.S. market must focus on developing secure, rugged, and highly scalable systems that are compatible with national defense infrastructure and built for demanding field conditions.
Major players in the Global Smart Dust Industry include Honeywell International Inc., Moog Inc., Intel Corporation, Bosch Sensortec GmbH, General Electric Company, Lightricity Ltd., Texas Instruments Inc., Qualcomm Technologies, Inc., Hitachi, Ltd., EnOcean GmbH, Smartdust Solutions Ltd., TE Connectivity Ltd., STMicroelectronics N.V., ARM Holdings plc, NXP Semiconductors N.V., BetaBatt, Inc., Cisco Systems, Inc., onsemi, ABB Ltd., Broadcom Inc., Sonardyne International Limited, Analog Devices, Inc., Stiftelsen for industriell og teknisk forskning (SINTEF), and International Business Machines Corporation. To build and maintain a competitive edge in the smart dust market, companies are prioritizing the development of ultra-low-power, compact sensor systems with embedded AI and real-time processing capabilities. They are investing in advanced microfabrication to produce defense-grade and medical-grade components tailored for high-performance environments. Strategic partnerships with government agencies, R&D institutions, and industry players are helping manufacturers gain access to new markets and secure long-term contracts.
Table of Contents
Chapter 1 Methodology and scope
- 1.1 Market scope and definition
- 1.2 Research design
- 1.2.1 Research approach
- 1.2.2 Data collection methods
- 1.3 Data mining sources
- 1.3.1 Global
- 1.3.2 Regional/Country
- 1.4 Base estimates and calculations
- 1.4.1 Base year calculation
- 1.4.2 Key trends for market estimation
- 1.5 Primary research and validation
- 1.5.1 Primary sources
- 1.6 Forecast model
- 1.7 Research assumptions and limitations
Chapter 2 Executive summary
- 2.1 Industry 3600 synopsis
- 2.2 Key market trends
- 2.2.1 Type trend
- 2.2.2 Component trends
- 2.2.3 Manufacturing process trends
- 2.2.4 End use application trends
- 2.2.5 Regional trends
- 2.3 TAM Analysis, 2025-2034 (USD Billion)
- 2.4 CXO perspectives: Strategic imperatives
- 2.4.1 Executive decision points
- 2.4.2 critical success factors
- 2.5 Future outlook and strategic recommendations
Chapter 3 Industry insights
- 3.1 Industry ecosystem analysis
- 3.1.1 Supplier landscape
- 3.1.2 Profit margin
- 3.1.3 Cost structure
- 3.1.4 Value addition at each stage
- 3.1.5 Factor affecting the value chain
- 3.1.6 Disruptions
- 3.2 Industry impact forces
- 3.2.1 Growth drivers
- 3.2.1.1 The miniaturization of sensors and electronics
- 3.2.1.2 Rising adoption in industrial IoT (IIoT)
- 3.2.1.3 Advancements in wireless communication protocols
- 3.2.1.4 Healthcare and biomedical innovations
- 3.2.1.5 The growing environmental monitoring needs
- 3.2.2 Pitfalls and challenges
- 3.2.2.1 High Implementation and Integration Costs
- 3.2.2.2 Data Security and Privacy Concerns
- 3.2.1 Growth drivers
- 3.3 Growth potential analysis
- 3.4 Regulatory landscape
- 3.4.1 North America
- 3.4.2 Europe
- 3.4.3 Asia Pacific
- 3.4.4 Latin America
- 3.4.5 Middle East & Africa
- 3.5 Porter’s analysis
- 3.6 PESTEL analysis
- 3.7 Technology and innovation landscape
- 3.7.1 Current technological trends
- 3.7.2 Emerging technologies
- 3.8 Emerging business models
- 3.9 Compliance requirements
- 3.10 Patent and IP analysis
- 3.11 Geopolitical and trade dynamics
Chapter 4 Competitive landscape, 2024
- 4.1 Introduction
- 4.2 Company market share analysis
- 4.2.1 By region
- 4.2.1.1 North America
- 4.2.1.2 Europe
- 4.2.1.3 Asia Pacific
- 4.2.1.4 Latin America
- 4.2.1.5 Middle East & Africa
- 4.2.2 Market Concentration Analysis
- 4.2.1 By region
- 4.3 Competitive benchmarking of key players
- 4.3.1 Financial performance comparison
- 4.3.1.1 Revenue
- 4.3.1.2 Profit margin
- 4.3.1.3 R&D
- 4.3.2 Product portfolio comparison
- 4.3.2.1 Product range breadth
- 4.3.2.2 Technology
- 4.3.2.3 Innovation
- 4.3.3 Geographic presence comparison
- 4.3.3.1 Global footprint analysis
- 4.3.3.2 Service network coverage
- 4.3.3.3 Market penetration by region
- 4.3.4 Competitive positioning matrix
- 4.3.4.1 Leaders
- 4.3.4.2 Challengers
- 4.3.4.3 Followers
- 4.3.4.4 Niche players
- 4.3.5 Strategic outlook matrix
- 4.3.1 Financial performance comparison
- 4.4 Key developments, 2021-2024
- 4.4.1 Mergers and acquisitions
- 4.4.2 Partnerships and collaborations
- 4.4.3 Technological advancements
- 4.4.4 Expansion and investment strategies
- 4.4.5 Sustainability initiatives
- 4.4.6 Digital transformation initiatives
- 4.5 Emerging/ startup competitors landscape
Chapter 5 Market estimates and forecast, by Type, 2021 - 2034 (USD Million)
- 5.1 Key trends
- 5.2 Microelectromechanical Sensors
- 5.3 Robots
- 5.4 Others
Chapter 6 Market estimates and forecast, by Component, 2021 - 2034 (USD Million)
- 6.1 Key trends
- 6.2 Sensors
- 6.3 Power supply units
- 6.4 Analog and digital I/O modules
- 6.5 Signal processing units
- 6.6 Control circuitry
- 6.7 Optical transmission modules
- 6.8 Radio frequency modules
- 6.9 Others
Chapter 7 Market estimates and forecast, by Manufacturing Process, 2021 - 2034 (USD Million)
- 7.1 Key trends
- 7.2 3D Printing
- 7.3 Microfabrication
Chapter 8 Market estimates and forecast, by End Use Application, 2021 - 2034 (USD Million)
- 8.1 Key trends
- 8.2 Military and defense
- 8.2.1 Surveillance and reconnaissance
- 8.2.2 Combat situational awareness
- 8.2.3 Border monitoring and tracking
- 8.2.4 Others
- 8.3 Healthcare and life sciences
- 8.3.1 Patient monitoring
- 8.3.2 Biomedical research
- 8.3.3 Others
- 8.4 Manufacturing and industrial
- 8.4.1 Process control automation
- 8.4.2 Predictive maintenance
- 8.4.3 Others
- 8.5 Telecommunications and IT
- 8.6 Energy and utilities
- 8.7 Agriculture
- 8.8 Aerospace and research institutions
- 8.9 Others
Chapter 9 Market estimates and forecast, by Region, 2021 - 2034 (USD Million)
- 9.1 Key trends
- 9.2 North America
- 9.2.1 U.S.
- 9.2.2 Canada
- 9.3 Europe
- 9.3.1 Germany
- 9.3.2 UK
- 9.3.3 France
- 9.3.4 Spain
- 9.3.5 Italy
- 9.3.6 Netherlands
- 9.4 Asia Pacific
- 9.4.1 China
- 9.4.2 India
- 9.4.3 Japan
- 9.4.4 Australia
- 9.4.5 South Korea
- 9.5 Latin America
- 9.5.1 Brazil
- 9.5.2 Mexico
- 9.5.3 Argentina
- 9.6 Middle East and Africa
- 9.6.1 Saudi Arabia
- 9.6.2 South Africa
- 9.6.3 UAE
Chapter 10 Company profiles
- 10.1 Global Key Players
- 10.1.1 Texas Instruments Inc.
- 10.1.2 IBM Corporation
- 10.1.3 Analog Devices, Inc.
- 10.1.4 Intel Corporation
- 10.1.5 Honeywell International Inc.
- 10.2 Regional Key Players
- 10.2.1 North America
- 10.2.1.1 Broadcom Inc.
- 10.2.1.2 Moog Inc.
- 10.2.1.3 BetaBatt, Inc..
- 10.2.2 Europe
- 10.2.2.1 STMicroelectronics N.V.
- 10.2.2.2 TE Connectivity Ltd.
- 10.2.2.3 EnOcean GmbH
- 10.2.2.4 SINTEF
- 10.2.3 Asia-Pacific
- 10.2.3.1 Hitachi, Ltd.
- 10.2.3.2 NXP Semiconductors N.V.
- 10.2.3.3 Bosch Sensortec GmbH
- 10.2.1 North America
- 10.3 Disruptors / Niche Players
- 10.3.1 ARM Holdings plc
- 10.3.2 Smartdust Solutions Ltd.
- 10.3.3 Lightricity Ltd.
- 10.3.4 CubeWorks, Inc.
- 10.3.5 Sonardyne International Limited
- 10.3.6 General Electric Company
- 10.3.7 Cisco Systems, Inc.
- 10.3.8 Onsemi
 工業感測器網路市場預測至2034年—按組件、感測器類型、應用和區域分類的全球分析
 工業無線感測網路市場報告:按組件、感測器類型、應用、最終用途和地區分類(2026-2034 年)
 智慧粉塵市場(至 2035 年):依粉塵類型、組件、製造流程、最終用戶和地區劃分的產業趨勢和全球預測
 智慧微塵市場分析及預測(至2035年):依類型、產品類型、服務、技術、組件、應用、材質、設備及最終使用者分類無線感測網路市場分析及預測(至2035年):按類型、產品、服務、技術、組件、應用、部署、最終用戶和功能分類
 2026年全球無線感測網路網路市場報告
 工業無線感測網路市場 - 全球產業規模、佔有率、趨勢、機會及預測(按感測器、技術、產業垂直領域、地區和競爭格局分類,2021-2031年)
 工業無線感測器網路(IWSN)市場規模、佔有率和成長分析(按組件、感測器類型、應用、最終用戶和地區分類)—2026-2033年產業預測
 智慧灰塵感測器在家庭監測中的市場機會、成長促進因素、產業趨勢分析及預測(2025-2034年)
 全球智慧塵埃市場:2025年至2030年預測