


 |
市場調查報告書
商品編碼
1822612
浮動發電廠市場機會、成長動力、產業趨勢分析及 2025 - 2034 年預測Floating Power Plants Market Opportunity, Growth Drivers, Industry Trend Analysis, and Forecast 2025 - 2034 |
||||||
根據 Global Market Insights, Inc. 發布的最新報告,2024 年全球浮動電廠市場價值為 39 億美元,預計將從 2025 年的 42 億美元成長到 2034 年的 86 億美元,複合年成長率為 8.2%。
浮動電站 (FPP) 作為一種快速、可部署且靈活的能源選擇,正日益興起,以滿足水資源豐富但土地有限的地區的能源需求。這些電站能夠整合再生能源,降低輸電損耗,並調節負載需求,而無需佔用大量土地。
| 市場範圍 | |
|---|---|
| 起始年份 | 2024 |
| 預測年份 | 2025-2034 |
| 起始值 | 39億美元 |
| 預測值 | 86億美元 |
| 複合年成長率 | 8.2% |
關鍵促進因素:
1.重視再生能源整合:浮動太陽能/風能平台的出現使各國無需爭奪有限的土地資源即可實現清潔能源目標。
2.需要在近海和島嶼地區快速部署: FPP 無需電網擴展即可為弱勢的沿海和島嶼社區提供彈性能源的能力是不可估量的。
3.土地限制和水體利用問題:公共部門正在推動利用人工湖泊和水庫來生產清潔能源。
4.模組化和混合技術的進步:利用太陽能、風能和儲能的混合浮動生產平台的進步正在改變公用事業規模再生能源的實施。
關鍵參與者:
- 浮動電廠市場的 5 大領導者分別是中廣核新能源控股、塔塔電力、Ciel & Terre、SJVN 綠色能源和國家電力供應公共公司,佔 2024 年市場的約 42%。
- 西門子能源2025會計年度第三季財報顯示,該公司第三季財務業績表現強勁,營收年增13.5%,達113億美元。
- 2025年上半年,GE Vernova報告營收為171億美元。
- 2025年第三季度,川崎重工營收33億美元。
主要挑戰:
- 部署資本成本高:模組化的優勢降低了成本,但繫泊和安裝系統的成本仍然首次居高不下。
- 環境和監管要求:這包括與場地和環境問題相關的許可和水權,這些問題可能會影響部署,特別是在敏感的海洋棲息地。
- 各種極端天氣下的維護和繫泊:海上浮動結構需要隨時考慮海水腐蝕和風浪條件的影響。
1. 依能源類型分類-再生能源領先
再生浮動發電廠(尤其是太陽能和風能)在 2024 年佔據了市場佔有率的主導地位。日益嚴格的環境法規和脫碳目標正在推動公用事業公司朝向混合和太陽能主導的浮動發電技術邁進。
2. 按應用-人造水體處於最前沿
由於許可簡單且水位穩定,水庫、池塘、人工湖和運河等人工水體是最主要的部署地點。這些施工地點最大限度地減少了潮汐和風浪作用的潛在影響,從而確保了FPP的長期可行性。
3. 透過部署 - 模組化筏提供動員
模組化筏板系統是2024年市場上最主流的系統。它們透過標準化製造為單元提供移動性和可移動性,使其在公用事業規模的電網應用以及農村電氣化項目中都具有價值。這種方法的有效性也反映在維護成本更低、升級時間更短。
北美地區對清潔能源的雄心勃勃,被視為一個快速成長的市場。陸上和離岸風電(美國東海岸)、水庫浮動太陽能(加利福尼亞州、德克薩斯州)以及其他領域正在推動該地區浮動發電能力的成長。
浮動發電廠市場的主要供應商包括 BW Ideol、中廣核新能源控股、中國國家能源、Ciel & Terre、泰國電力局、Equinor、Floating Power Plant、GE Vernova、HEXA Renewables、Karadeniz Holding、川崎重工、MAN Energy Solutions、三菱重工、國家電力供應公共公司、Oteriz Holding、川崎重工、MAN Energy Solutions、三菱重工、國家電力供應公共公司、Oterizu Holding、Scoter、MAN Energy Solutions、三菱重工、全國電力供應Energy、Swimsol、塔塔電力、維斯塔斯和瓦錫蘭。
為了提升競爭力,領先的企業正強調混合系統、全球合作夥伴關係和可擴展的模組化設計。 BW Ideol 和 Equinor 正在歐洲和北美增加浮動式離岸風電裝置容量。 Karadeniz Holding 仍在向新興市場派遣其「動力船」用於緊急電源。 GE Vernova 和西門子能源正致力於將浮動式再生能源與燃氣渦輪機和電池儲能系統結合。維斯塔斯和三菱重工之間的合作正在推動風力渦輪機整合浮動平台的發展。各企業也正在進軍人工水體領域,依照當地法規和氣候要求進行在地化部署。
目錄
第1章:方法論與範圍
第2章:執行摘要
第3章:行業洞察
- 產業生態系統分析
- 原料可用性和採購分析
- 製造能力評估
- 供應鏈彈性和風險因素
- 配電網路分析
- 監管格局
- 產業衝擊力
- 成長動力
- 產業陷阱與挑戰
- 成長潛力分析
- 波特的分析
- PESTEL分析
- 浮動電站成本結構分析
- 價格趨勢分析
- 按地區
- 按容量
- 新興機會和趨勢
- 數位化和物聯網整合
- 新興市場滲透
- 投資分析及未來展望
第4章:競爭格局
- 介紹
- 按地區分析公司市場佔有率
- 北美洲
- 歐洲
- 亞太地區
- 中東和非洲
- 拉丁美洲
- 戰略儀表板
- 策略舉措
- 重要夥伴關係與合作
- 重大併購活動
- 產品創新與發布
- 市場擴張策略
- 競爭基準測試
- 創新與技術格局
第5章:市場規模及預測:依電源分類,2021 - 2034
- 主要趨勢
- 再生能源
- 太陽的
- 風
- 不可再生
- 瓦斯渦輪機
- 內燃機
第6章:市場規模及預測:依產能,2021 - 2034
- 主要趨勢
- > 1 - 5 兆瓦
- > 5 - 20 兆瓦
- > 20 - 100 兆瓦
- > 100 兆瓦
第7章:市場規模及預測:依部署,2021 - 2034
- 主要趨勢
- 船舶
- 駁船
- 模組化筏
- 其他
第 8 章:市場規模與預測:按應用,2021 - 2034 年
- 主要趨勢
- 人造水體
- 天然水體
第9章:市場規模及預測:按地區,2021 - 2034
- 主要趨勢
- 北美洲
- 美國
- 加拿大
- 墨西哥
- 歐洲
- 英國
- 德國
- 法國
- 西班牙
- 亞太地區
- 中國
- 印度
- 日本
- 澳洲
- 中東和非洲
- 阿拉伯聯合大公國
- 沙烏地阿拉伯
- 拉丁美洲
- 巴西
- 阿根廷
第10章:公司簡介
- BW Ideol
- CGN New Energy Holdings
- CHN Energy
- Ciel & Terre
- Electricity Generating Authority of Thailand
- Equinor
- Floating Power Plant
- GE Vernova
- HEXA Renewables
- Karadeniz Holding
- Kawasaki Heavy Industries
- MAN Energy Solutions
- Mitsubishi Heavy Industries
- National Power Supply Public Company
- Ørsted
- RWE
- Siemens Energy
- SJVN Green Energy
- Sterling & Wilson Renewable Energy
- Swimsol
- Tata Power
- Vestas
- Wartsila
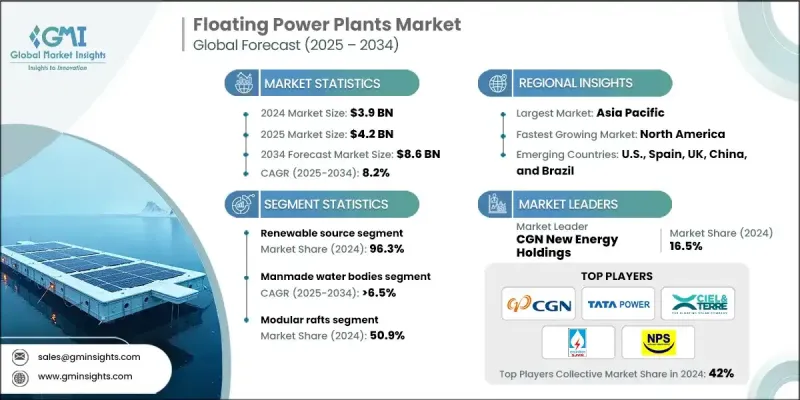
The global floating power plants market was valued at USD 3.9 billion in 2024 and is projected to grow from USD 4.2 billion in 2025 to USD 8.6 billion by 2034, expanding at a CAGR of 8.2%, according to the latest report published by Global Market Insights, Inc.
Floating power plants (FPPs) are on the rise as fast, deployable, flexible options to meet energy needs in regions with an abundance of water but a limited amount of land. These plants provide the ability to integrate renewable sources, lower transmission losses, and modulate load requirements without the need for large amounts of land.
| Market Scope | |
|---|---|
| Start Year | 2024 |
| Forecast Year | 2025-2034 |
| Start Value | $3.9 Billion |
| Forecast Value | $8.6 Billion |
| CAGR | 8.2% |
Key Drivers:
1. Emphasis on renewable energy integration: The emergence of floating solar/wind platforms allows countries to achieve clean energy goals without competing for limited land resources.
2. Need for fast deployment in offshore and island areas: The ability for FPPs to provide resilient energy to disadvantaged coastal and island communities without grid extension is immeasurable.
3. Land limitations and waterbody utilization issue: The public sector is pushing to use manmade lakes and reservoirs to produce clean power.
4. Modular and hybrid technology advancements: The advancement of hybrid floating producing platforms, which use solar, wind, and storage, is transforming the implementation of utility-scale renewables.
Key Players:
- The 5 leading players in the floating power plants market are CGN New Energy Holdings, Tata Power, Ciel & Terre, SJVN Green Energy, and National Power Supply Public Company, accounting for approximately 42% of the 2024 market.
- In quarter 3 FY 2025, Siemens Energy announced strong financial performance in the third quarter with revenue increasing by 13.5% on a comparable basis to USD 11.3 billion.
- In the first half of 2025, GE Vernova reported revenue of USD 17.1 billion.
- In Q3, 2025, Kawasaki Heavy Industries garnered revenue of USD 3.3 billion.
Key Challenges:
- High capital costs of deployment: The benefits of modularity have lessened costs, but the costs for the mooring and installation systems are still high for the first time.
- Environmental and regulatory requirements: This includes permitting and water rights related to site and environmental issues that may affect deployment, especially in sensitive marine habitats.
- Maintenance and mooring in all types of extreme weather: Offshore floating structures need to factor in saltwater corrosion and exposure to wind and wave conditions at all times.
1. By Power Source - Renewable Leading
Renewable floating power plants (especially solar and wind) dominated the market share in 2024. Increasingly rigorous environmental regulations and decarbonization goals are pushing utilities towards hybrid and solar-led floating generation technologies.
2. By Application - Manmade Water Bodies are at the Forefront
Due to simple permitting and consistent, steady water levels, manmade water bodies such as reservoirs, ponds, artificial lakes, and canals were the most prominent deployment locations. These job sites minimize potential complications around tides and wind wave action, preserving long-term FPP viability.
3. By Deployment - Modular Rafts Provide Mobilization
Modular raft systems were the most dominant system in the market in 2024. They offer mobilization and mobilization to units with standardization manufacturing, making these units valuable at both utility scale for grid situations as well as for rural electrification projects. Validation in this approach is also realized with lower maintenance and shorter times to upgrade.
With aspirational ambitions for clean energy, North America is being identified as a rapidly growing market. Onshore and offshore wind (U.S. East Coast), reservoir-based floating solar (California, Texas), and other segments are driving the floating power capacity of the region.
Key vendors in the floating power plants market are BW Ideol, CGN New Energy Holdings, CHN Energy, Ciel & Terre, Electricity Generating Authority of Thailand, Equinor, Floating Power Plant, GE Vernova, HEXA Renewables, Karadeniz Holding, Kawasaki Heavy Industries, MAN Energy Solutions, Mitsubishi Heavy Industries, National Power Supply Public Company, Orsted, RWE, Siemens Energy, SJVN Green Energy, Sterling & Wilson Renewable Energy, Swimsol, Tata Power, Vestas, and Wartsila.
To promote competitiveness, leading players are emphasizing hybrid systems, global partnerships, and scalable modular designs. BW Ideol and Equinor are increasing floating offshore wind capacity across Europe and North America. Karadeniz Holding is still sending its "Power Ships" out for emergency power supply in emerging markets. GE Vernova and Siemens Energy are emphasizing integrating floating renewables with gas turbines and battery storage. Collaborations like the one between Vestas and Mitsubishi Heavy Industries are driving wind-turbine-integrated floating platforms. Firms are also entering the manmade water bodies space with locally adapted deployments designed to meet regional regulatory and climatic requirements.
Table of Contents
Chapter 1 Methodology & Scope
- 1.1 Research design
- 1.1.1 Research approach
- 1.1.2 Data collection methods
- 1.1.3 Base estimates and calculations
- 1.1.4 Base year calculation
- 1.1.5 Key trends for market estimates
- 1.2 Forecast model
- 1.3 Primary research and validation
- 1.4 Some of the primary sources (but not limited to)
- 1.5 Data mining sources
- 1.5.1 Secondary
- 1.5.1.1 Paid sources
- 1.5.1.2 Public sources
- 1.5.1.3 Sources, by region
- 1.5.1 Secondary
- 1.6 Market definitions
Chapter 2 Executive Summary
- 2.1 Industry 360° synopsis, 2021 - 2034
- 2.2 Business trends
- 2.3 Power source trends
- 2.4 Capacity trends
- 2.5 Deployment trends
- 2.6 Application trends
- 2.7 Regional trends
Chapter 3 Industry Insights
- 3.1 Industry ecosystem analysis
- 3.1.1 Raw material availability & sourcing analysis
- 3.1.2 Manufacturing capacity assessment
- 3.1.3 Supply chain resilience & risk factors
- 3.1.4 Distribution network analysis
- 3.2 Regulatory landscape
- 3.3 Industry impact forces
- 3.3.1 Growth drivers
- 3.3.2 Industry pitfalls & challenges
- 3.4 Growth potential analysis
- 3.5 Porter's analysis
- 3.5.1 Bargaining power of suppliers
- 3.5.2 Bargaining power of buyers
- 3.5.3 Threat of new entrants
- 3.5.4 Threat of substitutes
- 3.6 PESTEL analysis
- 3.6.1 Political factors
- 3.6.2 Economic factors
- 3.6.3 Social factors
- 3.6.4 Technological factors
- 3.6.5 Legal factors
- 3.6.6 Environmental factors
- 3.7 Cost structure analysis of floating power plants
- 3.8 Price trend analysis
- 3.8.1 By region
- 3.8.2 By capacity
- 3.9 Emerging opportunities & trends
- 3.9.1 Digitalization and IoT integration
- 3.9.2 Emerging market penetration
- 3.10 Investment analysis & future outlook
Chapter 4 Competitive Landscape, 2025
- 4.1 Introduction
- 4.2 Company market share analysis, by region, 2024
- 4.2.1 North America
- 4.2.2 Europe
- 4.2.3 Asia Pacific
- 4.2.4 Middle East & Africa
- 4.2.5 Latin America
- 4.3 Strategic dashboard
- 4.4 Strategic initiatives
- 4.4.1 Key partnerships & collaborations
- 4.4.2 Major M&A activities
- 4.4.3 Product innovations & launches
- 4.4.4 Market expansion strategies
- 4.5 Competitive benchmarking
- 4.6 Innovation & technology landscape
Chapter 5 Market Size and Forecast, By Power Source, 2021 - 2034 (USD Million & MW)
- 5.1 Key trends
- 5.2 Renewable
- 5.2.1 Solar
- 5.2.2 Wind
- 5.3 Non-renewable
- 5.3.1 Gas turbine
- 5.3.2 IC engines
Chapter 6 Market Size and Forecast, By Capacity, 2021 - 2034 (USD Million & MW)
- 6.1 Key trends
- 6.2 > 1 - 5 MW
- 6.3 > 5 - 20 MW
- 6.4 > 20 - 100 MW
- 6.5 > 100 MW
Chapter 7 Market Size and Forecast, By Deployment, 2021 - 2034 (USD Million & MW)
- 7.1 Key trends
- 7.2 Ships
- 7.3 Barges
- 7.4 Modular rafts
- 7.5 Others
Chapter 8 Market Size and Forecast, By Application, 2021 - 2034 (USD Million & MW)
- 8.1 Key trends
- 8.2 Manmade water bodies
- 8.3 Natural water bodies
Chapter 9 Market Size and Forecast, By Region, 2021 - 2034 (USD Million & MW)
- 9.1 Key trends
- 9.2 North America
- 9.2.1 U.S.
- 9.2.2 Canada
- 9.2.3 Mexico
- 9.3 Europe
- 9.3.1 UK
- 9.3.2 Germany
- 9.3.3 France
- 9.3.4 Spain
- 9.4 Asia Pacific
- 9.4.1 China
- 9.4.2 India
- 9.4.3 Japan
- 9.4.4 Australia
- 9.5 Middle East & Africa
- 9.5.1 UAE
- 9.5.2 Saudi Arabia
- 9.6 Latin America
- 9.6.1 Brazil
- 9.6.2 Argentina
Chapter 10 Company Profiles
- 10.1 BW Ideol
- 10.2 CGN New Energy Holdings
- 10.3 CHN Energy
- 10.4 Ciel & Terre
- 10.5 Electricity Generating Authority of Thailand
- 10.6 Equinor
- 10.7 Floating Power Plant
- 10.8 GE Vernova
- 10.9 HEXA Renewables
- 10.10 Karadeniz Holding
- 10.11 Kawasaki Heavy Industries
- 10.12 MAN Energy Solutions
- 10.13 Mitsubishi Heavy Industries
- 10.14 National Power Supply Public Company
- 10.15 Ørsted
- 10.16 RWE
- 10.17 Siemens Energy
- 10.18 SJVN Green Energy
- 10.19 Sterling & Wilson Renewable Energy
- 10.20 Swimsol
- 10.21 Tata Power
- 10.22 Vestas
- 10.23 Wartsila
 浮體式發電廠市場:2026-2032年全球市場預測(依能源、輸出、錨碇系統、安裝類型、所有權類型和最終用戶分類)
 浮體式發電廠市場規模、佔有率、成長及全球產業分析:按類型、應用和地區分類的洞察與預測(2026-2034 年)
 2026年全球浮體式發電廠市場報告
 浮式發電廠市場-全球產業規模、佔有率、趨勢、機會及預測(依能源來源、容量、地區及競爭格局分類,2021-2031年)
 浮體式電站市場規模、佔有率和成長分析(按動力來源、額定功率和地區分類)—產業預測(2026-2033 年)全球浮體式發電廠市場-2025-2030年預測浮動核電廠 EPC 市場-全球產業規模、佔有率、趨勢、機會和預測(按技術、按最終用戶、按組件、按服務類型、按地區和競爭進行細分,2020-2030 年預測)
 全球浮體式發電廠市場:市場規模、市場佔有率和趨勢分析(按電源、額定功率和地區)、按細分市場預測(2025-2030 年)
 浮體式核能發電廠EPC市場至2030年的預測:按類型、組件、技術、應用和地區的全球分析