

 |
市場調查報告書
商品編碼
1822596
紫外線感測器市場機會、成長動力、產業趨勢分析及2025-2034年預測UV Sensors Market Opportunity, Growth Drivers, Industry Trend Analysis, and Forecast 2025 - 2034 |
||||||
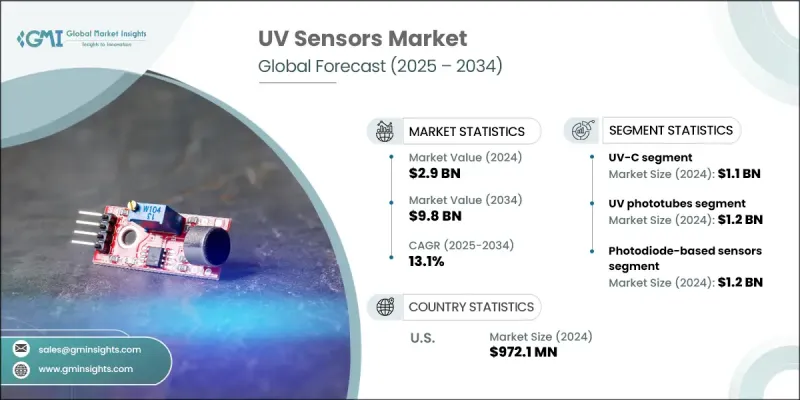
2024 年全球紫外線感測器市場價值為 29 億美元,預計到 2034 年將以 13.1% 的複合年成長率成長至 98 億美元。
這一激增的促進因素包括紫外線消毒系統的日益普及、智慧穿戴裝置整合的不斷提升、環境和汽車監測的廣泛應用,以及醫療保健和工業領域應用的不斷擴展。人們對紫外線安全和環境監測意識的不斷提高也推動了對這些感測器的持續需求。公共事業、醫療保健機構和商業場所等行業對紫外線消毒的使用日益增多,這仍然是關鍵的催化劑。在醫院和醫療環境中,對用於表面、設備和空氣消毒的UV-C系統的需求推動了對精確感測器的需求。此外,工業部門正在將紫外線感測器解決方案納入製程控制、火焰偵測和環境合規系統中。塑造這一領域的一個主要趨勢是專注於生產緊湊、經濟高效的紫外線感測器,這有助於在工業和消費市場中實現更廣泛的應用。微型組件的趨勢提高了安全系統、自動化和穿戴式技術等應用的靈活性。
| 市場範圍 | |
|---|---|
| 起始年份 | 2024 |
| 預測年份 | 2025-2034 |
| 起始值 | 29億美元 |
| 預測值 | 98億美元 |
| 複合年成長率 | 13.1% |
2024年,UV-C紫外線殺菌領域產值達11億美元。隨著水處理、醫療保健和市政衛生領域對殺菌解決方案的需求不斷成長,該領域正在迅速擴張。 UV-C感測器對於精確測量劑量、控制輻照度和驗證消毒性能至關重要。隨著安全法規日益嚴格,製造商正優先開發高精度UV-C感測器,這些感測器能夠在惡劣條件下持續運行,並為關鍵應用提供可追溯的可靠資料。
2024年,紫外線光電管市場價值達12億美元。這些感測器因其在工業環境中的靈敏度和可靠性而備受推崇,尤其是在火焰探測、燃燒安全系統和光譜測量領域。它們在高風險環境中的精確度使其成為科學和操作環境中監測紫外線排放的首選解決方案。該領域的製造商正在努力提高光電管感測器的靈敏度和可靠性,同時確保符合消防安全法規和行業標準。
2024年,美國紫外線感測器市場規模達9.721億美元。美國市場的成長得益於其完善的監管環境和UV-C技術的持續創新。政府法規確保紫外線相關設備符合功效和安全標準,從而提升了各行業的信任度和採用率。隨著紫外線消毒系統和安全應用的部署不斷增加,尤其是在醫療保健、環境監測和公共基礎設施領域,對紫外線感測器的需求也隨之成長。
全球紫外線感測器市場的知名企業包括 Silicon Laboratories Inc.、Vishay Intertechnology Inc.、Apogee Instruments Inc.、Texas Instruments Inc.、Analog Devices Inc.、Broadcom Inc.、Skye Instruments Ltd.、STMicroelectronics NV、Solaricon Light Co. Corp.、Genicom Co. Ltd.、GaNo Optoelectronics Inc. 和 ams OSRAM AG。紫外線感測器市場的公司正在採取多管齊下的方法來鞏固其市場地位。許多公司正在投資開發高精度、可追溯至 NIST 的感測器,旨在滿足醫療保健、環境安全和火焰檢測等關鍵應用領域的嚴格監管要求。 Broadcom、Texas Instruments 和 Apogee Instruments 等公司正在透過整合無線連接和即時監控等先進功能來擴展其產品組合。
目錄
第1章:方法論與範圍
第2章:執行摘要
第3章:行業洞察
- 產業生態系統分析
- 供應商格局
- 利潤率
- 成本結構
- 每個階段的增值
- 影響價值鏈的因素
- 中斷
- 產業生態系統分析
- 產業衝擊力
- 成長動力
- 紫外線消毒需求不斷成長
- 穿戴式科技的成長
- 汽車和座艙環境感測器
- 醫療保健應用的成長
- 工業應用部署不斷增加
- 陷阱與挑戰
- 先進感測器成本高昂
- 缺乏標準化和績效參差不齊
- 成長動力
- 成長潛力分析
- 監管格局
- 北美洲
- 歐洲
- 亞太地區
- 拉丁美洲
- 中東和非洲
- 波特的分析
- PESTEL分析
- 技術和創新格局
- 當前的技術趨勢
- 新興技術
- 新興商業模式
- 合規要求
- 永續性措施
- 專利和智慧財產權分析
- 地緣政治與貿易動態
第4章:競爭格局
- 介紹
- 公司市佔率分析
- 按地區
- 北美洲
- 歐洲
- 亞太地區
- 拉丁美洲
- 中東和非洲
- 市場集中度分析
- 按地區
- 關鍵參與者的競爭基準
- 財務績效比較
- 收入
- 利潤率
- 研發
- 產品組合比較
- 產品範圍廣度
- 科技
- 創新
- 地理位置比較
- 全球足跡分析
- 服務網路覆蓋
- 各地區市場滲透率
- 競爭定位矩陣
- 領導者
- 挑戰者
- 追蹤者
- 利基市場參與者
- 戰略展望矩陣
- 財務績效比較
- 2021-2024 年關鍵發展
- 併購
- 夥伴關係與合作
- 技術進步
- 擴張和投資策略
- 永續發展舉措
- 數位轉型舉措
- 新興/新創企業競爭對手格局
第5章:市場估計與預測:按類型,2021 - 2034
- 主要趨勢
- 紫外線A
- 紫外線B
- 紫外線C
- 組合紫外線
第6章:市場估計與預測:依紫外線類型,2021 - 2034 年
- 主要趨勢
- 紫外線光電管
- 光感應器
- 紫外光譜感測器
第7章:市場估計與預測:按技術,2021 - 2034 年
- 主要趨勢
- 基於光電二極體的感測器
- 基於光電電晶體的感測器
- 基於CMOS的感測器
- 其他
第 8 章:市場估計與預測:按最終用途應用,2021 - 2034 年
- 主要趨勢
- 軍事與國防
- 輻射暴露偵測
- 現場淨化系統
- 其他
- 消費性電子產品
- 穿戴式裝置
- 智慧型手機和平板電腦
- 智慧家庭設備
- 其他
- 醫療保健
- 紫外線消毒和滅菌系統
- 醫療光療設備
- 紫外線皮膚治療
- 其他
- 工業的
- 紫外線曝光檢測
- 機械安全系統
- 過程控制
- 其他
- 汽車和運輸
- 艙內紫外線監測系統
- 油漆和內裝材料保護
- 其他
- 農業和食品工業
- 環境監測
- 研究與教育
- 其他
第9章:市場估計與預測:按地區,2021 - 2034
- 主要趨勢
- 北美洲
- 美國
- 加拿大
- 歐洲
- 德國
- 英國
- 法國
- 西班牙
- 義大利
- 荷蘭
- 亞太地區
- 中國
- 印度
- 日本
- 澳洲
- 韓國
- 拉丁美洲
- 巴西
- 墨西哥
- 阿根廷
- 中東和非洲
- 沙烏地阿拉伯
- 南非
- 阿拉伯聯合大公國
第10章:公司簡介
- 全球關鍵參與者
- Vishay Intertechnology Inc.
- STMicroelectronics NV
- ams OSRAM AG
- 區域關鍵參與者
- 北美洲
- Silicon Laboratories Inc.
- Texas Instruments Inc.
- Apogee Instruments Inc.
- 歐洲
- Skye Instruments Ltd.
- Analog Devices, Inc.
- Solar Light Co. Inc.
- Asia-Pacific
- Panasonic Holdings Corp.
- LAPIS Semiconductor Co. Ltd.
- Genicom Co. Ltd.
- 北美洲
- 顛覆者/利基市場參與者
- Broadcom Inc.
- Davis Instruments Corp.
- GaNo Optoelectronics Inc.
The Global UV Sensors Market was valued at USD 2.9 billion in 2024 and is estimated to grow at a CAGR of 13.1% to reach USD 9.8 billion by 2034.
This surge is driven by growing adoption of UV disinfection systems, increasing integration in smart wearables, widespread use in environmental and automotive monitoring, and expanding applications in healthcare and industrial sectors. Rising awareness of UV safety and environmental monitoring also fuels consistent demand for these sensors. Increasing usage of UV-based disinfection across sectors such as public utilities, healthcare settings, and commercial spaces continues to be a key catalyst. In hospitals and medical environments, demand for UV-C systems to sterilize surfaces, equipment, and air is pushing the requirement for accurate sensors. Moreover, industrial sectors are incorporating UV sensor solutions into process control, flame detection, and environmental compliance systems. A major trend shaping this space is the focus on producing compact, cost-effective UV sensors, which supports greater adoption in both industrial and consumer markets. The trend toward miniaturized components has improved flexibility in applications across safety systems, automation, and wearable technology.
| Market Scope | |
|---|---|
| Start Year | 2024 |
| Forecast Year | 2025-2034 |
| Start Value | $2.9 Billion |
| Forecast Value | $9.8 Billion |
| CAGR | 13.1% |
The UV-C segment generated USD 1.1 billion in 2024. It is expanding rapidly as demand grows for germicidal solutions in water treatment, healthcare, and municipal sanitation. UV-C sensors are essential for accurate dose measurement, irradiance control, and verifying disinfection performance. With safety regulations becoming more stringent, manufacturers are prioritizing the development of high-precision UV-C sensors that can operate consistently in rugged conditions and deliver traceable, reliable data for critical applications.
The UV phototubes segment was valued at USD 1.2 billion in 2024. These sensors are highly valued for their sensitivity and reliability in industrial environments, particularly in flame detection, combustion safety systems, and spectroscopic measurements. Their accuracy in high-risk environments makes them a go-to solution for monitoring UV emissions in both scientific and operational settings. Manufacturers in this segment are working toward enhancing the sensitivity and reliability of their phototube sensors while ensuring compliance with fire-safety regulations and industrial standards.
U.S. UV Sensors Market generated USD 972.1 million in 2024. Growth in the U.S. is supported by a strong regulatory landscape and continual innovations in UV-C technologies. Government regulations ensure that UV-related devices meet efficacy and safety standards, which has encouraged greater trust and adoption across sectors. The demand for UV sensors has grown in alignment with the increased deployment of UV disinfection systems and safety applications, especially in healthcare, environmental monitoring, and public infrastructure.
Prominent players in the Global UV Sensors Market include Silicon Laboratories Inc., Vishay Intertechnology Inc., Apogee Instruments Inc., Texas Instruments Inc., Analog Devices Inc., Broadcom Inc., Skye Instruments Ltd., STMicroelectronics N.V., Solar Light Co. Inc., Panasonic Holdings Corp., LAPIS Semiconductor Co. Ltd., Davis Instruments Corp., Genicom Co. Ltd., GaNo Optoelectronics Inc., and ams OSRAM AG. Companies in the UV sensors market are adopting a multi-pronged approach to reinforce their market presence. Many are investing in the development of highly accurate, NIST-traceable sensors designed to meet stringent regulatory demands in critical applications such as healthcare, environmental safety, and flame detection. Firms like Broadcom, Texas Instruments, and Apogee Instruments are expanding their product portfolios by integrating advanced features like wireless connectivity and real-time monitoring capabilities.
Table of Contents
Chapter 1 Methodology and scope
- 1.1 Market scope and definition
- 1.2 Research design
- 1.2.1 Research approach
- 1.2.2 Data collection methods
- 1.3 Data mining sources
- 1.3.1 Global
- 1.3.2 Regional/Country
- 1.4 Base estimates and calculations
- 1.4.1 Base year calculation
- 1.4.2 Key trends for market estimation
- 1.5 Primary research and validation
- 1.5.1 Primary sources
- 1.6 Forecast model
- 1.7 Research assumptions and limitations
Chapter 2 Executive summary
- 2.1 Industry 3600 synopsis
- 2.2 Key market trends
- 2.2.1 UV type trends
- 2.2.2 Type trends
- 2.2.3 Technology trends
- 2.2.4 end use application trends
- 2.2.5 Regional trends
- 2.3 TAM Analysis, 2025-2034 (USD Billion)
- 2.4 CXO perspectives: Strategic imperatives
- 2.4.1 Executive decision points
- 2.4.2 Critical success factors
- 2.5 Future outlook and strategic recommendations
Chapter 3 Industry insights
- 3.1 Industry ecosystem analysis
- 3.1.1 Supplier landscape
- 3.1.2 Profit margin
- 3.1.3 Cost structure
- 3.1.4 Value addition at each stage
- 3.1.5 Factor affecting the value chain
- 3.1.6 Disruptions
- 3.2 Industry ecosystem analysis
- 3.3 Industry impact forces
- 3.3.1 Growth drivers
- 3.3.1.1 Rising Demand for UV Disinfection
- 3.3.1.2 Growth in Wearable Technology
- 3.3.1.3 Automotive & Cabin Environmental Sensors
- 3.3.1.4 Growth in Healthcare Applications
- 3.3.1.5 Increasing deployment in industrial application
- 3.3.2 Pitfalls and challenges
- 3.3.2.1 High Costs of Advanced Sensors
- 3.3.2.2 Lack of Standardization & Variable Performance
- 3.3.1 Growth drivers
- 3.4 Growth potential analysis
- 3.5 Regulatory landscape
- 3.5.1 North America
- 3.5.2 Europe
- 3.5.3 Asia Pacific
- 3.5.4 Latin America
- 3.5.5 Middle East & Africa
- 3.6 Porter's analysis
- 3.7 PESTEL analysis
- 3.8 Technology and Innovation landscape
- 3.8.1 Current technological trends
- 3.8.2 Emerging technologies
- 3.9 Emerging Business Models
- 3.10 Compliance Requirements
- 3.11 Sustainability Measures
- 3.12 Patent and IP analysis
- 3.13 Geopolitical and trade dynamics
Chapter 4 Competitive landscape, 2024
- 4.1 Introduction
- 4.2 Company market share analysis
- 4.2.1 By region
- 4.2.1.1 North America
- 4.2.1.2 Europe
- 4.2.1.3 Asia Pacific
- 4.2.1.4 Latin America
- 4.2.1.5 Middle East & Africa
- 4.2.2 Market Concentration Analysis
- 4.2.1 By region
- 4.3 Competitive benchmarking of key players
- 4.3.1 Financial performance comparison
- 4.3.1.1 Revenue
- 4.3.1.2 Profit margin
- 4.3.1.3 R&D
- 4.3.2 Product portfolio comparison
- 4.3.2.1 Product range breadth
- 4.3.2.2 Technology
- 4.3.2.3 Innovation
- 4.3.3 Geographic presence comparison
- 4.3.3.1 Global footprint analysis
- 4.3.3.2 Service network coverage
- 4.3.3.3 Market penetration by region
- 4.3.4 Competitive positioning matrix
- 4.3.4.1 Leaders
- 4.3.4.2 Challengers
- 4.3.4.3 Followers
- 4.3.4.4 Niche players
- 4.3.5 Strategic outlook matrix
- 4.3.1 Financial performance comparison
- 4.4 Key developments, 2021-2024
- 4.4.1 Mergers and acquisitions
- 4.4.2 Partnerships and collaborations
- 4.4.3 Technological advancements
- 4.4.4 Expansion and investment strategies
- 4.4.5 Sustainability initiatives
- 4.4.6 Digital transformation initiatives
- 4.5 Emerging/ startup competitors landscape
Chapter 5 Market estimates and forecast, by Type, 2021 - 2034 (USD Million & Thousand Units)
- 5.1 Key trends
- 5.2 UV-A
- 5.3 UV-B
- 5.4 UV-C
- 5.5 Combined UV
Chapter 6 Market estimates and forecast, by UV Type, 2021 - 2034 (USD Million & Thousand Units)
- 6.1 Key trends
- 6.2 UV phototubes
- 6.3 Light sensors
- 6.4 UV spectrum sensors
Chapter 7 Market estimates and forecast, by Technology, 2021 - 2034 (USD Million & Thousand Units)
- 7.1 Key trends
- 7.2 Photodiode-based sensors
- 7.3 Phototransistor-based sensors
- 7.4 CMOS-based sensors
- 7.5 Others
Chapter 8 Market estimates and forecast, by End Use Application, 2021 - 2034 (USD Million & Thousand Units)
- 8.1 Key trends
- 8.2 Military & defense
- 8.2.1 Radiation exposure detection
- 8.2.2 Field decontamination systems
- 8.2.3 Others
- 8.3 Consumer electronics
- 8.3.1 Wearables
- 8.3.2 Smartphones and tablets
- 8.3.3 Smart home devices
- 8.3.4 Others
- 8.4 Healthcare and medical
- 8.4.1 UV disinfection and sterilization systems
- 8.4.2 Medical phototherapy devices
- 8.4.3 UV skin treatment
- 8.4.4 Others
- 8.5 Industrial
- 8.5.1 UV exposure detection
- 8.5.2 Machinery safety systems
- 8.5.3 Process control
- 8.5.4 Others
- 8.6 Automotive and transportation
- 8.6.1 In-cabin UV monitoring systems
- 8.6.2 Paint and interior material protection
- 8.6.3 Others
- 8.7 Agriculture and food industry
- 8.8 Environmental monitoring
- 8.9 Research and education
- 8.10 Others
Chapter 9 Market estimates and forecast, by Region, 2021 - 2034 (USD Million & Thousand Units)
- 9.1 Key trends
- 9.2 North America
- 9.2.1 U.S.
- 9.2.2 Canada
- 9.3 Europe
- 9.3.1 Germany
- 9.3.2 UK
- 9.3.3 France
- 9.3.4 Spain
- 9.3.5 Italy
- 9.3.6 Netherlands
- 9.4 Asia Pacific
- 9.4.1 China
- 9.4.2 India
- 9.4.3 Japan
- 9.4.4 Australia
- 9.4.5 South Korea
- 9.5 Latin America
- 9.5.1 Brazil
- 9.5.2 Mexico
- 9.5.3 Argentina
- 9.6 Middle East and Africa
- 9.6.1 Saudi Arabia
- 9.6.2 South Africa
- 9.6.3 UAE
Chapter 10 Company profiles
- 10.1 Global Key Players
- 10.1.1 Vishay Intertechnology Inc.
- 10.1.2 STMicroelectronics N.V.
- 10.1.3 ams OSRAM AG
- 10.2 Regional Key Players
- 10.2.1 North America
- 10.2.1.1 Silicon Laboratories Inc.
- 10.2.1.2 Texas Instruments Inc.
- 10.2.1.3 Apogee Instruments Inc.
- 10.2.2 Europe
- 10.2.2.1 Skye Instruments Ltd.
- 10.2.2.2 Analog Devices, Inc.
- 10.2.2.3 Solar Light Co. Inc.
- 10.2.3 Asia-Pacific
- 10.2.3.1 Panasonic Holdings Corp.
- 10.2.3.2 LAPIS Semiconductor Co. Ltd.
- 10.2.3.3 Genicom Co. Ltd.
- 10.2.1 North America
- 10.3 Disruptors / Niche Players
- 10.3.1 Broadcom Inc.
- 10.3.2 Davis Instruments Corp.
- 10.3.3 GaNo Optoelectronics Inc.


