

 |
市場調查報告書
商品編碼
1801945
人工智慧伺服器市場機會、成長動力、產業趨勢分析及 2025 - 2034 年預測AI Server Market Opportunity, Growth Drivers, Industry Trend Analysis, and Forecast 2025 - 2034 |
||||||
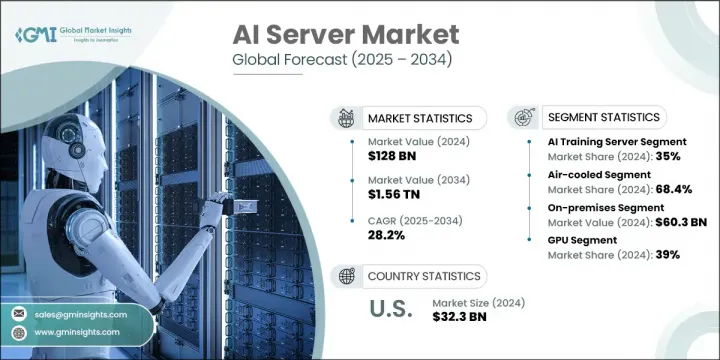
2024 年全球人工智慧伺服器市場規模達 1,280 億美元,預計到 2034 年將以 28.2% 的複合年成長率成長,達到 1.56 兆美元。推動這一成長的主要因素是各行各業對人工智慧技術的快速應用,以及對強大伺服器日益成長的需求,以支援日益複雜的人工智慧驅動型工作負載。隨著人工智慧持續改變製造業、金融業和醫療保健業等產業,對高效能運算基礎設施的需求也隨之激增。混合環境、邊緣部署和即時資料處理的興起進一步支撐了人工智慧伺服器需求的上升趨勢。企業對生成式人工智慧、預測分析和營運自動化的日益關注,正促使企業大力投資人工智慧最佳化型基礎設施,從而推動該領域的收入成長和技術創新。
北美在人工智慧伺服器部署方面依然處於領先地位,這得益於成熟的雲端服務供應商和人工智慧半導體公司生態系統的支援。該地區受益於強大的機構投資和政府支持的人工智慧項目,從而實現了持續創新。邊緣人工智慧運算已成為市場變革的趨勢,尤其是在醫療保健、智慧工業和自動化系統等資料密集型垂直領域。這些用例需要緊湊、節能的伺服器,並配備專用的人工智慧加速器來進行現場資料處理,從而消除對集中式雲端網路的過度依賴。
| 市場範圍 | |
|---|---|
| 起始年份 | 2024 |
| 預測年份 | 2025-2034 |
| 起始值 | 1280億美元 |
| 預測值 | 1.56兆美元 |
| 複合年成長率 | 28.2% |
2024年,人工智慧訓練伺服器市場佔據35%的市場佔有率,預計2025年至2034年期間的複合年成長率將達到26%。隨著越來越多的企業採用先進的機器學習、電腦視覺和生成式人工智慧系統,該市場正蓬勃發展。這些配備人工智慧專用處理器和GPU的高效能伺服器對於處理大量資料集和複雜的訓練模型至關重要。隨著人工智慧訓練成為創新和競爭策略不可或缺的一部分,企業和研究機構的支出增加正在增強該市場的成長速度。
風冷式AI伺服器市場在2024年佔了68.4%的市場佔有率,預計到2034年將以27%的複合年成長率成長。由於安裝簡單、成本低且維護要求更簡單,這類系統將繼續佔據主導地位。氣流管理、熱控制和機箱設計方面的技術進步使這些伺服器能夠支援更密集的AI工作負載,使其成為部署在邊緣環境或基礎設施資源有限的企業設施中的理想選擇。
2024年,美國人工智慧伺服器市場規模達323億美元,佔80%的市場。人工智慧驅動的機器人技術和自動化技術在製造環境中的整合對市場成長產生了巨大影響。隨著下一代伺服器的生產日益複雜,製造商正在利用自動化來簡化營運流程、提高準確性並降低人力成本。對可擴展、高效人工智慧基礎設施的追求正在重塑工廠車間,凸顯了智慧機器在建構推動人工智慧發展的系統中所發揮的作用。
塑造全球人工智慧伺服器市場的主要公司包括微軟、戴爾、富士通、英偉達、IBM、超微電腦和惠普企業。為了鞏固更強大的市場地位,人工智慧伺服器領域的公司正專注於多管齊下的策略。這包括擴展其人工智慧伺服器產品組合以滿足訓練和推理應用的需求,以及開發節能冷卻解決方案。領先的公司正在與人工智慧軟體供應商和半導體生產商合作,以提供全面最佳化的系統。一些參與者正在增加對本地化製造和自動化的投資,以滿足不斷成長的區域需求,同時降低供應鏈風險。雲端整合、可擴展設計和快速部署能力仍然是產品創新策略的核心,同時策略聯盟可以滲透到醫療保健、金融和自治系統等高成長垂直領域。
目錄
第1章:方法論與範圍
第2章:執行摘要
第3章:行業洞察
- 產業生態系統分析
- 供應商格局
- 原物料供應商
- 組件提供者
- 硬體提供者
- 最終用途
- 成本結構
- 利潤率
- 每個階段的增值
- 影響供應鏈的因素
- 破壞者
- 供應商格局
- 技術與創新格局
- 現有技術
- GPU和AI加速器的演變
- 液體冷卻系統和先進的熱管理
- 高頻寬記憶體 (HBM) 和先進的記憶體技術
- Power edge AI與分散式運算
- 新興技術
- 量子計算整合
- 神經形態計算與腦啟發處理器
- 光子計算和光互連
- AI專用晶片和客製化ASIC
- 創新生態系和夥伴關係
- 技術合作策略
- 創新加速機制
- 現有技術
- 專利分析
- 定價分析
- 成本結構分析
- 重要新聞和舉措
- 監管格局
- 2020-2024 年 AI 伺服器趨勢
- 按冷卻方式分類的成本結構
- AI伺服器的平均壽命
- 2020 年至 2024 年 CSP 和 OEM 的伺服器採購量
- 2020 年至 2024 年 CSP 和 OEM 的區域 AI 伺服器部署情況
- AI 伺服器產品整合:內部整合 vs. 外包,2020-2024 年
- 伺服器功耗
- 維護成本: OEM與第三方
- 組件故障率
- AI伺服器市場案例研究
- 微軟的 Azure AI 基礎架構轉型
- 谷歌基於TPU的客製化矽晶圓戰略
- 特斯拉的全自動駕駛人工智慧訓練基礎設施
- 未來展望與建議
- 市場轉型與成長軌跡
- 戰略基礎設施建議
- 監管合規和永續性框架
- 長期成功策略和生態系統發展
- 衝擊力
- 成長動力
- 企業人工智慧採用率激增,投資報酬率已得到證實
- 大規模雲端基礎設施擴張與投資
- 邊緣運算的成長和即時處理需求
- 人工智慧工作負載的高效能運算需求
- 產業陷阱與挑戰
- 天文數字的基礎設施成本和電力消耗
- 關鍵技能短缺和技術複雜性
- 監理合規性和資料主權要求
- 成長動力
- 成長潛力分析
- 波特的分析
- PESTEL分析
第4章:競爭格局
- 介紹
- 公司市佔率分析
- 北美洲
- 歐洲
- 亞太地區
- 拉丁美洲
- 中東和非洲
- 競爭定位矩陣
- 戰略展望矩陣
- 關鍵進展
- 併購
- 夥伴關係與合作
- 新產品發布
- 擴張計劃和資金
第5章:市場估計與預測:按伺服器,2021 - 2034 年
- 主要趨勢
- 人工智慧資料
- 人工智慧訓練
- 人工智慧推理
- 其他
第6章:市場估計與預測:按硬體,2021 - 2034 年
- 主要趨勢
- 專用積體電路(ASIC)
- FPGA
- 圖形處理器
- 其他
第7章:市場估計與預測:按冷卻技術,2021 - 2034 年
- 主要趨勢
- 風冷
- 被動空氣冷卻
- 主動空氣冷卻
- 精密空調
- 遏止解決方案
- 液冷
- 直接晶片
- 浸入式冷卻
- 單相
- 兩相
- 混合冷卻系統
第8章:市場估計與預測:按部署,2021 - 2034 年
- 主要趨勢
- 本地
- 基於雲端
- 混合
第9章:市場估計與預測:按應用,2021 - 2034 年
- 主要趨勢
- IT與電信
- 交通運輸和汽車
- 金融服務業
- 零售與電子商務
- 醫療保健和製藥
- 工業自動化
- 其他
第10章:市場估計與預測:依最終用途,2021 - 2034 年
- 主要趨勢
- OEM
- 雲端服務提供者 (CSP)
- 其他
第 11 章:市場估計與預測:按地區,2021 年至 2034 年
- 北美洲
- 美國
- 加拿大
- 歐洲
- 英國
- 德國
- 法國
- 義大利
- 西班牙
- 比利時
- 荷蘭
- 瑞典
- 亞太地區
- 中國
- 印度
- 日本
- 澳洲
- 新加坡
- 韓國
- 越南
- 印尼
- 拉丁美洲
- 巴西
- 墨西哥
- 阿根廷
- MEA
- 南非
- 沙烏地阿拉伯
- 阿拉伯聯合大公國
第12章:公司簡介
- 全球參與者
- Advanced Micro Devices
- Intel
- NVIDIA
- Cisco Systems
- Server system manufacturers
- Dell
- Hewlett Packard Enterprise
- Huawei
- Inspur
- International Business Machines
- Lenovo
- Super Micro Computer
- Hyperscale and cloud providers
- Amazon Web Services
- Microsoft
- Oracle
- 新興和區域參與者
- Foxconn (Hon Hai)
- Fujitsu
- Inventec
- Quanta Computer
- Wistron
The Global AI Server Market was valued at USD 128 billion in 2024 and is estimated to grow at a CAGR of 28.2% to reach USD 1.56 trillion by 2034. This surge is being fueled by the rapid adoption of AI technologies across various industries and the growing requirement for robust servers to support increasingly complex AI-driven workloads. As AI continues to transform sectors such as manufacturing, finance, and healthcare, demand for high-performance computing infrastructure is surging. The rise of hybrid environments, edge deployments, and real-time data processing further supports the upward trajectory of AI server demand. Enhanced focus on generative AI, predictive analytics, and automation in enterprise operations is pushing organizations to invest heavily in AI-optimized infrastructure, driving both revenue and technological innovation in this space.
North America remains the front runner in AI server deployment, supported by an established ecosystem of cloud providers and AI semiconductor firms. The region benefits from strong institutional investments and government-backed AI initiatives, enabling sustained innovation. Edge AI computing has emerged as a transformative trend in the market, especially in data-intensive verticals such as healthcare, smart industry, and automated systems. These use cases require compact, power-efficient servers with specialized AI accelerators for on-site data processing, eliminating the need to rely heavily on centralized cloud networks.
| Market Scope | |
|---|---|
| Start Year | 2024 |
| Forecast Year | 2025-2034 |
| Start Value | $128 Billion |
| Forecast Value | $1.56 Trillion |
| CAGR | 28.2% |
The AI training servers segment held 35% share in 2024 and is projected to grow at a CAGR of 26% between 2025 and 2034. The segment is gaining momentum as more organizations adopt advanced machine learning, computer vision, and generative AI systems. These high-performance servers, equipped with AI-specific processors and GPUs, are crucial for handling large datasets and complex training models. Increased spending from enterprises and research institutions is reinforcing the growth of this segment, as AI training becomes integral to innovation and competitive strategy.
The air-cooled AI servers segment held 68.4% share in 2024 and is expected to grow at a 27% CAGR through 2034. These systems continue to dominate due to their straightforward installation, lower costs, and simpler maintenance requirements. Technological advancements in airflow management, thermal control, and chassis design have allowed these servers to support more dense AI workloads, making them ideal for deployment in edge environments or enterprise facilities with limited infrastructure resources.
United States AI Server Market generated USD 32.3 billion in 2024 and held 80% share. Growth is strongly influenced by the integration of AI-driven robotics and automation in manufacturing environments. As production of next-generation servers becomes increasingly complex, manufacturers are leveraging automation to streamline operations, improve accuracy, and cut down on labor costs. The push for scalable, high-efficiency AI infrastructure is reshaping factory floors, emphasizing the role of intelligent machines in building the very systems that drive AI forward.
The major companies shaping the Global AI Server Market include Microsoft, Dell, Fujitsu, Nvidia, IBM, Super Micro Computer, and Hewlett Packard Enterprise. To secure stronger market positions, companies in the AI server space are focusing on multi-pronged strategies. This includes expanding their AI server portfolios to cater to both training and inference applications and developing energy-efficient cooling solutions. Leading firms are collaborating with AI software vendors and semiconductor producers to deliver fully optimized systems. Several players are increasing investments in localized manufacturing and automation to meet rising regional demand while reducing supply chain risk. Cloud integration, scalable design, and rapid deployment capabilities remain central to product innovation strategies, along with strategic alliances to penetrate high-growth verticals such as healthcare, finance, and autonomous systems.
Table of Contents
Chapter 1 Methodology & Scope
- 1.1 Research design
- 1.1.1 Research approach
- 1.1.2 Data collection methods
- 1.2 Data mining sources
- 1.2.1 Global
- 1.2.2 Regional/Country
- 1.3 Base estimates & calculations
- 1.3.1 Base year calculation
- 1.3.2 Key trends for market estimation
- 1.4 Forecast model
- 1.5 Primary research and validation
- 1.5.1 Primary sources
- 1.6 Research assumptions and limitations
Chapter 2 Executive Summary
- 2.1 Industry 3600 synopsis
- 2.2 Key market trends
- 2.2.1 Regional
- 2.2.2 Component
- 2.2.3 Type
- 2.2.4 End Use
- 2.3 TAM Analysis, 2025-2034
- 2.4 CXO perspectives: Strategic imperatives
- 2.4.1 Key decision points for industry executives
- 2.4.2 Critical success factors for market players
- 2.5 Future outlook and strategic recommendations
Chapter 3 Industry Insights
- 3.1 Industry ecosystem analysis
- 3.1.1 Supplier landscape
- 3.1.1.1 Raw material providers
- 3.1.1.2 Component providers
- 3.1.1.3 Hardware providers
- 3.1.1.4 End use
- 3.1.2 Cost structure
- 3.1.3 Profit margin
- 3.1.4 Value addition at each stage
- 3.1.5 Factors impacting the supply chain
- 3.1.6 Disruptors
- 3.1.1 Supplier landscape
- 3.2 Technology & innovation landscape
- 3.2.1 Current technologies
- 3.2.1.1 GPU and AI accelerator evolution
- 3.2.1.2 Liquid cooling system and advanced thermal management
- 3.2.1.3 High-bandwidth memory (HBM) and advanced memory technology
- 3.2.1.4 Power edge AI and distributed computing
- 3.2.2 Emerging technologies
- 3.2.2.1 Quantum computing integration
- 3.2.2.2 Neuromorphic computing and brain-inspired processor
- 3.2.2.3 Photonic computing and optical interconnects
- 3.2.2.4 AI-Specific Silicon and Custom ASICs
- 3.2.3 Innovation ecosystem and partnerships
- 3.2.3.1 Technology partnership strategy
- 3.2.3.2 Innovation acceleration mechanisms
- 3.2.1 Current technologies
- 3.3 Patent analysis
- 3.4 Pricing analysis
- 3.5 Cost structure analysis
- 3.6 Key news and initiatives
- 3.7 Regulatory landscape
- 3.8 AI server trends, 2020-2024
- 3.9 Cost structure breakdown by cooling
- 3.10 Average lifespan of AI servers
- 3.11 Server procurement volume by CSPs and OEMs, 2020-2024
- 3.12 Regional AI server deployment by CSPs and OEMs, 2020-2024
- 3.13 AI server product integration: In-house vs outsourced, 2020-2024
- 3.14 Power consumption by server
- 3.15 Maintenance cost: OEM vs. third party
- 3.16 Failure rate by component
- 3.17 AI server market case studies
- 3.17.1 Microsoft's Azure AI infrastructure transformation
- 3.17.2 Google's TPU-based custom silicon strategy
- 3.17.3 Tesla's AI training infrastructure for full self-driving
- 3.18 Future outlook and recommendations
- 3.18.1 Market transformation and growth trajectory
- 3.18.2 Strategic infrastructure recommendations
- 3.18.3 Regulatory compliance and sustainability framework
- 3.18.4 Long-term success strategies and ecosystem development
- 3.19 Impact forces
- 3.19.1 Growth drivers
- 3.19.1.1 Explosive enterprise AI adoption and proven return on investment
- 3.19.1.2 Massive cloud infrastructure expansion and investment
- 3.19.1.3 Edge computing growth and real-time processing demands
- 3.19.1.4 High-performance computing requirements for AI workloads
- 3.19.2 Industry pitfalls & challenges
- 3.19.2.1 Astronomical infrastructure costs and power consumption
- 3.19.2.2 Critical skills shortage and technical complexity
- 3.19.3 Regulatory compliance and data sovereignty requirements
- 3.19.1 Growth drivers
- 3.20 Growth potential analysis
- 3.21 Porter's analysis
- 3.22 PESTEL analysis
Chapter 4 Competitive Landscape, 2024
- 4.1 Introduction
- 4.2 Company market share analysis
- 4.2.1 North America
- 4.2.2 Europe
- 4.2.3 Asia Pacific
- 4.2.4 Latin America
- 4.2.5 Middle East & Africa
- 4.3 Competitive positioning matrix
- 4.4 Strategic outlook matrix
- 4.5 Key developments
- 4.5.1 Mergers & acquisitions
- 4.5.2 Partnerships & collaborations
- 4.5.3 New Product Launches
- 4.5.4 Expansion Plans and funding
Chapter 5 Market Estimates & Forecast, By Server, 2021 - 2034 ($Bn, Units)
- 5.1 Key trends
- 5.2 AI data
- 5.3 AI training
- 5.4 AI inference
- 5.5 Others
Chapter 6 Market Estimates & Forecast, By Hardware, 2021 - 2034 ($Bn, Units)
- 6.1 Key trends
- 6.2 ASIC
- 6.3 FPGA
- 6.4 GPU
- 6.5 Others
Chapter 7 Market Estimates & Forecast, By Cooling Technology, 2021 - 2034 ($Bn, Units)
- 7.1 Key trends
- 7.2 Air-cooled
- 7.2.1 Passive air cooling
- 7.2.2 Active air cooling
- 7.2.3 Precision air conditioning
- 7.2.4 Containment solutions
- 7.3 Liquid-cooled
- 7.3.1 Direct-to-chip
- 7.3.2 Immersion cooling
- 7.3.3 Single-phase
- 7.3.4 Two-phase
- 7.4 Hybrid cooling systems
Chapter 8 Market Estimates & Forecast, By Deployment, 2021 - 2034 ($Bn, Units)
- 8.1 Key trends
- 8.2 On-premises
- 8.3 Cloud-based
- 8.4 Hybrid
Chapter 9 Market Estimates & Forecast, By Application, 2021 - 2034 ($Bn, Units)
- 9.1 Key trends
- 9.2 IT & telecommunications
- 9.3 Transportation and automotive
- 9.4 BFSI
- 9.5 Retail and e-commerce
- 9.6 Healthcare and Pharmaceutical
- 9.7 Industrial Automation
- 9.8 Others
Chapter 10 Market Estimates & Forecast, By End Use, 2021 - 2034 ($Bn, Units)
- 10.1 Key trends
- 10.2 OEM
- 10.3 Cloud Service Provider (CSP)
- 10.4 Others
Chapter 11 Market Estimates & Forecast, By Region, 2021 - 2034 ($Bn, Units)
- 11.1 North America
- 11.1.1 US
- 11.1.2 Canada
- 11.2 Europe
- 11.2.1 UK
- 11.2.2 Germany
- 11.2.3 France
- 11.2.4 Italy
- 11.2.5 Spain
- 11.2.6 Belgium
- 11.2.7 Netherlands
- 11.2.8 Sweden
- 11.3 Asia Pacific
- 11.3.1 China
- 11.3.2 India
- 11.3.3 Japan
- 11.3.4 Australia
- 11.3.5 Singapore
- 11.3.6 South Korea
- 11.3.7 Vietnam
- 11.3.8 Indonesia
- 11.4 Latin America
- 11.4.1 Brazil
- 11.4.2 Mexico
- 11.4.3 Argentina
- 11.5 MEA
- 11.5.1 South Africa
- 11.5.2 Saudi Arabia
- 11.5.3 UAE
Chapter 12 Company Profiles
- 12.1 Global players
- 12.1.1 Advanced Micro Devices
- 12.1.2 Intel
- 12.1.3 NVIDIA
- 12.1.4 Cisco Systems
- 12.2 Server system manufacturers
- 12.2.1 Dell
- 12.2.2 Hewlett Packard Enterprise
- 12.2.3 Huawei
- 12.2.4 Inspur
- 12.2.5 International Business Machines
- 12.2.6 Lenovo
- 12.2.7 Super Micro Computer
- 12.3 Hyperscale and cloud providers
- 12.3.1 Amazon Web Services
- 12.3.2 Google
- 12.3.3 Microsoft
- 12.3.4 Oracle
- 12.4 Emerging and regional players
- 12.4.1 Foxconn (Hon Hai)
- 12.4.2 Fujitsu
- 12.4.3 Inventec
- 12.4.4 Quanta Computer
- 12.4.5 Wistron
 全球生成式人工智慧伺服器市場:按處理器類型、功能、外形規格、部署方式、散熱技術和最終用戶分類-預測(至 2030 年)
 2026年全球邊緣人工智慧(AI)伺服器市場報告
 人工智慧伺服器市場:按伺服器類型、處理器類型、散熱技術、外形規格、應用、最終用戶產業和部署模式分類-全球預測,2026-2032年醫療保健領域人工智慧伺服器市場:2026-2032年全球預測(按伺服器類型、部署模式、元件、應用程式和最終用戶分類)面向網際網路的AI伺服器市場:按伺服器外形規格、處理器類型、部署模式、最終用戶和應用程式分類-2026年至2032年全球預測
 AI伺服器市場趨勢(2026):DRAM和NAND快閃記憶體價格上漲的推動因素
 2025-2029年全球AI伺服器硬體市場
 2025-2029年金融服務領域AI伺服器全球市場
 AI伺服器OEM
 人工智慧伺服器市場規模、佔有率、趨勢分析報告:按處理器類型、冷卻技術、外形尺寸、最終用途、地區、細分市場預測,2025-2030 年