

 |
市場調查報告書
商品編碼
1801936
電腦視覺系統市場機會、成長動力、產業趨勢分析及 2025 - 2034 年預測Computer Vision Systems Market Opportunity, Growth Drivers, Industry Trend Analysis, and Forecast 2025 - 2034 |
||||||
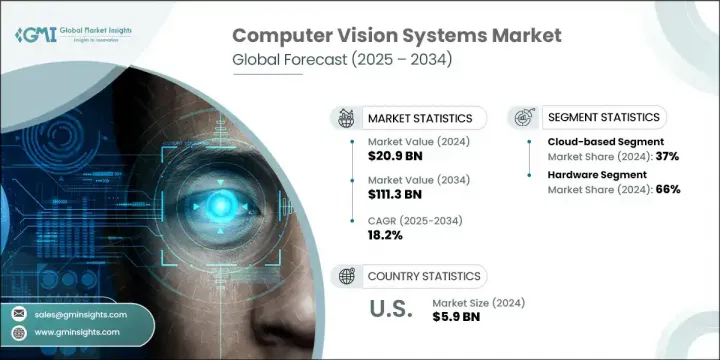
2024年,全球電腦視覺系統市場規模達209億美元,預計到2034年將以18.2%的複合年成長率成長,達到1113億美元。人工智慧、深度學習和感測器技術的快速發展,推動著電腦視覺應用在多個領域的擴展。製造業、汽車業和零售業等行業正大力採用視覺系統來提升自動化水平、加強品質控制並提升安全性。醫療保健產業正在利用這些技術進行診斷和病患監護,而安防產業則受益於即時威脅識別技術。
城市基礎設施管理和精準農業也正在利用這些系統來簡化營運。在能源和電子領域,電腦視覺有助於最佳化監控和設備互動。如今,先進的演算法能夠提高影像清晰度,將低解析度資料轉換為高解析度輸出,這為自主導航和醫療診斷等高精度應用開闢了可能性。
| 市場範圍 | |
|---|---|
| 起始年份 | 2024 |
| 預測年份 | 2025-2034 |
| 起始值 | 209億美元 |
| 預測值 | 1113億美元 |
| 複合年成長率 | 18.2% |
工業 4.0 和智慧環境的興起持續加速了對智慧視覺系統的需求。隨著雲端運算、邊緣處理和物聯網技術的整合,企業能夠實現即時資料分析和可擴展性。改進的機器學習模型也提升了這些系統的可靠性和性能。
基於雲端的電腦視覺平台在2024年佔據了37%的市場佔有率,預計在2025年至2034年期間的複合年成長率將達到19%。它們的受歡迎程度源於其可擴展性、成本效益以及無需繁重的本地基礎設施即可部署複雜處理任務的能力。企業正在利用雲端來大規模處理視覺資料,整合先進的學習模型,並以精簡的方式在不同環境中部署視覺工具。
硬體領域佔據了66%的市場佔有率,預計到2034年將以18%的複合年成長率成長。高性能攝影機、處理器、記憶體、儲存和顯示單元等硬體組件是視覺系統核心功能的關鍵,它們正在為工業製造、汽車技術和醫療診斷等各個領域進行客製化。人工智慧與專用硬體的結合正在推動臉部辨識、自動偵測和視覺追蹤等任務的發展。
2024年,美國電腦視覺系統市場佔90%的市場佔有率,貢獻了59億美元的市場規模。美國擁有強大的科技生態系統,並在多個高成長領域中率先採用。從自動駕駛出行、智慧生產線到醫學影像和監控等應用的激增,刺激了市場需求。廣泛的數位轉型和先進的電信基礎設施進一步支援了雲端和邊緣部署模式。此外,零售業正在利用視覺系統進行即時庫存追蹤和個人化用戶互動,從而加強了各企業的自動化措施。
塑造全球電腦視覺系統市場的領導者包括Google、英特爾、Teledyne、NVIDIA、亞馬遜網路服務、微軟和IBM。電腦視覺系統市場的主要參與者專注於創新、生態系統合作和策略擴張,以獲得競爭優勢。各公司正將資金投入研發,以提升人工智慧驅動的視覺能力,尤其是在自主系統和即時分析領域。策略性收購正在進行,以增強特定領域的專業知識並加速產品開發。擴展雲端基礎設施和推出邊緣相容的視覺平台,正在幫助參與者接觸到具有不同可擴展性需求的客戶。針對醫療保健、零售、汽車和製造等關鍵垂直行業客製化解決方案是另一個核心策略。
目錄
第1章:方法論
- 市場範圍和定義
- 研究設計
- 研究方法
- 資料收集方法
- 資料探勘來源
- 全球的
- 地區/國家
- 基礎估算與計算
- 基準年計算
- 市場評估的主要趨勢
- 初步研究和驗證
- 主要來源
- 預測模型
- 研究假設和局限性
第2章:執行摘要
第3章:行業洞察
- 市場引進與發展
- 電腦視覺技術的歷史發展
- 當前市場格局
- 未來展望與新興趨勢
- 供應商格局
- 原料和零件供應商
- 硬體製造商
- 軟體開發者
- 系統整合商
- 最終用戶
- 利潤率分析
- 技術與創新格局
- 深度學習與神經網路
- 3D電腦視覺
- 用於電腦視覺的邊緣人工智慧
- 擴增實境整合
- 顯示技術中的電腦視覺
- 用於視覺應用的神經形態計算
- 量子計算對電腦視覺的影響
- 用於訓練的合成資料生成
- 顯示行業特定的電腦視覺應用
- 顯示器自動光學檢測 (AOI)
- 顯示器製造上的缺陷檢測
- 顏色校準和品質控制
- 智慧顯示互動技術
- 用於微型 LED 和 OLED 製造的電腦視覺
- 顯示器生產的線上製程監控
- 面板均勻性評估系統
- 軟性顯示器的自動視覺檢測
- 產業生態系統分析
- 供應商矩陣
- 配銷通路分析
- 策略夥伴關係和合作
- 產業協會和聯盟
- 研究和學術機構
- 專利分析
- 各地區專利申請及授權情況
- 顯示相關電腦視覺領域的關鍵專利
- 專利趨勢分析
- 專利訴訟情勢
- 顯示視覺系統的新興專利領域
- 重要新聞和舉措
- 監管格局
- 資料保護法規
- 電腦視覺產業標準
- 區域監管機構
- 不同垂直行業的合規要求
- 未來監管發展
- 案例研究
- 顯示器製造中的電腦視覺
- 電子產業品質控制應用
- 智慧零售實施成功案例
- 電腦視覺的醫療保健應用
- 車載顯示整合案例
- 投資和融資格局
- 創投
- 私募股權融資
- 企業投資與併購活動
- 政府和公共資金
- 各地區投資趨勢
- 成本結構分析
- 硬體組件成本
- 軟體開發和授權成本
- 實施和整合成本
- 維護和支援成本
- 總擁有成本分析
- 未來技術路線圖
- 短期發展(1-2年)
- 中期發展(3-5年)
- 長期發展(5年以上)
- 科技融合機會
- 業界最佳實踐
- 開發和實施方法
- 品質保證和測試框架
- 資料管理和隱私實踐
- ROI 最佳化策略
- 市場進入策略
- 新產品開發
- 策略夥伴關係和聯盟
- 併購
- 區域擴張策略
- 永續性和 ESG 分析
- 電腦視覺科技對環境的影響
- 社會影響和倫理考慮
- 治理與合規框架
- 永續發展目標協調
- 衝擊力
- 成長動力
- 品質檢驗和自動化需求不斷成長
- 人工智慧和機器學習技術的日益融合
- 智慧製造應用日益增多
- 深度學習演算法的進步
- 邊緣運算設備的激增
- 非接觸式解決方案的需求不斷成長
- 產業陷阱與挑戰
- 實施成本高
- 技術複雜性與整合挑戰
- 資料隱私和安全問題
- 各行業標準化程度有限
- 運算資源需求
- 市場機會
- 與邊緣運算和物聯網的整合
- 顯示器製造的新興應用
- 零售和醫療保健行業的成長
- 亞太地區擴張
- 感測器技術的進步
- 跨行業應用和解決方案
- 市場挑戰
- 準確性和可靠性問題
- 熟練勞動力短缺
- 監理和合規挑戰
- 影響績效的環境因素
- 可擴展性和部署挑戰
- 成長動力
- 成長潛力分析
- 波特的分析
- PESTEL分析
第4章:競爭格局
- 市佔率分析
- 主要參與者的全球市場佔有率
- 區域市佔率分佈
- 市場參與者層級分析
- 競爭基準測試
- 產品組合分析
- 商業策略分析
- 研發投入對比
- 技術能力評估
- 策略舉措
- 新產品發布和創新
- 併購
- 夥伴關係和合作
- 擴張策略
- 競爭儀錶板
- 市場定位矩陣
- 效能比較矩陣
- 戰略發展熱圖
- 關鍵參與者的 SWOT 分析
- 優點和缺點分析
- 機會與威脅分析
- 競爭定位矩陣
- 領導者
- 挑戰者
- 創新者
- 新興企業
- 供應商格局
- 分銷商和通路合作夥伴名單
- 關鍵購買標準
- 定價模型和策略
- 顯示產業特定的競爭分析
- 顯示器製造的電腦視覺解決方案
- 品質控制系統供應商
- 智慧顯示技術競爭對手
第5章:市場估計與預測:依部署模式,2021-2034 年
- 主要趨勢
- 基於雲端
- 公共雲端
- 私有雲端
- 混合雲端
- 本地
- 企業部署
- 產業部署
- 基於邊緣
- 邊緣運算設備
- 物聯網整合系統
- 智慧相機和感光元件
第6章:市場估計與預測:依組件,2021-2034
- 主要趨勢
- 硬體
- 相機和影像感測器
- 工業相機
- 智慧型相機
- 3D相機
- 紅外線攝影機
- 處理器和計算單元
- CPU
- GPU
- FPGA
- ASIC
- 邊緣AI處理器
- 記憶體和儲存
- 顯示單位
- 其他
- 相機和影像感測器
- 軟體
- 電腦視覺平台
- 深度學習框架
- 影像處理軟體
- 分析軟體
- 客製化應用程式
- 服務
- 專業服務
- 諮詢服務
- 整合與實施
- 培訓與支援
- 託管服務
- 基於雲端的服務
- 本地服務
- 專業服務
第7章:市場估計與預測:按應用,2021-2034
- 主要趨勢
- 臉部辨識
- 安全和監控
- 存取控制
- 情緒識別
- 行銷和客戶分析
- 影像分類
- 產品分類
- 內容審核
- 醫學影像分析
- 行業分類
- 物體偵測
- 零售庫存管理
- 製造缺陷檢測
- 安全應用程式
- 自主系統
- 對象追蹤
- 監控和安全
- 體育分析
- 零售客戶追蹤
- 生產過程監控
- 光學字元辨識 (OCR)
- 文件數位化
- 車牌識別
- 製造業中的文本識別
- 零售應用
- 影像分割
- 醫學影像分割
- 工業應用
- 零售應用
- 自動駕駛汽車
- 自動光學檢測
- 顯示面板偵測
- PCB偵測
- 半導體檢測
- 消費性電子產品品質控制
- 3D視覺與深度感知
- 擴增實境應用
- 機器人和自動化
- 智慧製造
- 汽車應用
- 手勢識別
- 消費性電子產品
- 汽車人機介面
- 醫療保健應用
- 智慧家庭控制
- 其他
第8章:市場估計與預測:依產業垂直,2021-2034
- 主要趨勢
- 製造業
- 電子和半導體
- 顯示器製造
- PCB組裝
- 半導體生產
- 消費性電子產品
- 汽車
- 航太和國防
- 製藥
- 食品和飲料
- 其他
- 電子和半導體
- 衛生保健
- 醫學影像和診斷
- 病人監護
- 手術援助
- 醫療保健管理
- 其他
- 零售
- 庫存管理
- 客戶分析
- 自助結帳系統
- 數位看板和智慧顯示器
- 其他
- 汽車
- 高級駕駛輔助系統 (ADAS)
- 自動駕駛汽車
- 車內監控
- 智慧駕駛艙顯示器
- 其他
- 安全和監控
- 公安
- 零售安全
- 工業安全
- 住宅安全
- 其他
- 農業
- 作物監測
- 牲畜管理
- 精準農業
- 其他
- 智慧城市
- 交通管理
- 公安
- 基礎設施監控
- 能源管理
- 其他
- 消費性電子產品
- 智慧型手機和平板電腦
- 智慧電視和顯示器
- AR/VR設備
- 智慧家庭設備
- 其他
- 能源和公用事業
- 電網監控
- 再生能源系統
- 基礎設施檢查
- 其他
- 其他
第9章:市場估計與預測:按地區,2021-2034
- 主要趨勢
- 北美洲
- 美國
- 加拿大
- 歐洲
- 英國
- 德國
- 法國
- 義大利
- 西班牙
- 俄羅斯
- 北歐人
- 亞太地區
- 中國
- 印度
- 日本
- 韓國
- 澳新銀行
- 東南亞
- 拉丁美洲
- 巴西
- 墨西哥
- 阿根廷
- MEA
- 南非
- 沙烏地阿拉伯
- 阿拉伯聯合大公國
第10章:公司簡介
- Global Technology Leaders
- NVIDIA
- Intel
- Microsoft
- IBM
- Qualcomm
- Sony
- Industrial Vision and Automation Specialists
- Cognex
- Keyence
- Basler
- Omron
- Teledyne
- AI and Vision Software Innovators
- Clarifai
- Matterport
- Visionatics
- SmartCow
- ZH-AOI
- Semiconductor and Component Suppliers
- MediaTek
- Himax
- Renesas Electronics
- AUO Display Plus (ADP)
- Edge Computing and Embedded Vision Companies
- Aetina
- Advantech
- AAEON
- Neousys
The Global Computer Vision Systems Market was valued at USD 20.9 billion in 2024 and is estimated to grow at a CAGR of 18.2% to reach USD 111.3 billion by 2034. Rapid advances in artificial intelligence, deep learning, and sensor technologies are fueling the expansion of computer vision applications across multiple sectors. Industries such as manufacturing, automotive, and retail are seeing strong adoption of vision systems to improve automation, enhance quality control, and boost safety. Healthcare is utilizing these technologies for diagnostics and patient monitoring, while security is benefiting from real-time threat recognition.
Urban infrastructure management and precision agriculture are also tapping into these systems to streamline operations. In energy and electronics, computer vision helps optimize monitoring and device interactivity. Advanced algorithms now enhance image clarity, transforming low-resolution data into high-resolution outputs, which opens up possibilities for applications that demand high precision, including autonomous navigation and medical diagnostics.
| Market Scope | |
|---|---|
| Start Year | 2024 |
| Forecast Year | 2025-2034 |
| Start Value | $20.9 Billion |
| Forecast Value | $111.3 Billion |
| CAGR | 18.2% |
The rise of Industry 4.0 and smart environments continues to accelerate demand for intelligent visual systems. With the integration of cloud computing, edge processing, and IoT technologies, real-time data analysis and scalability have become accessible to enterprises. Improved machine learning models are also increasing the reliability and performance of these systems.
The cloud-based computer vision platforms held 37% share in 2024 and is anticipated to grow at a CAGR of 19% between 2025 and 2034. Their popularity stems from scalability, cost efficiency, and the ability to deploy complex processing tasks without heavy local infrastructure. Businesses are leveraging the cloud to process visual data at scale, incorporate advanced learning models, and deploy vision tools across diverse environments in a streamlined way.
The hardware segment held 66% share and is expected to grow at a CAGR of 18% through 2034. Essential to the core function of vision systems, hardware components like high-performance cameras, processors, memory, storage, and display units are being customized for various sectors including industrial manufacturing, automotive technologies, and healthcare diagnostics. The combination of artificial intelligence with dedicated hardware is advancing tasks such as facial recognition, automated inspection, and visual tracking.
US Computer Vision Systems Market held 90% share in 2024, contributing USD 5.9 billion. The country benefits from a robust tech ecosystem and early adoption across several high-growth sectors. A surge in applications ranging from autonomous mobility and smart production lines to medical imaging and surveillance has boosted demand. Widespread digital transformation and sophisticated telecom infrastructure further support cloud and edge deployment models. Additionally, the retail space is leveraging vision systems for real-time inventory tracking and personalized user interactions, intensifying automation initiatives across businesses.
The leading players shaping the Global Computer Vision Systems Market include Google, Intel, Teledyne, NVIDIA, Amazon Web Services, Microsoft, and IBM. Major players in the computer vision systems market are focusing on innovation, ecosystem partnerships, and strategic expansion to gain a competitive edge. Companies are channeling investment into research and development to advance AI-driven vision capabilities, particularly for autonomous systems and real-time analytics. Strategic acquisitions are being made to strengthen domain-specific expertise and accelerate product development. Expanding cloud infrastructure and launching edge-compatible vision platforms are helping players reach clients with varying scalability needs. Customization of solutions for key verticals like healthcare, retail, automotive, and manufacturing is another core tactic.
Table of Contents
Chapter 1 Methodology
- 1.1 Market scope and definition
- 1.2 Research design
- 1.2.1 Research approach
- 1.2.2 Data collection methods
- 1.3 Data mining sources
- 1.3.1 Global
- 1.3.2 Regional/Country
- 1.4 Base estimates and calculations
- 1.4.1 Base year calculation
- 1.4.2 Key trends for market estimation
- 1.5 Primary research and validation
- 1.5.1 Primary sources
- 1.6 Forecast model
- 1.7 Research assumptions and limitations
Chapter 2 Executive Summary
- 2.1 Industry 360° synopsis, 2021 - 2034
- 2.2 Key market trends
- 2.2.1 Regional
- 2.2.2 Deployment Mode
- 2.2.3 Component
- 2.2.4 Application
- 2.2.5 Industry vertical
- 2.3 TAM Analysis, 2025-2034
- 2.4 CXO perspectives: Strategic imperatives
- 2.4.1 Executive decision points
- 2.4.2 Critical success factors
- 2.5 Future outlook and strategic recommendations
Chapter 3 Industry Insights
- 3.1 Market introduction and evolution
- 3.1.1 Historical development of computer vision technology
- 3.1.2 Current market landscape
- 3.1.3 Future outlook and emerging trends
- 3.2 Supplier landscape
- 3.2.1 Raw material and component suppliers
- 3.2.2 Hardware manufacturers
- 3.2.3 Software developers
- 3.2.4 System integrators
- 3.2.5 End users
- 3.3 Profit margin analysis
- 3.4 Technology & innovation landscape
- 3.4.1 Deep learning and neural networks
- 3.4.2 3D computer vision
- 3.4.3 Edge AI for computer vision
- 3.4.4 Augmented reality integration
- 3.4.5 Computer vision in display technology
- 3.4.6 Neuromorphic computing for vision applications
- 3.4.7 Quantum computing implications for computer vision
- 3.4.8 Synthetic data generation for training
- 3.5 Display industry-specific computer vision applications
- 3.5.1 Automated optical inspection (AOI) for displays
- 3.5.2 Defect detection in display manufacturing
- 3.5.3 Color calibration and quality control
- 3.5.4 Smart display interaction technologies
- 3.5.5 Computer vision for micro LED and OLED manufacturing
- 3.5.6 In-line process monitoring for display production
- 3.5.7 Panel uniformity assessment systems
- 3.5.8 Automated visual inspection for flexible displays
- 3.6 Industry ecosystem analysis
- 3.6.1 Vendor matrix
- 3.6.2 Distribution channel analysis
- 3.6.3 Strategic partnerships and collaborations
- 3.6.4 Industry associations and consortiums
- 3.6.5 Research and academic institutions
- 3.7 Patent analysis
- 3.7.1 Patent applications and grants by region
- 3.7.2 Key patents in display-related computer vision
- 3.7.3 Patent trend analysis
- 3.7.4 Patent litigation landscape
- 3.7.5 Emerging patent areas in display vision systems
- 3.8 Key news & initiatives
- 3.9 Regulatory landscape
- 3.9.1 Data protection regulations
- 3.9.2 Industry standards for computer vision
- 3.9.3 Regional regulatory landscape
- 3.9.4 Compliance requirements for different verticals
- 3.9.5 Future regulatory developments
- 3.10 Case studies
- 3.10.1 Computer vision in display manufacturing
- 3.10.2 Quality control applications in electronics industry
- 3.10.3 Smart retail implementation success stories
- 3.10.4 Healthcare applications of computer vision
- 3.10.5 Automotive display integration cases
- 3.11 Investment and funding landscape
- 3.11.1 Venture capital investments
- 3.11.2 Private equity funding
- 3.11.3 Corporate investments and M&A activity
- 3.11.4 Government and public funding
- 3.11.5 Investment trends by region
- 3.12 Cost structure analysis
- 3.12.1 Hardware component costs
- 3.12.2 Software development and licensing costs
- 3.12.3 Implementation and integration costs
- 3.12.4 Maintenance and support costs
- 3.12.5 Total cost of ownership analysis
- 3.13 Future technology roadmap
- 3.13.1 Short-term developments (1-2 Years)
- 3.13.2 Medium-term developments (3-5 Years)
- 3.13.3 Long-term developments (5+ Years)
- 3.13.4 Technology convergence opportunities
- 3.14 Industry best practices
- 3.14.1 Development and implementation methodologies
- 3.14.2 Quality assurance and testing frameworks
- 3.14.3 Data management and privacy practices
- 3.14.4 ROI optimization strategies
- 3.15 Market entry strategies
- 3.15.1 New product development
- 3.15.2 Strategic partnerships and alliances
- 3.15.3 Mergers and acquisitions
- 3.15.4 Regional expansion strategies
- 3.16 Sustainability and ESG analysis
- 3.16.1 Environmental impact of computer vision technologies
- 3.16.2 Social implications and ethical considerations
- 3.16.3 Governance and compliance frameworks
- 3.16.4 Sustainable development goals alignment
- 3.17 Impact forces
- 3.17.1 Growth drivers
- 3.17.1.1 Rising demand for quality inspection and automation
- 3.17.1.2 Growing integration of AI and ML technologies
- 3.17.1.3 Increasing applications in smart manufacturing
- 3.17.1.4 Advancements in deep learning algorithms
- 3.17.1.5 Proliferation of edge computing devices
- 3.17.1.6 Growing demand for contactless solutions
- 3.17.2 Industry pitfalls & challenges
- 3.17.2.1 High implementation costs
- 3.17.2.2 Technical complexity and integration challenges
- 3.17.2.3 Data privacy and security concerns
- 3.17.2.4 Limited standardization across industries
- 3.17.2.5 Computational resource requirements
- 3.17.3 Market opportunities
- 3.17.3.1 Integration with edge computing and IoT
- 3.17.3.2 Emerging applications in display manufacturing
- 3.17.3.3 Growth in retail and healthcare sectors
- 3.17.3.4 Expansion in APAC region
- 3.17.3.5 Advancements in sensor technologies
- 3.17.3.6 Cross-industry applications and solutions
- 3.17.4 Market Challenges
- 3.17.4.1 Accuracy and reliability issues
- 3.17.4.2 Skilled workforce shortage
- 3.17.4.3 Regulatory and compliance challenges
- 3.17.4.4 Environmental factors affecting performance
- 3.17.4.5 Scalability and deployment challenges
- 3.17.1 Growth drivers
- 3.18 Growth potential analysis
- 3.19 Porter’s analysis
- 3.20 PESTEL analysis
Chapter 4 Competitive Landscape, 2024
- 4.1 Market share analysis
- 4.1.1 Global market share by key players
- 4.1.2 Regional market share distribution
- 4.1.3 Tier analysis of market players
- 4.2 Competitive benchmarking
- 4.2.1 Product portfolio analysis
- 4.2.2 Business strategy analysis
- 4.2.3 R&D investment comparison
- 4.2.4 Technological capabilities assessment
- 4.3 Strategic initiatives
- 4.3.1 New product launches and innovations
- 4.3.2 Mergers and acquisitions
- 4.3.3 Partnerships and collaborations
- 4.3.4 Expansion strategies
- 4.4 Competitive dashboard
- 4.4.1 Market positioning matrix
- 4.4.2 Performance comparison matrix
- 4.4.3 Strategic developments heatmap
- 4.5 SWOT analysis of key players
- 4.5.1 Strengths and weaknesses analysis
- 4.5.2 Opportunities and threats analysis
- 4.6 Competitive positioning matrix
- 4.6.1 Leaders
- 4.6.2 Challengers
- 4.6.3 Innovators
- 4.6.4 Emerging players
- 4.7 Vendor landscape
- 4.7.1 List of distributors and channel partners
- 4.7.2 Key buying criteria
- 4.7.3 Pricing models and strategies
- 4.8 Display industry-specific competitive analysis
- 4.8.1 Computer vision solutions for display manufacturing
- 4.8.2 Quality control systems providers
- 4.8.3 Smart display technology competitors
Chapter 5 Market Estimates & Forecast, By Deployment Mode, 2021-2034 ($Bn)
- 5.1 Key trends
- 5.2 Cloud-based
- 5.2.1 Public cloud
- 5.2.2 Private cloud
- 5.2.3 Hybrid cloud
- 5.3 On-premises
- 5.3.1 Enterprise deployment
- 5.3.2 Industrial deployment
- 5.4 Edge-based
- 5.4.1 Edge computing devices
- 5.4.2 IoT-integrated systems
- 5.4.3 Smart cameras and sensors
Chapter 6 Market Estimates & Forecast, By Component, 2021-2034 ($Bn)
- 6.1 Key trends
- 6.2 Hardware
- 6.2.1 Cameras And Image Sensors
- 6.2.1.1 Industrial Cameras
- 6.2.1.2 Smart Cameras
- 6.2.1.3 3D Cameras
- 6.2.1.4 Infrared Cameras
- 6.2.2 Processors And Computing Units
- 6.2.2.1 CPUs
- 6.2.2.2 GPUs
- 6.2.2.3 FPGAs
- 6.2.2.4 ASICs
- 6.2.2.5 Edge AI Processors
- 6.2.3 Memory And Storage
- 6.2.4 Display Units
- 6.2.5 Others
- 6.2.1 Cameras And Image Sensors
- 6.3 Software
- 6.3.1 Computer Vision Platforms
- 6.3.2 Deep Learning Frameworks
- 6.3.3 Image Processing Software
- 6.3.4 Analytics Software
- 6.3.5 Custom Applications
- 6.4 Services
- 6.4.1 Professional Services
- 6.4.1.1 Consulting Services
- 6.4.1.2 Integration And Implementation
- 6.4.1.3 Training And Support
- 6.4.2 Managed services
- 6.4.2.1 Cloud-based services
- 6.4.2.2 On-premise services
- 6.4.1 Professional Services
Chapter 7 Market Estimates & Forecast, By Application, 2021-2034 ($Bn)
- 7.1 Key trends
- 7.2 Facial recognition
- 7.2.1 Security and surveillance
- 7.2.2 Access control
- 7.2.3 Emotion recognition
- 7.2.4 Marketing and customer analytics
- 7.3 Image classification
- 7.3.1 Product categorization
- 7.3.2 Content moderation
- 7.3.3 Medical image analysis
- 7.3.4 Industrial classification
- 7.4 Object detection
- 7.4.1 Retail Inventory management
- 7.4.2 Manufacturing defect detection
- 7.4.3 Security applications
- 7.4.4 Autonomous systems
- 7.5 Object tracking
- 7.5.1 Surveillance and security
- 7.5.2 Sports analytics
- 7.5.3 Retail customer tracking
- 7.5.4 Manufacturing process monitoring
- 7.6 Optical Character Recognition (OCR)
- 7.6.1 Document digitization
- 7.6.2 License plate recognition
- 7.6.3 Text recognition in manufacturing
- 7.6.4 Retail applications
- 7.7 Image Segmentation
- 7.7.1 Medical image segmentation
- 7.7.2 Industrial applications
- 7.7.3 Retail applications
- 7.7.4 Autonomous vehicles
- 7.8 Automated optical inspection
- 7.8.1 Display panel inspection
- 7.8.2 PCB inspection
- 7.8.3 Semiconductor inspection
- 7.8.4 Consumer electronics quality control
- 7.9 3D vision and depth sensing
- 7.9.1 Augmented reality applications
- 7.9.2 Robotics and automation
- 7.9.3 Smart manufacturing
- 7.9.4 Automotive applications
- 7.10 Gesture recognition
- 7.10.1 Consumer electronics
- 7.10.2 Automotive HMI
- 7.10.3 Healthcare applications
- 7.10.4 Smart home controls
- 7.11 Others
Chapter 8 Market Estimates & Forecast, By Industry Vertical, 2021-2034 ($Bn)
- 8.1 Key trends
- 8.2 Manufacturing
- 8.2.1 Electronics and semiconductor
- 8.2.1.1 Display manufacturing
- 8.2.1.2 PCB assembly
- 8.2.1.3 Semiconductor production
- 8.2.1.4 Consumer electronics
- 8.2.2 Automotive
- 8.2.3 Aerospace and defense
- 8.2.4 Pharmaceuticals
- 8.2.5 Food and beverage
- 8.2.6 Others
- 8.2.1 Electronics and semiconductor
- 8.3 Healthcare
- 8.3.1 Medical imaging and diagnostics
- 8.3.2 Patient monitoring
- 8.3.3 Surgical assistance
- 8.3.4 Healthcare administration
- 8.3.5 Others
- 8.4 Retail
- 8.4.1 Inventory management
- 8.4.2 Customer analytics
- 8.4.3 Self-checkout systems
- 8.4.4 Digital signage and smart displays
- 8.4.5 Others
- 8.5 Automotive
- 8.5.1 Advanced Driver Assistance Systems (ADAS)
- 8.5.2 Autonomous vehicles
- 8.5.3 In-cabin monitoring
- 8.5.4 Smart cockpit displays
- 8.5.5 Others
- 8.6 Security and surveillance
- 8.6.1 Public safety
- 8.6.2 Retail security
- 8.6.3 Industrial security
- 8.6.4 Residential security
- 8.6.5 Others
- 8.7 Agriculture
- 8.7.1 Crop monitoring
- 8.7.2 Livestock management
- 8.7.3 Precision farming
- 8.7.4 Others
- 8.8 Smart cities
- 8.8.1 Traffic management
- 8.8.2 Public safety
- 8.8.3 Infrastructure monitoring
- 8.8.4 Energy management
- 8.8.5 Others
- 8.9 Consumer electronics
- 8.9.1 Smartphones and tablets
- 8.9.2 Smart TVs and displays
- 8.9.3 AR/VR devices
- 8.9.4 Smart home devices
- 8.9.5 Others
- 8.10 Energy and utilities
- 8.10.1 Power grid monitoring
- 8.10.2 Renewable energy systems
- 8.10.3 Infrastructure inspection
- 8.10.4 Others
- 8.11 Others
Chapter 9 Market Estimates & Forecast, By Region, 2021-2034 ($Bn)
- 9.1 Key trends
- 9.2 North America
- 9.2.1 U.S.
- 9.2.2 Canada
- 9.3 Europe
- 9.3.1 UK
- 9.3.2 Germany
- 9.3.3 France
- 9.3.4 Italy
- 9.3.5 Spain
- 9.3.6 Russia
- 9.3.7 Nordics
- 9.4 Asia Pacific
- 9.4.1 China
- 9.4.2 India
- 9.4.3 Japan
- 9.4.4 South Korea
- 9.4.5 ANZ
- 9.4.6 Southeast Asia
- 9.5 Latin America
- 9.5.1 Brazil
- 9.5.2 Mexico
- 9.5.3 Argentina
- 9.6 MEA
- 9.6.1 South Africa
- 9.6.2 Saudi Arabia
- 9.6.3 UAE
Chapter 10 Company Profiles
- 10.1 Global Technology Leaders
- 10.1.1 NVIDIA
- 10.1.2 Intel
- 10.1.3 Microsoft
- 10.1.4 IBM
- 10.1.5 Google
- 10.1.6 Qualcomm
- 10.1.7 Sony
- 10.2 Industrial Vision and Automation Specialists
- 10.2.1 Cognex
- 10.2.2 Keyence
- 10.2.3 Basler
- 10.2.4 Omron
- 10.2.5 Teledyne
- 10.3 AI and Vision Software Innovators
- 10.3.1 Clarifai
- 10.3.2 Matterport
- 10.3.3 Visionatics
- 10.3.4 SmartCow
- 10.3.5 ZH-AOI
- 10.4 Semiconductor and Component Suppliers
- 10.4.1 MediaTek
- 10.4.2 Himax
- 10.4.3 Renesas Electronics
- 10.4.4 AUO Display Plus (ADP)
- 10.5 Edge Computing and Embedded Vision Companies
- 10.5.1 Aetina
- 10.5.2 Advantech
- 10.5.3 AAEON
- 10.5.4 Neousys
 監控領域電腦視覺市場:按組件、技術、部署、應用和最終用戶分類-2026-2032年全球市場預測自動化市場中的電腦視覺:按組件、技術、應用和最終用戶產業分類-2026-2032年全球市場預測製造業電腦視覺市場:2026-2032年全球市場預測(按交付方式、規模、資料類型、應用、產業、企業規模和部署類型分類)電腦視覺在導航領域的市場:按組件、技術、車輛類型、應用、部署模式和最終用戶產業分類-2026-2032年全球市場預測電腦視覺市場:按組件、技術和應用分類-2026-2032年全球市場預測
 2026年全球電腦視覺市場報告
 電腦視覺市場分析及預測(至2035年):按類型、產品類型、服務、技術、組件、應用、最終用戶、功能、部署類型和解決方案分類
 電腦視覺市場規模、佔有率、成長及全球產業分析:按類型、應用和地區分類的洞察,2026-2034 年預測
 2026-2030年全球醫療保健電腦視覺市場
 電腦視覺市場-全球產業規模、佔有率、趨勢、機會和預測,按組件、產品類型、應用、垂直產業、地區和競爭格局分類,2021-2031年預測