

 |
市場調查報告書
商品編碼
1801869
節能照明市場機會、成長動力、產業趨勢分析及2025-2034年預測Energy Efficient Lighting Market Opportunity, Growth Drivers, Industry Trend Analysis, and Forecast 2025 - 2034 |
||||||
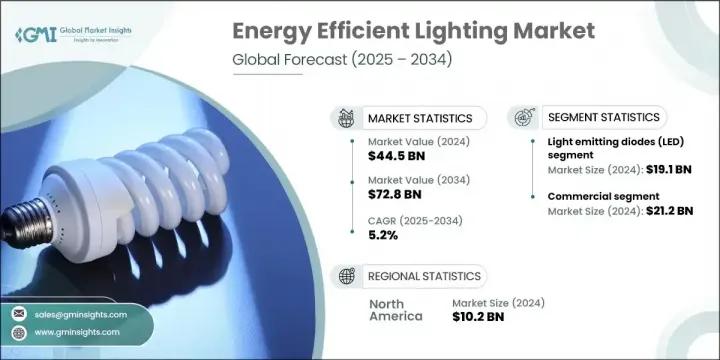
2024年,全球節能照明市場規模達445億美元,預計到2034年將以5.2%的複合年成長率成長,達到728億美元。全球對永續發展和淨零碳目標的日益追求推動了這一成長,促使節能照明技術得到大規模應用。照明佔全球電力消耗總量的15-20%,提高該領域的能源效率可顯著減少能源消耗和排放。各國政府、企業和消費者都逐漸意識到節能解決方案的價值,這使得市場在未來幾年保持強勁、持續的成長動能。
塑造市場的一個重要趨勢是照明系統與物聯網 (IoT) 技術的整合。這些智慧照明系統擴大嵌入感測器,支援動態調光、即時使用監控和預測性維護,與更廣泛的智慧建築和智慧城市計劃相契合。另一個不斷發展的趨勢是晝夜節律和以人為本的照明設計,這些設計可以自動調節亮度和色溫,以配合人體自然節律。這些可調節的解決方案正被應用於住宅和商業空間,以增強健康、提高注意力並支持心理健康——這標誌著照明在生活方式和舒適度方面發揮著越來越重要的作用。
| 市場範圍 | |
|---|---|
| 起始年份 | 2024 |
| 預測年份 | 2025-2034 |
| 起始值 | 445億美元 |
| 預測值 | 728億美元 |
| 複合年成長率 | 5.2% |
2024年,LED照明市場規模將達到191億美元,這得益於LED照明卓越的能源效率、更長的使用壽命以及成本的下降。隨著商業和住宅建築活動的增加,人們正在加速更換老舊低效照明系統。逐步淘汰傳統照明技術的監管政策也推動了LED照明的普及。受LED元件價格下降以及全球智慧家居和智慧城市基礎設施項目需求成長的共同推動,預計該市場將實現更快成長。
2024年,商業照明市場規模達212億美元,預計到2034年將以5.6%的複合年成長率成長。辦公室、醫療機構、零售店和飯店場所正在轉向智慧照明系統,以提高營運效率並降低能源支出。隨著設施管理人員和業主尋求自動化驅動的解決方案以節約能源並符合永續發展要求,商業房地產(尤其是在北美和歐洲)的智慧照明應用日益受到青睞。
2024年,美國節能照明市場規模達89.5億美元。嚴格的能源效率要求以及公共和私人商業建築中智慧LED技術的日益普及,推動了美國市場的擴張。聯邦和地方計畫在推動節能改造、綠色認證和節省成本的能源升級方面繼續發揮關鍵作用,使美國成為先進照明解決方案的領先採用者。
塑造全球節能照明市場競爭格局的關鍵公司包括伊頓公司、施耐德電氣、歐司朗照明股份公司(ams OSRAM)、Signify NV 和 Acuity Brands, Inc.。節能照明市場的領先公司正在部署多方面的策略以擴大其市場覆蓋範圍。核心策略包括開發先進的物聯網智慧照明系統,並提供將照明與暖通空調和安防相結合的整合式能源管理平台。各公司正在投資研發,以提供可調節、以人為本的照明,從而支持健康和永續發展目標。向新興經濟體的擴張以及與建築和自動化公司的合作,有助於在城市基礎設施和工業區擴大部署。
目錄
第1章:方法論與範圍
第2章:執行摘要
第3章:行業洞察
- 產業生態系統分析
- 供應商格局
- 利潤率
- 成本結構
- 每個階段的增值
- 影響價值鏈的因素
- 中斷
- 產業衝擊力
- 成長動力
- 全球永續性和淨零目標
- LED 的技術進步和成本下降
- 政府法規、禁令和能源激勵措施
- 智慧城市和物聯網照明解決方案
- 都市化和商業基礎設施成長
- 產業陷阱與挑戰
- 前期成本高,改造挑戰大
- 回收和電子垃圾問題
- 市場機會
- 成長動力
- 成長潛力分析
- 監管格局
- 北美洲
- 歐洲
- 亞太地區
- 拉丁美洲
- 中東和非洲
- 波特的分析
- PESTEL分析
- 技術和創新格局
- 當前的技術趨勢
- 新興技術
- 價格趨勢
- 按地區
- 按產品
- 定價策略
- 新興商業模式
- 合規性要求
- 消費者情緒分析
- 專利和智慧財產權分析
- 地緣政治與貿易動態
第4章:競爭格局
- 介紹
- 公司市佔率分析
- 按地區
- 市場集中度分析
- 關鍵參與者的競爭基準
- 財務績效比較
- 收入
- 利潤率
- 研發
- 產品組合比較
- 產品範圍廣度
- 科技
- 創新
- 地理位置比較
- 全球足跡分析
- 服務網路覆蓋
- 各地區市場滲透率
- 競爭定位矩陣
- 領導者
- 挑戰者
- 追蹤者
- 利基市場參與者
- 戰略展望矩陣
- 財務績效比較
- 2021-2024 年關鍵發展
- 併購
- 夥伴關係和合作
- 技術進步
- 擴張和投資策略
- 數位轉型舉措
- 新興/新創企業競爭對手格局
第5章:市場估計與預測:按來源,2021 - 2034 年
- 主要趨勢
- 高強度放電燈(HID)
- 線性螢光燈(LFL)
- 發光二極體(LED)
- 其他
第6章:市場估計與預測:按應用,2021 - 2034 年
- 主要趨勢
- 家
- 商業的
- 工業的
第7章:市場估計與預測:按地區,2021 - 2034 年
- 主要趨勢
- 北美洲
- 美國
- 加拿大
- 歐洲
- 英國
- 德國
- 法國
- 義大利
- 西班牙
- 荷蘭
- 亞太地區
- 中國
- 印度
- 日本
- 韓國
- 澳洲
- 拉丁美洲
- 巴西
- 墨西哥
- 阿根廷
- MEA
- 南非
- 沙烏地阿拉伯
- 阿拉伯聯合大公國
第8章:公司簡介
- Acuity Brands, Inc.
- Cree Lighting
- Dialight plc
- Eaton Corporation plc (Cooper Lighting Solutions)
- GE Current, a Daintree company
- Havells India Ltd.
- Hubbell Incorporated
- Legrand SA
- Nichia Corporation
- OSRAM Licht AG (ams OSRAM)
- Panasonic Holdings Corporation
- Samsung Electronics Co., Ltd.
- Schneider Electric SE
- Signify NV (Philips Lighting)
- Zumtobel Group AG
The Global Energy Efficient Lighting Market was valued at USD 44.5 billion in 2024 and is estimated to grow at a CAGR of 5.2% to reach USD 72.8 billion by 2034. This growth is fueled by the rising global push for sustainability and net-zero carbon targets, which is prompting large-scale adoption of energy-saving lighting technologies. With lighting accounting for 15-20% of total global electricity consumption, improving efficiency in this sector offers measurable reductions in energy use and emissions. Governments, businesses, and consumers alike are recognizing the value of energy-efficient solutions, positioning the market for strong, consistent growth in the years ahead.
A significant trend shaping the market is the integration of lighting systems with Internet of Things (IoT) technologies. These smart lighting systems are increasingly embedded with sensors that support dynamic dimming, real-time usage monitoring, and predictive maintenance, aligning with broader smart building and smart city initiatives. Another evolving preference is for circadian and human-centric lighting designs that automatically adjust brightness and color temperature to complement natural human rhythms. These tunable solutions are being incorporated in both residential and commercial spaces to enhance wellness, improve concentration, and support mental health-marking a shift where lighting plays a larger role in lifestyle and comfort.
| Market Scope | |
|---|---|
| Start Year | 2024 |
| Forecast Year | 2025-2034 |
| Start Value | $44.5 Billion |
| Forecast Value | $72.8 Billion |
| CAGR | 5.2% |
The LED segment generated USD 19.1 billion in 2024, driven by LED lighting's strong energy performance, extended operational life, and declining costs. The push toward replacing older, inefficient lighting systems is accelerating as construction activity increases across commercial and residential spaces. Regulatory policies phasing out legacy lighting technologies are also boosting LED adoption. The segment is expected to see faster growth due to a combination of falling LED component prices and rising demand from smart homes and smart city infrastructure projects worldwide.
The commercial segment was valued at USD 21.2 billion in 2024 and is estimated to grow at a CAGR of 5.6% through 2034. Offices, healthcare facilities, retail outlets, and hospitality spaces are turning to intelligent lighting systems to improve operational efficiency and reduce energy expenses. Smart lighting implementation in commercial properties, particularly in North America and Europe, has gained traction as facility managers and property owners seek automation-driven solutions for energy savings and sustainability compliance.
U.S. Energy Efficient Lighting Market was valued at USD 8.95 billion in 2024. Market expansion in the country is backed by stringent efficiency mandates and growing deployment of smart LED technologies in public and private commercial buildings. Federal and regional programs continue to play a key role in promoting retrofitting, green certifications, and cost-saving energy upgrades, making the U.S. a leading adopter of advanced lighting solutions.
Key companies shaping the competitive landscape of the Global Energy Efficient Lighting Market include Eaton Corporation, Schneider Electric SE, OSRAM Licht AG (ams OSRAM), Signify N.V., and Acuity Brands, Inc. Leading companies in the Energy Efficient Lighting Market are deploying multifaceted strategies to expand their market reach. Core tactics include developing advanced IoT-enabled smart lighting systems and offering integrated energy management platforms that combine lighting with HVAC and security. Firms are investing in R&D to deliver tunable and human-centric lighting that supports wellness and sustainability goals. Expansion into emerging economies and partnerships with construction and automation firms are helping to scale deployment across urban infrastructure and industrial zones.
Table of Contents
Chapter 1 Methodology & Scope
- 1.1 Market scope and definition
- 1.2 Research design
- 1.2.1 Research approach
- 1.2.2 Data collection methods
- 1.3 Data mining sources
- 1.3.1 Global
- 1.3.2 Regional/Country
- 1.4 Base estimates and calculations
- 1.4.1 Base year calculation
- 1.4.2 Key trends for market estimation
- 1.5 Primary research and validation
- 1.5.1 Primary sources
- 1.6 Forecast model
- 1.7 Research assumptions and limitations
Chapter 2 Executive Summary
- 2.1 Industry 3600 synopsis
- 2.2 Key market trends
- 2.2.1 Component trends
- 2.2.2 Training type trends
- 2.2.3 Training device trends
- 2.2.4 Platform type trends
- 2.2.5 End use trends
- 2.2.6 Regional trends
- 2.3 TAM Analysis, 2025-2034 (USD Billion)
- 2.4 CXO perspectives: Strategic imperatives
- 2.4.1 Executive decision points
- 2.4.2 Critical success factors
- 2.5 Future outlook and strategic recommendations
Chapter 3 Industry Insights
- 3.1 Industry ecosystem analysis
- 3.1.1 Supplier landscape
- 3.1.2 Profit margin
- 3.1.3 Cost structure
- 3.1.4 Value addition at each stage
- 3.1.5 Factor affecting the value chain
- 3.1.6 Disruptions
- 3.2 Industry impact forces
- 3.2.1 Growth drivers
- 3.2.1.1 Global sustainability and net-zero goals
- 3.2.1.2 Technological advancements and declining costs of LEDs
- 3.2.1.3 Government regulations, bans, and energy incentives
- 3.2.1.4 Smart cities and IoT-enabled lighting solutions
- 3.2.1.5 Urbanization and commercial infrastructure growth
- 3.2.2 Industry pitfalls and challenges
- 3.2.2.1 High upfront costs and retrofit challenges
- 3.2.2.2 Recycling and E-Waste concerns
- 3.2.3 Market opportunities
- 3.2.1 Growth drivers
- 3.3 Growth potential analysis
- 3.4 Regulatory landscape
- 3.4.1 North America
- 3.4.2 Europe
- 3.4.3 Asia Pacific
- 3.4.4 Latin America
- 3.4.5 Middle East & Africa
- 3.5 Porter’s analysis
- 3.6 PESTEL analysis
- 3.7 Technology and innovation landscape
- 3.7.1 Current technological trends
- 3.7.2 Emerging technologies
- 3.8 Price trends
- 3.8.1 By region
- 3.8.2 By product
- 3.9 Pricing strategies
- 3.10 Emerging business models
- 3.11 Compliance requirements
- 3.12 Consumer sentiment analysis
- 3.13 Patent and IP analysis
- 3.14 Geopolitical and trade dynamics
Chapter 4 Competitive Landscape, 2024
- 4.1 Introduction
- 4.2 Company market share analysis
- 4.2.1 By region
- 4.2.1.1 North America
- 4.2.1.2 Europe
- 4.2.1.3 Asia Pacific
- 4.2.1.4 Latin America
- 4.2.1.5 MEA
- 4.2.2 Market concentration analysis
- 4.2.1 By region
- 4.3 Competitive benchmarking of key players
- 4.3.1 Financial performance comparison
- 4.3.1.1 Revenue
- 4.3.1.2 Profit margin
- 4.3.1.3 R&D
- 4.3.2 Product portfolio comparison
- 4.3.2.1 Product range breadth
- 4.3.2.2 Technology
- 4.3.2.3 Innovation
- 4.3.3 Geographic presence comparison
- 4.3.3.1 Global footprint analysis
- 4.3.3.2 Service network coverage
- 4.3.3.3 Market penetration by region
- 4.3.4 Competitive positioning matrix
- 4.3.4.1 Leaders
- 4.3.4.2 Challengers
- 4.3.4.3 Followers
- 4.3.4.4 Niche players
- 4.3.5 Strategic outlook matrix
- 4.3.1 Financial performance comparison
- 4.4 Key developments, 2021-2024
- 4.4.1 Mergers and acquisitions
- 4.4.2 Partnerships and collaborations
- 4.4.3 Technological advancements
- 4.4.4 Expansion and investment strategies
- 4.4.5 Digital transformation initiatives
- 4.5 Emerging/ Startup competitors landscape
Chapter 5 Market estimates and forecast, by Source, 2021 - 2034 (USD Billion)
- 5.1 Key trends
- 5.2 High-intensity discharge lamps (HID)
- 5.3 Linear fluorescent lamps (LFL)
- 5.4 Light emitting diodes (LED)
- 5.5 Others
Chapter 6 Market estimates and forecast, by Application, 2021 - 2034 (USD Billion)
- 6.1 Key trends
- 6.2 Home
- 6.3 Commercial
- 6.4 Industrial
Chapter 7 Market Estimates & Forecast, By Region, 2021 - 2034 (USD Billion)
- 7.1 Key trends
- 7.2 North America
- 7.2.1 U.S.
- 7.2.2 Canada
- 7.3 Europe
- 7.3.1 UK
- 7.3.2 Germany
- 7.3.3 France
- 7.3.4 Italy
- 7.3.5 Spain
- 7.3.6 Netherlands
- 7.4 Asia Pacific
- 7.4.1 China
- 7.4.2 India
- 7.4.3 Japan
- 7.4.4 South Korea
- 7.4.5 Australia
- 7.5 Latin America
- 7.5.1 Brazil
- 7.5.2 Mexico
- 7.5.3 Argentina
- 7.6 MEA
- 7.6.1 South Africa
- 7.6.2 Saudi Arabia
- 7.6.3 UAE
Chapter 8 Company Profiles
- 8.1 Acuity Brands, Inc.
- 8.2 Cree Lighting
- 8.3 Dialight plc
- 8.4 Eaton Corporation plc (Cooper Lighting Solutions)
- 8.5 GE Current, a Daintree company
- 8.6 Havells India Ltd.
- 8.7 Hubbell Incorporated
- 8.8 Legrand S.A.
- 8.9 Nichia Corporation
- 8.10 OSRAM Licht AG (ams OSRAM)
- 8.11 Panasonic Holdings Corporation
- 8.12 Samsung Electronics Co., Ltd.
- 8.13 Schneider Electric SE
- 8.14 Signify N.V. (Philips Lighting)
- 8.15 Zumtobel Group AG
 節能照明市場:依產品類型、應用、終端用戶產業及通路分類-2026-2032年全球預測
 全球節能照明技術市場規模、佔有率、趨勢及成長分析報告(2026-2034)
 日本節能維修市場規模、佔有率、趨勢和預測:按產品、應用和地區分類,2026-2034年
 2026年全球節能照明市場報告2026年全球高強度氣體放電燈(HID燈)市場報告
 2032 年全球節能燈具市場預測:依產品類型、光源、應用、最終用戶和地區分類
 節能電器市場規模、佔有率、趨勢分析報告:按產品、最終用途、地區、細分市場預測,2025-2030 年
 節能照明技術市場,按類型、應用、國家和地區 - 2024-2032 年行業分析、市場規模、市場佔有率和預測
 固態照明與節能照明市場:全球產業分析,規模,佔有率,成長,趨勢,2024~2033年預測