

 |
市場調查報告書
商品編碼
1801812
無線感測器市場機會、成長動力、產業趨勢分析及 2025 - 2034 年預測Wireless Sensor Market Opportunity, Growth Drivers, Industry Trend Analysis, and Forecast 2025 - 2034 |
||||||
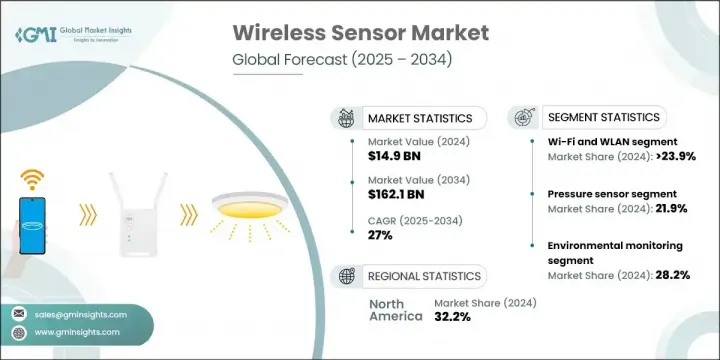
2024年,全球無線感測器市場規模達149億美元,預計2034年將以27%的複合年成長率成長,達到1,621億美元。推動這一成長的因素包括各行各業自動化程度的提高、機器人應用的急劇成長以及對智慧基礎設施的持續投資。汽車產業正發揮關鍵作用,尤其是在對先進駕駛輔助系統和自動駕駛技術的需求方面。隨著工業生態系統的現代化,無線感測器對於即時資料採集和遠端監控至關重要,有助於降低佈線複雜性並實現更靈活的系統配置。
從智慧城市到工業 4.0 轉型,這些感測器在實現預測分析、系統最佳化和互聯營運方面發揮著重要作用。它們是機器、基礎設施和設備無縫互動的智慧環境的支柱。在製造業中,無線感測器支援基於狀態的監控,透過早期故障檢測和維護警報最大限度地減少非計劃性停機時間。在智慧城市中,它們支援即時追蹤空氣品質、交通流量、能源使用和公共安全系統,幫助城市規劃人員做出數據驅動的決策。在能源和公用事業領域,無線感測器最佳化負載分配,監控電網性能,並支援遠端資產管理。它們的作用也延伸到供應鏈,感測器可以增強供應鏈的可視性、可追溯性和庫存控制。
| 市場範圍 | |
|---|---|
| 起始年份 | 2024 |
| 預測年份 | 2025-2034 |
| 起始值 | 149億美元 |
| 預測值 | 1621億美元 |
| 複合年成長率 | 27% |
2034年,Wi-Fi和WLAN技術領域的複合年成長率將達到28.2%。 Wi-Fi 6E和Wi-Fi 7等標準的進步,使其在企業網路、智慧家庭和消費性電子產品中的廣泛應用成為可能。這些標準在高密度環境中提供了更低的延遲、更快的速度和更佳的設備處理能力。這些改進將進一步增強其在串流媒體、工業物聯網和遊戲應用中的作用。
2024年,壓力感測器市場將以應用類型為主,廣泛應用於製造、汽車、醫療保健和氣候控制系統等領域。壓力感測器能夠提供即時、高精度的資料,這對於需要在關鍵任務系統中進行嚴格監控和精確控制的操作至關重要。
受智慧製造的快速發展和低功耗無線技術的廣泛應用推動,北美無線感測器市場在2024年佔據了32.2%的市場佔有率。主要感測器製造商正在加大研發力度,專注於能源效率、邊緣運算和協議標準化。近期,美國城市無線感測器網路的擴展支持了即時環境監測,從而改善了城市規劃和公共衛生計畫的數據驅動決策。
全球無線感測器市場的主要參與者包括霍尼韋爾國際公司、艾默生電氣公司、西門子股份公司、ABB 有限公司和德州儀器公司。領先的公司優先投資產品創新,以開發支援邊緣運算的超低功耗和高度整合的感測器平台。他們正在擴大與工業物聯網供應商的策略合作夥伴關係,將感測器整合到端到端解決方案中。企業也正在進入醫療保健和智慧農業等新的應用垂直領域,以實現市場覆蓋多元化。大量的研發預算被用於增強連接協議和最佳化即時分析性能。許多參與者也正在加強全球分銷網路和數位平台,以提高市場滲透率和售後支持,同時積極探索合併與合作,以擴大技術能力和地理覆蓋範圍。
目錄
第1章:方法論與範圍
第2章:執行摘要
第3章:行業洞察
- 產業生態系統分析
- 供應商格局
- 利潤率
- 成本結構
- 每個階段的增值
- 影響價值鏈的因素
- 中斷
- 產業衝擊力
- 成長動力
- 節能科技的採用日益增多
- 全球汽車工業蓬勃發展
- 工業自動化和工業 4.0 的採用日益成長
- 遠端監控和資產追蹤的需求
- 全球對智慧基礎設施的投資不斷增加
- 產業陷阱與挑戰
- 缺乏標準化
- 電源和電池限制
- 市場機會
- 全球智慧城市擴張
- 精準農業的成長
- 醫療保健和遠距病人監控
- 能量收集的進步
- 成長動力
- 成長潛力分析
- 監管格局
- 北美洲
- 歐洲
- 亞太地區
- 拉丁美洲
- 中東和非洲
- 波特的分析
- PESTEL分析
- 技術和創新格局
- 當前的技術趨勢
- 新興技術
- 價格趨勢
- 按地區
- 按產品
- 定價策略
- 新興商業模式
- 合規性要求
- 永續性措施
- 專利和智慧財產權分析
- 地緣政治與貿易動態
第4章:競爭格局
- 介紹
- 公司市佔率分析
- 按地區
- 市場集中度分析
- 關鍵參與者的競爭基準
- 財務績效比較
- 收入
- 利潤率
- 研發
- 產品組合比較
- 產品範圍廣度
- 科技
- 創新
- 地理位置比較
- 全球足跡分析
- 服務網路覆蓋
- 各地區市場滲透率
- 競爭定位矩陣
- 領導者
- 挑戰者
- 追蹤者
- 利基市場參與者
- 戰略展望矩陣
- 財務績效比較
- 2021-2024 年關鍵發展
- 併購
- 夥伴關係和合作
- 技術進步
- 擴張和投資策略
- 數位轉型舉措
- 新興/新創企業競爭對手格局
第5章:市場估計與預測:按感測器類型,2021 - 2034 年
- 主要趨勢
- 生物感測器
- 溫度感測器
- 壓力感測器
- 濕度感測器
- 氣體/化學感測器
- 流量感測器
- 液位感測器
- 運動和定位感測器
- 其他
第6章:市場估計與預測:依技術,2021-2034 年
- 主要趨勢
- 藍牙
- Wi-Fi 和 WLAN
- Zigbee
- 無線HART
- 射頻識別
- EnOcean
- 其他
第7章:市場估計與預測:按應用,2021-2034
- 主要趨勢
- 環境監測
- 資產追蹤
- 結構健康監測
- 能源管理
- 安全和監控
- 其他
第8章:市場估計與預測:依最終用途,2021-2034
- 主要趨勢
- 汽車
- 衛生保健
- 工業的
- 消費性電子產品
- 農業
- 航太與國防
- 運輸與物流
- 其他
第9章:市場估計與預測:按地區,2021 - 2034 年
- 主要趨勢
- 北美洲
- 美國
- 加拿大
- 歐洲
- 德國
- 英國
- 法國
- 義大利
- 西班牙
- 荷蘭
- 亞太地區
- 中國
- 印度
- 日本
- 澳洲
- 韓國
- 拉丁美洲
- 巴西
- 墨西哥
- 阿根廷
- MEA
- 南非
- 沙烏地阿拉伯
- 阿拉伯聯合大公國
第10章:公司簡介
- 全球關鍵參與者
- Honeywell International
- Texas Instruments Inc
- Siemens AG
- ABB Ltd.
- Emerson Electric Co.
- 區域關鍵參與者
- 北美洲
- Analog Devices Inc.
- Cisco Systems Inc.
- Monnit Corporation
- 歐洲
- STMicroelectronics NV
- Infineon Technologies AG
- TE Connectivity Ltd.
- NXP Semiconductors NV
- 亞太地區
- Yokogawa Electric Corporation
- Huawei Investment Holding Co., Ltd.
- Toshiba Corporation
- Holykell Technology Co., Ltd.
- 北美洲
- 利基市場參與者/顛覆者
- BAE Systems PLC
- Phoenix Sensors LLC
- IntelliSense.io
- Inovonics Corporation
The Global Wireless Sensor Market was valued at USD 14.9 billion in 2024 and is estimated to grow at a CAGR of 27% to reach USD 162.1 billion by 2034. The expansion is fueled by rising automation across industries, a sharp increase in robotics adoption, and continued investment in smart infrastructure. The automotive sector is playing a key role, particularly with demand for advanced driver-assistance systems and autonomous technologies. As industrial ecosystems modernize, wireless sensors are becoming essential to real-time data capture and remote monitoring, helping reduce wiring complexity and enabling more flexible system configurations.
From smart cities to Industry 4.0 transformations, these sensors are instrumental in enabling predictive analytics, system optimization, and connected operations. They serve as the backbone for intelligent environments where machines, infrastructure, and devices interact seamlessly. In manufacturing, wireless sensors support condition-based monitoring, minimizing unplanned downtime through early fault detection and maintenance alerts. Within smart cities, they power real-time tracking of air quality, traffic flow, energy usage, and public safety systems-helping urban planners make data-driven decisions. In energy and utilities, wireless sensors optimize load distribution, monitor grid performance, and enable remote asset management. Their role extends to supply chains as well, where sensors enhance visibility, traceability, and inventory control.
| Market Scope | |
|---|---|
| Start Year | 2024 |
| Forecast Year | 2025-2034 |
| Start Value | $14.9 billion |
| Forecast Value | $162.1 Billion |
| CAGR | 27% |
The Wi-Fi and WLAN technology segment will grow at a CAGR of 28.2% through 2034. Its high adoption across enterprise networks, smart homes, and consumer electronics is supported by advancements in standards like Wi-Fi 6E and Wi-Fi 7, which offer lower latency, enhanced speeds, and improved device handling in high-density environments. These improvements are further strengthening its role in streaming, industrial IoT, and gaming applications.
In 2024, the pressure sensors segment will be dominated by application type, widely deployed in sectors such as manufacturing, automotive, healthcare, and climate control systems. Their ability to deliver real-time, highly accurate data makes them vital for operations requiring tight monitoring and precise control across mission-critical systems.
North America Wireless Sensor Market held 32.2% share in 2024, driven by rapid advances in smart manufacturing and widespread deployment of low-power wireless technologies. Major sensor manufacturers are boosting R&D to focus on energy efficiency, edge computing, and protocol standardization. Recent expansions of wireless sensor networks in American cities have supported real-time environmental monitoring, improving data-driven decisions for urban planning and public health initiatives.
Key players in the Global Wireless Sensor Market include Honeywell International, Inc., Emerson Electric Co., Siemens AG, ABB Ltd., and Texas Instruments Incorporated. Leading companies are prioritizing investments in product innovation to develop ultra-low power and highly integrated sensor platforms that support edge computing. They are expanding strategic partnerships with industrial IoT providers to integrate sensors into end-to-end solutions. Firms are also entering new application verticals such as healthcare and smart agriculture to diversify market reach. Significant R&D budgets are being directed toward enhancing connectivity protocols and optimizing performance for real-time analytics. Many players are also strengthening global distribution networks and digital platforms to improve market penetration and after-sales support, while actively exploring mergers and collaborations to scale technological capabilities and geographic footprint.
Table of Contents
Chapter 1 Methodology and Scope
- 1.1 Market scope and definition
- 1.2 Research design
- 1.2.1 Research approach
- 1.2.2 Data collection methods
- 1.3 Data mining sources
- 1.3.1 Global
- 1.3.2 Regional/Country
- 1.4 Base estimates and calculations
- 1.4.1 Base year calculation
- 1.4.2 Key trends for market estimation
- 1.5 Primary research and validation
- 1.5.1 Primary sources
- 1.6 Forecast model
- 1.7 Research assumptions and limitations
Chapter 2 Executive Summary
- 2.1 Industry 3600 synopsis
- 2.2 Key market trends
- 2.2.1 Sensor type
- 2.2.2 Technology
- 2.2.3 Application
- 2.2.4 End use
- 2.2.5 Regional
- 2.3 TAM Analysis, 2025-2034 (USD Billion)
- 2.4 CXO perspectives: Strategic imperatives
- 2.4.1 Executive decision points
- 2.4.2 Critical success factors
- 2.5 Future outlook and strategic recommendations
Chapter 3 Industry Insights
- 3.1 Industry ecosystem analysis
- 3.1.1 Supplier landscape
- 3.1.2 Profit margin
- 3.1.3 Cost structure
- 3.1.4 Value addition at each stage
- 3.1.5 Factor affecting the value chain
- 3.1.6 Disruptions
- 3.2 Industry impact forces
- 3.2.1 Growth drivers
- 3.2.1.1 Rising adoption of energy-efficient technologies
- 3.2.1.2 Growing automotive industries worldwide
- 3.2.1.3 Growing industrial automation and Industry 4.0 adoption
- 3.2.1.4 Demand for remote monitoring and asset tracking
- 3.2.1.5 Rising investment in smart infrastructure worldwide
- 3.2.2 Industry pitfalls and challenges
- 3.2.2.1 Lack of standardization
- 3.2.2.2 Power and battery limitations
- 3.2.3 Market opportunities
- 3.2.3.1 Expansion of smart cities across the globe
- 3.2.3.2 Growth in precision agriculture
- 3.2.3.3 Healthcare and remote patient monitoring
- 3.2.3.4 Advancements in energy harvesting
- 3.2.1 Growth drivers
- 3.3 Growth potential analysis
- 3.4 Regulatory landscape
- 3.4.1 North America
- 3.4.2 Europe
- 3.4.3 Asia Pacific
- 3.4.4 Latin America
- 3.4.5 Middle East & Africa
- 3.5 Porter’s analysis
- 3.6 PESTEL analysis
- 3.7 Technology and innovation landscape
- 3.7.1 Current technological trends
- 3.7.2 Emerging technologies
- 3.8 Price trends
- 3.8.1 By region
- 3.8.2 By product
- 3.9 Pricing strategies
- 3.10 Emerging business models
- 3.11 Compliance requirements
- 3.12 Sustainability measures
- 3.13 Patent and IP analysis
- 3.14 Geopolitical and trade dynamics
Chapter 4 Competitive Landscape, 2024
- 4.1 Introduction
- 4.2 Company market share analysis
- 4.2.1 By region
- 4.2.1.1 North America
- 4.2.1.2 Europe
- 4.2.1.3 Asia Pacific
- 4.2.1.4 Latin America
- 4.2.1.5 MEA
- 4.2.2 Market concentration analysis
- 4.2.1 By region
- 4.3 Competitive benchmarking of key players
- 4.3.1 Financial performance comparison
- 4.3.1.1 Revenue
- 4.3.1.2 Profit margin
- 4.3.1.3 R&D
- 4.3.2 Product portfolio comparison
- 4.3.2.1 Product range breadth
- 4.3.2.2 Technology
- 4.3.2.3 Innovation
- 4.3.3 Geographic presence comparison
- 4.3.3.1 Global footprint analysis
- 4.3.3.2 Service network coverage
- 4.3.3.3 Market penetration by region
- 4.3.4 Competitive positioning matrix
- 4.3.4.1 Leaders
- 4.3.4.2 Challengers
- 4.3.4.3 Followers
- 4.3.4.4 Niche Players
- 4.3.5 Strategic outlook matrix
- 4.3.1 Financial performance comparison
- 4.4 Key developments, 2021-2024
- 4.4.1 Mergers and acquisitions
- 4.4.2 Partnerships and collaborations
- 4.4.3 Technological advancements
- 4.4.4 Expansion and investment strategies
- 4.4.5 Digital transformation initiatives
- 4.5 Emerging/ startup competitors landscape
Chapter 5 Market Estimates and Forecast, By Sensor Type, 2021 - 2034 (USD Million & Units)
- 5.1 Key trends
- 5.2 Biosensors
- 5.3 Temperature sensors
- 5.4 Pressure sensors
- 5.5 Humidity sensors
- 5.6 Gas / chemical sensors
- 5.7 Flow sensors
- 5.8 Level sensors
- 5.9 Motion & positioning sensors
- 5.10 Others
Chapter 6 Market Estimates & Forecast, By Technology, 2021-2034 (USD Million & Units)
- 6.1 Key trends
- 6.2 Bluetooth
- 6.3 Wi-Fi and WLAN
- 6.4 Zigbee
- 6.5 Wireless HART
- 6.6 RFID
- 6.7 EnOcean
- 6.8 Others
Chapter 7 Market Estimates & Forecast, By Application, 2021-2034 (USD Million & Units)
- 7.1 Key trends
- 7.2 Environmental monitoring
- 7.3 Asset tracking
- 7.4 Structural health monitoring
- 7.5 Energy management
- 7.6 Security and surveillance
- 7.7 Others
Chapter 8 Market Estimates & Forecast, By End Use, 2021-2034 (USD Million & Units)
- 8.1 Key trends
- 8.2 Automotive
- 8.3 Healthcare
- 8.4 Industrial
- 8.5 Consumer electronics
- 8.6 Agriculture
- 8.7 Aerospace & defense
- 8.8 Transportation & logistics
- 8.9 Others
Chapter 9 Market Estimates & Forecast, By Region, 2021 - 2034 (USD Million & Units)
- 9.1 Key trends
- 9.2 North America
- 9.2.1 U.S.
- 9.2.2 Canada
- 9.3 Europe
- 9.3.1 Germany
- 9.3.2 UK
- 9.3.3 France
- 9.3.4 Italy
- 9.3.5 Spain
- 9.3.6 Netherlands
- 9.4 Asia Pacific
- 9.4.1 China
- 9.4.2 India
- 9.4.3 Japan
- 9.4.4 Australia
- 9.4.5 South Korea
- 9.5 Latin America
- 9.5.1 Brazil
- 9.5.2 Mexico
- 9.5.3 Argentina
- 9.6 MEA
- 9.6.1 South Africa
- 9.6.2 Saudi Arabia
- 9.6.3 UAE
Chapter 10 Company Profiles
- 10.1 Global Key Players
- 10.1.1 Honeywell International
- 10.1.2 Texas Instruments Inc
- 10.1.3 Siemens AG
- 10.1.4 ABB Ltd.
- 10.1.5 Emerson Electric Co.
- 10.2 Regional Key Players
- 10.2.1 North America
- 10.2.1.1 Analog Devices Inc.
- 10.2.1.2 Cisco Systems Inc.
- 10.2.1.3 Monnit Corporation
- 10.2.2 Europe
- 10.2.2.1 STMicroelectronics N.V.
- 10.2.2.2 Infineon Technologies AG
- 10.2.2.3 TE Connectivity Ltd.
- 10.2.2.4 NXP Semiconductors N.V.
- 10.2.3 APAC
- 10.2.3.1 Yokogawa Electric Corporation
- 10.2.3.2 Huawei Investment Holding Co., Ltd.
- 10.2.3.3 Toshiba Corporation
- 10.2.3.4 Holykell Technology Co., Ltd.
- 10.2.1 North America
- 10.3 Niche Players / Disruptors
- 10.3.1 BAE Systems PLC
- 10.3.2 Phoenix Sensors LLC
- 10.3.3 IntelliSense.io
- 10.3.4 Inovonics Corporation
 無線感測器標籤市場 - 全球產業規模、佔有率、趨勢、機會、預測:按類型、應用、地區和競爭格局分類,2021-2031年
 無線感測器市場:按電源、連接方式、類型和應用分類-2026-2032年全球市場預測
 無線感測器市場規模、佔有率、趨勢和預測:按產品類型、技術、最終用途和地區分類,2026-2034 年
 半導體無線感測器物聯網市場:按組件、感測器類型、連接方式、應用、最終用途、國家和地區分類-產業分析、市場規模、市場佔有率及2025年至2032年預測
 無線感測器市場規模、佔有率和成長分析(按類型、應用、最終用戶和地區分類)—2026-2033年產業預測
 無線感測器:市場佔有率分析、行業趨勢和成長預測(2025-2030)中東和非洲無線感測器:市場佔有率分析、行業趨勢、統計和成長預測(2025-2030)亞太地區無線感測器:市場佔有率分析、產業趨勢和成長預測(2025-2030)北美無線感測器:市場佔有率分析、行業趨勢、統計和成長預測(2025-2030)拉丁美洲無線感測器:市場佔有率分析、行業趨勢和成長預測(2025-2030)