


 |
市場調查報告書
商品編碼
1797827
船用引擎監控系統市場機會、成長動力、產業趨勢分析及 2025 - 2034 年預測Marine Engine Monitoring System Market Opportunity, Growth Drivers, Industry Trend Analysis, and Forecast 2025 - 2034 |
||||||
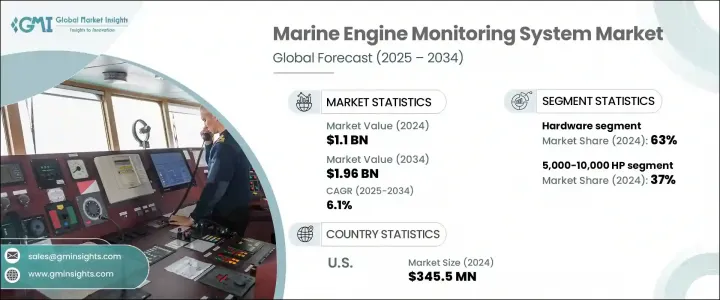
2024 年全球船用引擎監控系統市場價值為 11 億美元,預計到 2034 年將以 6.1% 的複合年成長率成長至 19.6 億美元。隨著排放標準的收緊和船用引擎技術的日益先進,監控系統已從基本的維護工具轉變為最佳化營運的重要平台。這些系統現在依靠即時資料、數位連接和預測能力來提高燃油效率、安全性和法規遵循。物聯網整合、基於人工智慧的分析和智慧感測器網路等技術正在重塑營運商管理船隊績效的方式。該產業也從推動海事數位化的公私合作計畫中獲得發展動力,同時由OEM主導的努力旨在創建針對智慧海事營運的高級培訓生態系統。對數據驅動洞察的需求持續加速整個航運業採用智慧引擎監控工具。
疫情過後,遠端診斷和監控技術的應用速度加快,因為限制措施促使船舶營運商採用基於雲端的工具來維持營運的連續性。預測性和基於狀態的監控功能正在成為大型商用船隊的標配,能夠及早發現燃油效率低下、氣缸過度磨損或潤滑故障等問題。這些系統有助於最大限度地減少停機時間,並符合全球永續發展目標。
| 市場範圍 | |
|---|---|
| 起始年份 | 2024 |
| 預測年份 | 2025-2034 |
| 起始值 | 11億美元 |
| 預測值 | 19.6億美元 |
| 複合年成長率 | 6.1% |
2024年,硬體領域佔據63%的市場佔有率,預計到2034年將以5%的複合年成長率成長。該領域包括控制單元、感測器、資料記錄器和通訊模組等關鍵組件,這些組件有助於實現船上資料的無縫收集和系統整合。新船建造和改裝活動的興起正在推動對硬體安裝的需求,尤其是在遵守排放法規和預測性維護能力變得越來越重要的情況下。西門子、ABB和瓦錫蘭等領先的原始設備製造商正在將先進的感測器技術直接嵌入到推進和輔助系統中,以實現全面的性能監控。
5,000-10,000 匹馬力功率段在 2024 年佔據 37% 的市場佔有率,預計到 2034 年將以 6% 的複合年成長率成長。此功率段內的船舶(通常是中型油輪、近海支援船和貨船)由於營運時間延長和監管要求嚴格,需要可靠的監控。此功率段的監控系統提供詳細的分析、預測洞察和 AI 診斷,支援預防性維護、船隊最佳化以及遵守不斷變化的環境標準。瞄準此功率段的原始設備製造商 (OEM) 正擴大將預測工具整合到其服務產品中。
美國船舶引擎監控系統市場佔83%的市場佔有率,2024年市場規模達3.455億美元。該國的領先地位得益於其龐大的商用和國防艦船隊、排放監管壓力以及數位海事技術的廣泛應用。對邊緣運算、基於人工智慧的引擎診斷和互聯系統的投資正在幫助公共和私人船舶營運商提升績效。獲得政府合約和強大的技術基礎設施使美國的原始設備製造商和整合商能夠透過高階智慧系統滿足國內需求。由於該地區先進的工程能力,MEMS和透過生物燃料電池進行現場監控等技術正在獲得更廣泛的應用。
積極塑造全球船舶引擎監控系統市場的關鍵參與者包括Caterpillar、瓦錫蘭、康明斯、西門子、ABB、康斯伯格海事和曼恩能源解決方案。在船舶引擎監控系統市場競爭的公司專注於擴展數位化能力、開發智慧組件並增強全球服務覆蓋範圍。許多公司正在將人工智慧、物聯網和雲端連接整合到引擎監控解決方案中,以提供進階診斷、自動報告和即時洞察。與航運業者的合作使這些公司能夠共同開發客製化解決方案,從而提高營運效率。一些公司也專注於混合動力推進系統,利用監控工具來最佳化燃油消耗和排放。對培訓平台和售後服務生態系統的投資有助於確保客戶留存。
目錄
第1章:方法論
- 市場範圍和定義
- 研究設計
- 研究方法
- 資料收集方法
- 資料探勘來源
- 全球的
- 地區/國家
- 基礎估算與計算
- 基準年計算
- 市場評估的主要趨勢
- 初步研究和驗證
- 主要來源
- 預測模型
- 研究假設和局限性
第2章:執行摘要
第3章:行業洞察
- 產業生態系統分析
- 供應商格局
- 利潤率分析
- 成本結構
- 每個階段的增值
- 影響價值鏈的因素
- 中斷
- 產業衝擊力
- 成長動力
- 節能船舶營運的需求增加
- 國際海事組織 (IMO) 法規導致合規需求激增
- 遠端診斷和基於物聯網的解決方案的部署增加
- 海上貿易成長與船隊擴張
- 產業陷阱與挑戰
- MEMS系統初始投資成本高
- 缺乏熟練的海事技術人員來部署系統
- 市場機會
- MEMS 在混合動力和電力推進系統中的擴展
- 自主和遠端操作船舶項目激增
- 智慧港口和互聯航道的投資不斷增加
- 造船廠採用數位孿生技術
- 成長動力
- 成長潛力分析
- 監管格局
- 北美洲
- 歐洲
- 亞太地區
- 拉丁美洲
- 中東和非洲
- 波特的分析
- PESTEL分析
- 技術和創新格局
- 當前的技術趨勢
- 新興技術
- 價格趨勢
- 按地區
- 按產品
- 成本細分分析
- 專利分析
- 永續性和環境方面
- 永續實踐
- 減少廢棄物的策略
- 生產中的能源效率
- 環保舉措
- 碳足跡考量
第4章:競爭格局
- 介紹
- 公司市佔率分析
- 北美洲
- 歐洲
- 亞太地區
- 拉丁美洲
- MEA
- 主要市場參與者的競爭分析
- 競爭定位矩陣
- 戰略展望矩陣
- 關鍵進展
- 併購
- 夥伴關係與合作
- 新產品發布
- 擴張計劃和資金
第5章:市場估計與預測:按組件,2021 - 2034 年
- 主要趨勢
- 硬體
- 感應器
- 控制單元
- 展示
- 控制器
- 其他
- 軟體
- 數據分析軟體
- 預測性維護軟體
- 其他
- 服務
第6章:市場估計與預測:按功率,2021 - 2034 年
- 主要趨勢
- 1,000 匹馬力
- 1,000-5,000 馬力
- 5,001-10,000 馬力
- 10,000 生命值及以上
第7章:市場估計與預測:依部署模式,2021 - 2034 年
- 主要趨勢
- 現場監控
- 遠端監控
第8章:市場估計與預測:按推進方式,2021 - 2034 年
- 主要趨勢
- 柴油引擎
- 瓦斯渦輪機
- 其他
第9章:市場估計與預測:按應用,2021 - 2034
- 主要趨勢
- 效能監控
- 燃油效率最佳化
- 維護診斷
- 安全和法規遵從性
第10章:市場估計與預測:依最終用途,2021 - 2034 年
- 商用船舶
- 貨船
- 油輪
- 貨櫃船
- 海軍艦艇
- 客船
- 遊輪
- 渡輪
- 其他
第 11 章:市場估計與預測:按地區,2021 年至 2034 年
- 主要趨勢
- 北美洲
- 美國
- 加拿大
- 歐洲
- 英國
- 法國
- 義大利
- 西班牙
- 俄羅斯
- 北歐人
- 亞太地區
- 中國
- 印度
- 日本
- 澳洲
- 韓國
- 菲律賓
- 越南
- 印尼
- 拉丁美洲
- 巴西
- 墨西哥
- 阿根廷
- MEA
- 南非
- 沙烏地阿拉伯
- 阿拉伯聯合大公國
- 埃及
第12章:公司簡介
- ABB
- AST
- Caterpillar
- CMR
- Cummins
- Emerson Electric
- General Electric
- Hyundai Heavy Industries
- Jason Marine
- Kongsberg Maritime
- MAN Energy Solutions
- Mitsubishi Heavy Industries
- MTU Friedrichshafen
- NORIS
- Rolls-Royce
- Scania
- Siemens
- Volvo Penta
- Wartsila
- Yanmar
The Global Marine Engine Monitoring System Market was valued at USD 1.1 billion in 2024 and is estimated to grow at a CAGR of 6.1% to reach USD 1.96 billion by 2034. As emission standards tighten and marine engine technologies become more advanced, monitoring systems have transitioned from basic maintenance tools to essential platforms for optimizing operations. These systems now rely on real-time data, digital connectivity, and predictive capabilities to deliver enhanced fuel efficiency, safety, and regulatory compliance. Technologies like IoT integration, AI-based analytics, and intelligent sensor networks are reshaping how operators manage fleet performance. The industry is also gaining momentum from public-private initiatives pushing digitalization in maritime, alongside OEM-led efforts to create advanced training ecosystems tailored for smart maritime operations. The demand for data-driven insights continues to accelerate the adoption of intelligent engine monitoring tools across the shipping industry.
Remote diagnostics and monitoring saw faster adoption following the pandemic, as restrictions prompted marine operators to adopt cloud-based tools to maintain operational continuity. Predictive and condition-based monitoring features are becoming standard across larger commercial fleets, enabling early detection of issues such as fuel inefficiency, excessive cylinder wear, or lubrication faults. These systems help minimize downtime and align with global sustainability goals.
| Market Scope | |
|---|---|
| Start Year | 2024 |
| Forecast Year | 2025-2034 |
| Start Value | $1.1 Billion |
| Forecast Value | $1.96 Billion |
| CAGR | 6.1% |
In 2024, the hardware segment held 63% share and is forecasted to grow at a CAGR of 5% through 2034. This segment includes key components such as control units, sensors, data loggers, and communication modules that facilitate seamless data collection and system integration onboard. The rise in new vessel construction and retrofitting activities is boosting demand for hardware installations, especially as compliance with emission regulations and predictive maintenance capabilities becomes more critical. Leading OEMs like Siemens, ABB, and Wartsila are embedding advanced sensor technologies directly into propulsion and auxiliary systems to enable comprehensive performance monitoring.
The 5,000-10,000 HP power range segment held 37% share in 2024 and is projected to grow at a CAGR of 6% through 2034. Vessels within this range-typically medium-sized tankers, offshore support ships, and cargo carriers-require robust monitoring due to extended operational hours and strict regulatory requirements. Monitoring systems for this power range offer detailed analytics, predictive insights, and AI-enabled diagnostics that support preventive maintenance, fleet optimization, and compliance with evolving environmental standards. OEMs targeting this range are increasingly integrating predictive tools into their service offerings.
United States Marine Engine Monitoring System Market held 83% share and earned USD 345.5 million in 2024. The country's leadership position is supported by a sizable fleet of commercial and defense vessels, regulatory pressure on emissions, and widespread use of digital maritime technologies. Investments in edge computing, AI-based engine diagnostics, and connected systems are helping both public and private marine operators streamline performance. Access to government contracts and strong tech infrastructure allows US-based OEMs and integrators to meet domestic demand with high-end, smart systems. Technologies like MEMS and on-site monitoring via biofuel cells are finding broader applications thanks to the advanced engineering capabilities of the region.
Key players actively shaping the Global Marine Engine Monitoring System Market include Caterpillar, Wartsila, Cummins, Siemens, ABB, Kongsberg Maritime, and MAN Energy Solutions. Companies competing in the marine engine monitoring system market are focused on expanding digital capabilities, developing smart components, and enhancing global service reach. Many are integrating AI, IoT, and cloud connectivity into engine monitoring solutions to offer advanced diagnostics, automated reporting, and real-time insights. Partnerships with shipping operators allow these firms to co-develop customized solutions that improve operational efficiency. Some companies are also focusing on hybrid propulsion systems, leveraging monitoring tools to optimize fuel consumption and emissions. Investments in training platforms and aftersales service ecosystems help ensure customer retention.
Table of Contents
Chapter 1 Methodology
- 1.1 Market scope and definition
- 1.2 Research design
- 1.2.1 Research approach
- 1.2.2 Data collection methods
- 1.3 Data mining sources
- 1.3.1 Global
- 1.3.2 Regional/Country
- 1.4 Base estimates and calculations
- 1.4.1 Base year calculation
- 1.4.2 Key trends for market estimation
- 1.5 Primary research and validation
- 1.5.1 Primary sources
- 1.6 Forecast model
- 1.7 Research assumptions and limitations
Chapter 2 Executive Summary
- 2.1 Industry 360° synopsis, 2021 - 2034
- 2.2 Key market trends
- 2.2.1 Regional
- 2.2.2 Component
- 2.2.3 Power
- 2.2.4 Deployment mode
- 2.2.5 Propulsion
- 2.2.6 Application
- 2.2.7 End Use
- 2.3 TAM Analysis, 2025-2034
- 2.4 CXO perspectives: Strategic imperatives
- 2.4.1 Executive decision points
- 2.4.2 Critical success factors
- 2.5 Future outlook and strategic recommendations
Chapter 3 Industry Insights
- 3.1 Industry ecosystem analysis
- 3.1.1 Supplier landscape
- 3.1.2 Profit margin analysis
- 3.1.3 Cost structure
- 3.1.4 Value addition at each stage
- 3.1.5 Factor affecting the value chain
- 3.1.6 Disruptions
- 3.2 Industry impact forces
- 3.2.1 Growth drivers
- 3.2.1.1 Increase in demand for fuel-efficient vessel operations
- 3.2.1.2 Surge in compliance needs due to IMO regulations
- 3.2.1.3 Rise in deployment of remote diagnostics and IoT-based solutions
- 3.2.1.4 Rising maritime trade & vessel fleet expansion
- 3.2.2 Industry pitfalls and challenges
- 3.2.2.1 High initial investment cost for MEMS systems
- 3.2.2.2 Shortage of skilled maritime technicians for system deployment
- 3.2.3 Market opportunities
- 3.2.3.1 Expansion of MEMS in hybrid and electric propulsion systems
- 3.2.3.2 Surge in autonomous and remotely operated vessel projects
- 3.2.3.3 Rising investments in smart ports and connected shipping lanes
- 3.2.3.4 Adoption of digital twin technologies in shipyards
- 3.2.1 Growth drivers
- 3.3 Growth potential analysis
- 3.4 Regulatory landscape
- 3.4.1 North America
- 3.4.2 Europe
- 3.4.3 Asia Pacific
- 3.4.4 Latin America
- 3.4.5 Middle East & Africa
- 3.5 Porter's analysis
- 3.6 PESTEL analysis
- 3.7 Technology and Innovation landscape
- 3.7.1 Current technological trends
- 3.7.2 Emerging technologies
- 3.8 Price trends
- 3.8.1 By region
- 3.8.2 By product
- 3.9 Cost breakdown analysis
- 3.10 Patent analysis
- 3.11 Sustainability and environmental aspects
- 3.11.1 Sustainable practices
- 3.11.2 Waste reduction strategies
- 3.11.3 Energy efficiency in production
- 3.11.4 Eco-friendly Initiatives
- 3.12 Carbon footprint considerations
Chapter 4 Competitive Landscape, 2024
- 4.1 Introduction
- 4.2 Company market share analysis
- 4.2.1 North America
- 4.2.2 Europe
- 4.2.3 Asia Pacific
- 4.2.4 LATAM
- 4.2.5 MEA
- 4.3 Competitive analysis of major market players
- 4.4 Competitive positioning matrix
- 4.5 Strategic outlook matrix
- 4.6 Key developments
- 4.6.1 Mergers & acquisitions
- 4.6.2 Partnerships & collaborations
- 4.6.3 New Product Launches
- 4.6.4 Expansion Plans and funding
Chapter 5 Market Estimates & Forecast, By Component, 2021 - 2034 ($Bn, Units)
- 5.1 Key trends
- 5.2 Hardware
- 5.2.1 Sensors
- 5.2.2 Control units
- 5.2.3 Display
- 5.2.4 Controllers
- 5.2.5 Others
- 5.3 Software
- 5.3.1 Data analytics software
- 5.3.2 Predictive maintenance software
- 5.3.3 Others
- 5.4 Services
Chapter 6 Market Estimates & Forecast, By Power, 2021 - 2034 ($Bn, Units)
- 6.1 Key trends
- 6.2 1,000 HP
- 6.3 1,000-5,000 HP
- 6.4 5,001-10,000 HP
- 6.5 10,000 HP and above
Chapter 7 Market Estimates & Forecast, By Deployment Mode, 2021 - 2034 ($Bn)
- 7.1 Key trends
- 7.2 On-site monitoring
- 7.3 Remote monitoring
Chapter 8 Market Estimates & Forecast, By Propulsion, 2021 - 2034 ($Bn, Units)
- 8.1 Key trends
- 8.2 Diesel
- 8.3 Gas turbines
- 8.4 Others
Chapter 9 Market Estimates & Forecast, By Application, 2021 - 2034 ($Bn)
- 9.1 Key trends
- 9.2 Performance monitoring
- 9.3 Fuel efficiency optimization
- 9.4 Maintenance diagnosis
- 9.5 Safety and regulatory compliance
Chapter 10 Market Estimates & Forecast, By End Use, 2021 - 2034 ($Bn, Units)
- 10.1 Commercial vessels
- 10.1.1 Cargo ships
- 10.1.2 Tankers
- 10.1.3 Container ships
- 10.2 Naval vessels
- 10.3 Passenger vessels
- 10.3.1 Cruise ships
- 10.3.2 Ferries
- 10.4 Others
Chapter 11 Market Estimates & Forecast, By Region, 2021 - 2034 ($Bn, units)
- 11.1 Key trends
- 11.2 North America
- 11.2.1 U.S.
- 11.2.2 Canada
- 11.3 Europe
- 11.3.1 UK
- 11.3.2 France
- 11.3.3 Italy
- 11.3.4 Spain
- 11.3.5 Russia
- 11.3.6 Nordics
- 11.4 Asia Pacific
- 11.4.1 China
- 11.4.2 India
- 11.4.3 Japan
- 11.4.4 Australia
- 11.4.5 South Korea
- 11.4.6 Philippines
- 11.4.7 Vietnam
- 11.4.8 Indonesia
- 11.5 Latin America
- 11.5.1 Brazil
- 11.5.2 Mexico
- 11.5.3 Argentina
- 11.6 MEA
- 11.6.1 South Africa
- 11.6.2 Saudi Arabia
- 11.6.3 UAE
- 11.6.4 Egypt
Chapter 12 Company Profiles
- 12.1 ABB
- 12.2 AST
- 12.3 Caterpillar
- 12.4 CMR
- 12.5 Cummins
- 12.6 Emerson Electric
- 12.7 General Electric
- 12.8 Hyundai Heavy Industries
- 12.9 Jason Marine
- 12.10 Kongsberg Maritime
- 12.11 MAN Energy Solutions
- 12.12 Mitsubishi Heavy Industries
- 12.13 MTU Friedrichshafen
- 12.14 NORIS
- 12.15 Rolls-Royce
- 12.16 Scania
- 12.17 Siemens
- 12.18 Volvo Penta
- 12.19 Wartsila
- 12.20 Yanmar
 船舶引擎監控系統市場:2026-2032年全球市場預測(按引擎類型、組件類型、連接方式、部署模式、功率範圍、安裝模式、應用和最終用戶分類)全球船用磁式轉速表市場(按產品類型、應用、最終用戶產業和銷售管道)預測(2026-2032年)
 船舶引擎監控系統市場 - 全球產業規模、佔有率、趨勢、機會、預測:按類型、引擎推進類型、地區和競爭格局分類,2021-2031年
 船舶引擎監控系統市場規模、佔有率及成長分析(按組件、引擎類型、船舶類型、最終用戶、部署類型和地區分類)-2026-2033年產業預測
 船用引擎監控系統市場(2025-2029)