

 |
市場調查報告書
商品編碼
1797783
風暴追蹤應用市場機會、成長動力、產業趨勢分析及 2025 - 2034 年預測Storm Tracking Apps Market Opportunity, Growth Drivers, Industry Trend Analysis, and Forecast 2025 - 2034 |
||||||
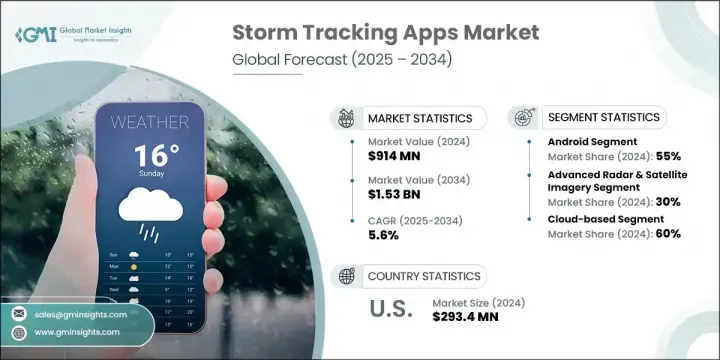
2024 年全球風暴追蹤應用市場價值為 9.14 億美元,預計到 2034 年將以 5.6% 的複合年成長率成長,達到 15.3 億美元。隨著極端天氣事件變得越來越頻繁和嚴重,風暴追蹤應用程式已經從基本的警報系統發展成為風險管理和緊急準備的重要工具。政府和私人孵化器之間的合作正在加速應用程式的創新和採用。提供先進雷達追蹤和分層訂閱模式的高級應用程式引領市場,迎合了需要精確、數據豐富功能的專業人士和氣象愛好者的需求。許多平台提供高保真風暴模型、即時閃電檢測和歷史追蹤資料,並擴大與智慧穿戴設備和家庭自動化系統整合。
人工智慧和機器學習在雷達、衛星和感測器資料處理中的應用,正在徹底改變風暴追蹤,使其能夠實現更快、更精準的天氣預報。這些先進技術即時篩選大量資料,識別人工分析可能遺漏的模式和異常。這不僅提高了預報的準確性,還縮短了發布預警所需的時間,使社區和緊急應變人員能夠更有效地做好準備。因此,用戶可以獲得及時可靠的資訊,從而降低風險,並提高惡劣天氣事件期間的安全性。此外,人工智慧驅動的洞察使應用程式能夠個性化警報和建議,增強參與度,並確保關鍵更新在最需要的時候傳達給合適的用戶。
| 市場範圍 | |
|---|---|
| 起始年份 | 2024 |
| 預測年份 | 2025-2034 |
| 起始值 | 9.14億美元 |
| 預測值 | 15.3億美元 |
| 複合年成長率 | 5.6% |
2024年,Android 市場佔據了 55% 的市場佔有率,預計到 2034 年將以 5% 的複合年成長率成長。 Android 的主導地位得益於其全球廣泛採用、價格實惠以及豐富的硬體選擇。熱門的風暴追蹤應用程式針對 Android 進行了最佳化,具有可自訂的小部件和離線功能。由於用戶群的快速成長,該平台的下載量最高,尤其是在亞太和拉丁美洲等地區。
先進的雷達和衛星影像領域在2024年佔了30%的市場佔有率,預計2025年至2034年的複合年成長率將達到6%。這項技術幾乎是所有頂級風暴追蹤應用程式的基石,提供即時視覺化和高解析度雷達疊加圖。這些功能使用戶能夠在颶風、龍捲風和山洪暴發等重大天氣事件期間做出明智的決策。
2024年,美國風暴追蹤應用市場佔85%的市場佔有率,產值達2.934億美元。強大的氣象監測基礎設施、頻繁的惡劣天氣以及對及時預警的強烈需求,共同支撐著這個市場領先地位。關鍵組織和產業領袖的參與也促進了聯邦、州和地方機構之間的合作。
引領風暴追蹤應用程式市場的領先公司包括 Radarscope LLC、The Weather Company、Severe WX Warn、AccuWeather Inc.、DTN LLC、Apalon LLC、CARROT Weather、ACME AtronOmatic、Weatherbug 和 The Scripps Company。為了在風暴追蹤應用市場站穩腳跟,各公司正大力整合尖端人工智慧和機器學習技術,以提供更準確、更及時的預報。開發具有高級雷達疊加和即時閃電追蹤等獨家功能的高級訂閱模式有助於實現產品差異化。與政府機構和緊急服務機構建立策略夥伴關係,可提升可信度和使用者信任度。擴展跨平台相容性(尤其是 Android 和 iOS 之間的相容性)可擴大其覆蓋範圍,同時改善使用者介面和自訂選項可提高參與度。
目錄
第1章:方法論
- 市場範圍和定義
- 研究設計
- 研究方法
- 資料收集方法
- 資料探勘來源
- 全球的
- 地區/國家
- 基礎估算與計算
- 基準年計算
- 市場評估的主要趨勢
- 初步研究和驗證
- 主要來源
- 預測模型
- 研究假設和局限性
第2章:執行摘要
第3章:行業洞察
- 產業生態系統分析
- 供應商格局
- 利潤率分析
- 成本結構
- 每個階段的增值
- 影響價值鏈的因素
- 中斷
- 產業衝擊力
- 成長動力
- 智慧型手機和行動網際網路的普及
- 極端天氣發生頻率和嚴重程度不斷增加
- 對即時警報和個人化功能的需求
- 提高災害防範意識
- 產業陷阱與挑戰
- 數據準確性和及時性挑戰
- 成本高且市場飽和
- 市場機會
- 透過訂閱模式對高階應用功能的需求不斷成長
- 與機構和氣象部門的合作
- 服務欠缺的熱帶地區的擴張潛力
- 加強與智慧城市和公共基礎設施的整合
- 成長動力
- 監管格局
- 北美洲
- 歐洲
- 亞太地區
- 拉丁美洲
- 中東和非洲
- 波特的分析
- PESTEL分析
- 技術和創新格局
- 當前的技術趨勢
- 新興技術
- 客戶洞察和採用趨勢
- 最終用途細分與偏好
- 使用模式和應用程式功能需求
- 區域採用率和障礙
- 定價策略與貨幣化模型
- 免費增值模式與訂閱模式
- 應用程式內廣告和合作收入
- 企業與消費者定價差異
- 環境和社會影響
- 在氣候變遷意識和減災方面的作用
- 主要參與者的社會責任舉措
- 專利分析
- 用例
- 最佳情況
第4章:競爭格局
- 介紹
- 公司市佔率分析
- 北美洲
- 歐洲
- 亞太地區
- 拉丁美洲
- MEA
- 主要市場參與者的競爭分析
- 競爭定位矩陣
- 戰略展望矩陣
- 關鍵進展
- 併購
- 夥伴關係與合作
- 新產品發布
- 擴張計劃和資金
第5章:市場估計與預測:按作業系統,2021 - 2034 年
- 主要趨勢
- 安卓
- iOS
- 其他
第6章:市場估計與預測:依功能分類,2021 - 2034 年
- 主要趨勢
- 基本風暴警報
- 先進的雷達和衛星圖像
- 即時 GPS 追蹤和風暴路徑預測
- 整合應急通訊工具
- 自訂天氣通知和預報
- 其他
第7章:市場估計與預測:按部署模式,2021 - 2034 年
- 主要趨勢
- 基於雲端
- 本地
- 混合
第8章:市場估計與預測:按解決方案,2021 - 2034 年
- 主要趨勢
- 即時雷達和衛星應用程式
- 風暴預報和預報應用程式
- 多災害預警平台
- 航空和海上風暴監測應用程式
- 穿戴式及智慧型裝置整合
- 其他
第9章:市場估計與預測:依最終用途,2021 - 2034 年
- 主要趨勢
- 普通大眾
- 政府機構
- 農業和耕作
- 航空和航空公司
- 海運和航運
- 物流和供應鏈
- 其他
第10章:市場估計與預測:按地區,2021 - 2034 年
- 主要趨勢
- 北美洲
- 美國
- 加拿大
- 歐洲
- 德國
- 英國
- 法國
- 義大利
- 西班牙
- 俄羅斯
- 亞太地區
- 中國
- 印度
- 日本
- 澳洲
- 韓國
- 菲律賓
- 印尼
- 新加坡
- 拉丁美洲
- 巴西
- 墨西哥
- 阿根廷
- MEA
- 南非
- 沙烏地阿拉伯
- 阿拉伯聯合大公國
- 奈及利亞
第 11 章:公司簡介
- Global Players
- Professional and Specialized Players
- Consumer-Focused Players
- Government and Emergency Management
- Technology and Data Providers
- Emerging and Niche Players
- International Players
The Global Storm Tracking Apps Market was valued at USD 914 million in 2024 and is estimated to grow at a CAGR of 5.6% to reach USD 1.53 billion by 2034. With extreme weather events becoming more frequent and severe, storm tracking apps have evolved from basic alert systems into essential tools for risk management and emergency preparedness. Collaboration between governments and private incubators is accelerating app innovation and adoption. Premium applications offering advanced radar tracking and tiered subscription models lead the market, catering to professionals and weather enthusiasts who demand precise, data-rich features. Many platforms provide high-fidelity storm models, real-time lightning detection, and historical tracking data, and are increasingly integrating with smart wearables and home automation systems.
The application of artificial intelligence and machine learning in processing radar, satellite, and sensor data is revolutionizing storm tracking by enabling faster and more precise weather predictions. These advanced technologies sift through vast amounts of data in real time, identifying patterns and anomalies that human analysis might miss. This not only boosts the accuracy of forecasts but also shortens the time needed to issue warnings, allowing communities and emergency responders to prepare more effectively. As a result, users benefit from timely, reliable information that helps reduce risks and improve safety during severe weather events. Furthermore, AI-driven insights allow apps to personalize alerts and recommendations, enhancing engagement and ensuring that critical updates reach the right people when they need them most.
| Market Scope | |
|---|---|
| Start Year | 2024 |
| Forecast Year | 2025-2034 |
| Start Value | $914 Million |
| Forecast Value | $1.53 Billion |
| CAGR | 5.6% |
The Android segment accounted for a 55% share in 2024 and is expected to grow at a CAGR of 5% through 2034. Android's dominance is fueled by its widespread global adoption, affordability, and extensive hardware variety. Popular storm tracking applications are optimized for Android, featuring customizable widgets and offline capabilities. The platform sees the highest download volumes, particularly in regions like Asia-Pacific and Latin America, driven by a rapidly expanding user base.
The advanced radar and satellite imagery segment held a 30% share in 2024 and is projected to grow at a CAGR of 6% from 2025 to 2034. This technology is the cornerstone of nearly all top storm tracking apps, offering real-time visualization and high-resolution radar overlays. Features like these empower users to make informed decisions during critical weather events such as hurricanes, tornadoes, and flash floods.
United States Storm Tracking Apps Market held an 85% share in 2024, generating USD 293.4 million. This leadership position is supported by robust weather monitoring infrastructure, frequent severe weather occurrences, and a strong demand for timely alerts. The presence of key organizations and industry leaders also promotes collaboration across federal, state, and local agencies.
Leading companies shaping the Storm Tracking Apps Market include Radarscope LLC, The Weather Company, Severe WX Warn, AccuWeather Inc., DTN LLC, Apalon LLC, CARROT Weather, ACME AtronOmatic, Weatherbug, and The Scripps Company. To build a stronger foothold in the Storm Tracking Apps Market, companies are focusing heavily on integrating cutting-edge AI and machine learning technologies to deliver more accurate and timely forecasts. Developing premium, subscription-based models with exclusive features like advanced radar overlays and real-time lightning tracking helps differentiate offerings. Strategic partnerships with government agencies and emergency services enhance credibility and user trust. Expanding cross-platform compatibility, especially between Android and iOS, broadens their reach, while improving user interface and customization options boosts engagement.
Table of Contents
Chapter 1 Methodology
- 1.1 Market scope and definition
- 1.2 Research design
- 1.2.1 Research approach
- 1.2.2 Data collection methods
- 1.3 Data mining sources
- 1.3.1 Global
- 1.3.2 Regional/Country
- 1.4 Base estimates and calculations
- 1.4.1 Base year calculation
- 1.4.2 Key trends for market estimation
- 1.5 Primary research and validation
- 1.5.1 Primary sources
- 1.6 Forecast model
- 1.7 Research assumptions and limitations
Chapter 2 Executive Summary
- 2.1 Industry 3600 synopsis, 2021 - 2034
- 2.2 Key market trends
- 2.2.1 Regional
- 2.2.2 Operating system
- 2.2.3 Functionality
- 2.2.4 Deployment mode
- 2.2.5 Solution
- 2.2.6 End Use
- 2.3 TAM Analysis, 2025-2034
- 2.4 CXO perspectives: Strategic imperatives
- 2.4.1 Executive decision points
- 2.4.2 Critical success factors
- 2.5 Future outlook and strategic recommendations
Chapter 3 Industry Insights
- 3.1 Industry ecosystem analysis
- 3.1.1 Supplier landscape
- 3.1.2 Profit margin analysis
- 3.1.3 Cost structure
- 3.1.4 Value addition at each stage
- 3.1.5 Factor affecting the value chain
- 3.1.6 Disruptions
- 3.2 Industry impact forces
- 3.2.1 Growth drivers
- 3.2.1.1 Smartphone & mobile internet proliferation
- 3.2.1.2 Growing frequency & severity of extreme weather
- 3.2.1.3 Demand for real-time alerts & personalized features
- 3.2.1.4 Rising awareness of disaster preparedness
- 3.2.2 Industry pitfalls and challenges
- 3.2.2.1 Data accuracy & timeliness challenges
- 3.2.2.2 High cost & market saturation
- 3.2.3 Market opportunities
- 3.2.3.1 Rising demand for premium app features via subscription models
- 3.2.3.2 Partnerships with agencies & meteorological services
- 3.2.3.3 Expansion potential in underserved tropical regions
- 3.2.3.4 Increase in integration with smart cities and public infrastructure
- 3.2.1 Growth drivers
- 3.3 Regulatory landscape
- 3.3.1 North America
- 3.3.2 Europe
- 3.3.3 Asia Pacific
- 3.3.4 Latin America
- 3.3.5 Middle East & Africa
- 3.4 Porter's analysis
- 3.5 PESTEL analysis
- 3.6 Technology and Innovation landscape
- 3.6.1 Current technological trends
- 3.6.2 Emerging technologies
- 3.7 Customer insights & adoption trends
- 3.7.1 End use segmentation and preferences
- 3.7.2 Usage patterns and app feature demand
- 3.7.3 Regional adoption rates and barriers
- 3.8 Pricing strategies & monetization models
- 3.8.1 Freemium vs. subscription models
- 3.8.2 In-app advertising and partnership revenues
- 3.8.3 Enterprise vs. consumer pricing differentiation
- 3.9 Environmental and social impact
- 3.9.1 Role in climate change awareness and disaster mitigation
- 3.9.2 Social responsibility initiatives by key players
- 3.10 Patent analysis
- 3.11 Use cases
- 3.12 Best-case scenario
Chapter 4 Competitive Landscape, 2024
- 4.1 Introduction
- 4.2 Company market share analysis
- 4.2.1 North America
- 4.2.2 Europe
- 4.2.3 Asia Pacific
- 4.2.4 LATAM
- 4.2.5 MEA
- 4.3 Competitive analysis of major market players
- 4.4 Competitive positioning matrix
- 4.5 Strategic outlook matrix
- 4.6 Key developments
- 4.6.1 Mergers & acquisitions
- 4.6.2 Partnerships & collaborations
- 4.6.3 New Product Launches
- 4.6.4 Expansion Plans and funding
Chapter 5 Market Estimates & Forecast, By Operating System, 2021 - 2034 ($Bn)
- 5.1 Key trends
- 5.2 Android
- 5.3 IOS
- 5.4 Others
Chapter 6 Market Estimates & Forecast, By Functionality, 2021 - 2034 ($Bn)
- 6.1 Key trends
- 6.2 Basic storm alerts
- 6.3 Advanced radar and satellite imagery
- 6.4 Real-time GPS tracking and storm path prediction
- 6.5 Integrated emergency communication tools
- 6.6 Custom weather notifications and forecasting
- 6.7 Others
Chapter 7 Market Estimates & Forecast, By Deployment Mode, 2021 - 2034 ($Bn)
- 7.1 Key trends
- 7.2 Cloud-based
- 7.3 On-premises
- 7.4 Hybrid
Chapter 8 Market Estimates & Forecast, By Solution, 2021 - 2034 ($Bn)
- 8.1 Key trends
- 8.2 Real-time radar and satellite apps
- 8.3 Storm prediction and forecasting apps
- 8.4 Multi-hazard alerting platforms
- 8.5 Aviation and maritime storm monitoring apps
- 8.6 Wearable and smart device integration
- 8.7 Others
Chapter 9 Market Estimates & Forecast, By End Use, 2021 - 2034 ($Bn)
- 9.1 Key trends
- 9.2 General public
- 9.3 Government agencies
- 9.4 Agriculture and farming
- 9.5 Aviation and airlines
- 9.6 Maritime and shipping
- 9.7 Logistics and supply chain
- 9.8 Others
Chapter 10 Market Estimates & Forecast, By Region, 2021 - 2034 ($Bn)
- 10.1 Key trends
- 10.2 North America
- 10.2.1 US
- 10.2.2 Canada
- 10.3 Europe
- 10.3.1 Germany
- 10.3.2 UK
- 10.3.3 France
- 10.3.4 Italy
- 10.3.5 Spain
- 10.3.6 Russia
- 10.4 Asia Pacific
- 10.4.1 China
- 10.4.2 India
- 10.4.3 Japan
- 10.4.4 Australia
- 10.4.5 South Korea
- 10.4.6 Philippines
- 10.4.7 Indonesia
- 10.4.8 Singapore
- 10.5 Latin America
- 10.5.1 Brazil
- 10.5.2 Mexico
- 10.5.3 Argentina
- 10.6 MEA
- 10.6.1 South Africa
- 10.6.2 Saudi Arabia
- 10.6.3 UAE
- 10.6.4 Nigeria
Chapter 11 Company Profiles
- 11.1 Global Players
- 11.1.1 AccuWeather.lNC
- 11.1.2 ACME AtronOmatic
- 11.1.3 Apalon LLC
- 11.1.4 CARROT Weather
- 11.1.5 DTN LLC
- 11.1.6 Severe WX Warn
- 11.1.7 The Scripps Company
- 11.1.8 The weather company
- 11.1.9 Weatherbug
- 11.1.10 SpotWX
- 11.1.11 SteamSpy
- 11.1.12 Tomorrow.io
- 11.1.13 Tropical Tidbits
- 11.1.14 Ventusky
- 11.2 Professional and Specialized Players
- 11.2.1 RadarScope
- 11.2.2 RadarOmega
- 11.2.3 Storm Shield
- 11.3 Consumer-Focused Players
- 11.3.1 Clime Weather Service
- 11.3.2 Windy.app
- 11.3.3 RainViewer
- 11.4 Government and Emergency Management
- 11.4.1 FEMA (Federal Emergency Management Agency)
- 11.4.2 State Emergency Management Agencies
- 11.5 Technology and Data Providers
- 11.5.1 Tomorrow.io
- 11.5.2 National Weather Service (NWS)
- 11.6 Emerging and Niche Players
- 11.6.1 WeatherBug
- 11.6.2 MyRadar
- 11.6.3 Dark Sky (Apple)
- 11.6.4 Weatherology
- 11.7 International Players
- 11.7.1 MeteoGroup (DTN)
- 11.7.2 Foreca
 貨物追蹤平台市場機會、成長要素、產業趨勢分析及2026-2035年預測。
 基於半導體的動物追蹤設備市場分析及預測至 2035 年:按類型、產品、服務、技術、組件、應用、最終用戶、功能和安裝類型分類。
 使用者追蹤軟體市場按解決方案類型、部署模式、組織規模和行業分類 - 全球預測,2026-2032 年
 按產品類型、技術、應用、部署類型、最終用戶和地區分類的入住率追蹤市場規模、佔有率和成長分析 - 2026-2033 年產業預測
 全球工具追蹤軟體市場:按組件、公司規模、部署方式、作業系統、應用、產業和地區劃分 - 市場預測與分析 (2025-2033)
 全球交通監控市場全球即時包裹追蹤市場
 交通監控市場:按組件、按運輸方式、按應用、按最終用戶、按地區