

 |
市場調查報告書
商品編碼
1797770
電子設備維修服務市場機會、成長動力、產業趨勢分析及 2025 - 2034 年預測Electronic Equipment Repair Services Market Opportunity, Growth Drivers, Industry Trend Analysis, and Forecast 2025 - 2034 |
||||||
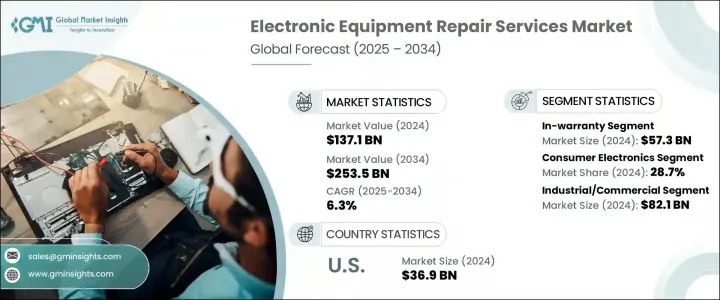
2024 年全球電子設備維修服務市場規模達 1,371 億美元,預計到 2034 年將以 6.3% 的複合年成長率成長,達到 2,535 億美元。推動這一市場成長的主要因素包括:對永續性和電子垃圾的擔憂、新電子產品成本的上漲,以及工業和醫療設備使用的日益成長。由於電子垃圾中含有有害物質且回收系統效率低下,其環境問題日益嚴重,維修服務已成為關鍵的解決方案。此外,隨著設備更換成本的不斷上升,消費者和企業都在尋求維修服務,將其作為購買新產品的經濟實惠的替代方案。智慧型手機、筆記型電腦和工業電子產品等高階設備通常價格不菲,因此維修成為延長這些產品使用壽命的更可行、更經濟的選擇。
隨著消費性電子產品的普及以及工業和醫療設備應用的不斷擴大,維修服務的需求也不斷成長。消費者也越來越關注環境永續性,這導致他們更傾向於維修而非更換。在這種不斷變化的環境下,企業正在透過提供可靠、實惠且高效的維修服務來適應客戶需求,以維護客戶群並實現永續發展目標。
| 市場範圍 | |
|---|---|
| 起始年份 | 2024 |
| 預測年份 | 2025-2034 |
| 起始值 | 1371億美元 |
| 預測值 | 2535億美元 |
| 複合年成長率 | 6.3% |
就服務類型而言,市場分為保固期內和保固期外服務。保固期內服務市場規模在2024年達到573億美元,受益於製造商支援的維修服務,這些維修服務需求可預測,並降低了消費者的自付費用。製造商通常提供12至24個月的保固期,以涵蓋材料和工藝缺陷,這鞏固了原始設備製造商(OEM)在該領域的主導地位。為了滿足日益成長的保固期內服務需求,維修服務提供者必須專注於獲得經批准的服務協議,並利用技術驅動的診斷技術來最大限度地縮短維修時間並改善服務交付。
2024年,消費性電子產品領域佔了28.7%的市場。智慧型手機、筆記型電腦和其他個人設備的快速成長推動了維修服務的需求。隨著消費者越來越注重性價比,維修服務正成為越來越受歡迎的設備更換替代方案,尤其是在電子產品市場快速發展的背景下。
2024年,美國電子設備維修服務市場產值達369億美元,得益於強大的工業基礎設施和高消費性電子產品普及率。美國消費者行為正在發生變化,根據美國消費者技術協會的數據,超過45%的美國消費者選擇維修而非更換。隨著消費者面臨設備價格上漲以及環保意識增強,預計這一趨勢將持續下去。旨在搶占美國市場佔有率的服務供應商需要專注於擴展其授權服務中心網路、提升診斷能力並支持環保實踐。
全球電子設備維修服務市場的領導者包括羅克韋爾自動化公司、荷蘭皇家飛利浦公司、柯蒂斯-萊特公司、Encompass供應鏈解決方案公司和福斯公共有限公司等公司。為了鞏固其在電子設備維修服務市場的地位,領先企業正致力於擴展服務網路並增強服務產品。一項關鍵策略是深化與原始設備製造商的合作夥伴關係,以確保獲得授權維修服務和認證,這對於保固期內的維修至關重要。此外,企業正在投資先進的診斷工具和技術,以簡化維修流程並最大限度地減少停機時間,從而確保更快地為客戶提供週轉服務。企業也專注於永續發展,採用環保做法,例如使用環保材料和減少電子垃圾。另一項重要策略是開發數位平台,使客戶能夠輕鬆獲得維修服務,從而進一步提高便利性和客戶滿意度。最後,服務提供者希望透過提供基於客戶特定需求的客製化服務來脫穎而出,尤其是在個人化維修解決方案需求日益成長的背景下。
目錄
第1章:方法論與範圍
第2章:執行摘要
第3章:行業洞察
- 產業生態系統分析
- 供應商格局
- 利潤率
- 成本結構
- 每個階段的增值
- 影響價值鏈的因素
- 中斷
- 衝擊力
- 成長動力
- 新電子產品成本上漲
- 永續性和電子垃圾問題
- 消費性電子產品的擴張
- 增加工業和醫療設備的使用
- 第三方維修供應商的成長
- 產業陷阱與挑戰
- 技術快速淘汰
- 對OEM零件和工具的存取受限
- 成長動力
- 成長潛力分析
- 監管格局
- 北美洲
- 歐洲
- 亞太地區
- 拉丁美洲
- 中東和非洲
- 波特的分析
- PESTEL分析
- 技術和創新格局
- 當前的技術趨勢
- 新興技術
- 新興商業模式
- 合規性要求
- 消費者情緒分析
- 專利和智慧財產權分析
- 地緣政治與貿易動態
第4章:競爭格局
- 介紹
- 公司市佔率分析
- 按地區
- 市場集中度分析
- 關鍵參與者的競爭基準
- 財務績效比較
- 收入
- 利潤率
- 研發
- 產品組合比較
- 產品範圍廣度
- 科技
- 創新
- 地理位置比較
- 全球足跡分析
- 服務網路覆蓋
- 各地區市場滲透率
- 競爭定位矩陣
- 領導者
- 挑戰者
- 追蹤者
- 利基市場參與者
- 戰略展望矩陣
- 財務績效比較
- 2021-2024 年關鍵發展
- 併購
- 夥伴關係和合作
- 技術進步
- 擴張和投資策略
- 數位轉型舉措
- 新興/新創企業競爭對手格局
第5章:市場估計與預測:依服務類型,2021-2034 年
- 主要趨勢
- 保固期內
- 超出保固期
第6章:市場估計與預測:依產品類型,2021-2034
- 主要趨勢
- 消費性電子產品
- 智慧型手機和行動電話
- 電視機
- 筆記型電腦
- 平板電腦
- 其他
- 家用電器
- 冰箱
- 空調
- 微波爐
- 洗衣機
- 其他
- 醫療設備
- 醫療監視器
- 實驗室設備
- 牙醫診所設備
- 呼吸器
- CT掃描儀
- 其他
- 工業設備
- 電動機和發電機
- 電壓表
- 可程式邏輯控制器(PLC)
- 雷射設備
- 其他
- 其他
第7章:市場估計與預測:依銷售管道,2021-2034 年
- 主要趨勢
- 授權服務中心
- 第三方維修店
- 其他
第8章:市場估計與預測:依最終用途,2021-2034
- 主要趨勢
- 工業/商業
- 住宅
第9章:市場估計與預測:按地區,2021-2034
- 主要趨勢
- 北美洲
- 美國
- 加拿大
- 歐洲
- 英國
- 德國
- 法國
- 義大利
- 西班牙
- 荷蘭
- 亞太地區
- 中國
- 印度
- 日本
- 韓國
- 澳洲
- 拉丁美洲
- 巴西
- 墨西哥
- 阿根廷
- MEA
- 南非
- 沙烏地阿拉伯
- 阿拉伯聯合大公國
第10章:公司簡介
- Global Key Players
- Regional Key Players
- 顛覆者/利基市場參與者
- iCracked公司
- 福斯電子
The Global Electronic Equipment Repair Services Market was valued at USD 137.1 billion in 2024 and is estimated to grow at a CAGR of 6.3% to reach USD 253.5 billion by 2034. This market growth is driven by concerns surrounding sustainability and e-waste, rising costs of new electronics, and the growing use of industrial and medical devices. With electronic waste becoming an increasing environmental concern due to the harmful substances it contains and the inefficiency of recycling systems, repair services have become a critical solution. Additionally, as the cost of replacing devices continues to rise, consumers and businesses alike are seeking repair services as a cost-effective alternative to purchasing new products. High-end devices like smartphones, laptops, and industrial electronics often come with a hefty price tag, making repairs a more viable and economical option for extending the life of these products.
The demand for repair services is growing in line with the increasing penetration of consumer electronics and the expanding use of industrial and medical devices. Consumers are also becoming more focused on environmental sustainability, contributing to the preference for repairs instead of replacements. In this changing landscape, businesses are adapting to customer needs by offering reliable, affordable, and efficient repair services to maintain their customer base and meet sustainability goals.
| Market Scope | |
|---|---|
| Start Year | 2024 |
| Forecast Year | 2025-2034 |
| Start Value | $137.1 Billion |
| Forecast Value | $253.5 Billion |
| CAGR | 6.3% |
In terms of service types, the market is divided into in-warranty and out-of-warranty services. The in-warranty segment, which was valued at USD 57.3 billion in 2024, benefits from manufacturer-backed repairs that offer predictable demand and lower out-of-pocket costs for consumers. Manufacturers typically offer warranties of 12 to 24 months to cover defects in materials and workmanship, which supports the dominance of original equipment manufacturers (OEMs) in this segment. To tap into the growing demand for in-warranty services, repair providers must focus on obtaining approved service agreements and leveraging technology-driven diagnostics to minimize repair times and improve service delivery.
The consumer electronics segment accounted for a 28.7% share in 2024. The rapid growth in the use of smartphones, laptops, and other personal devices is driving the demand for repair services. As consumers become more focused on cost-effective options, repair services are becoming an increasingly popular alternative to device replacement, especially given the rapidly evolving nature of the electronics market.
U.S. Electronic Equipment Repair Services Market generated USD 36.9 billion in 2024, benefiting from a strong industrial infrastructure and high consumer electronics penetration. Consumer behavior in the U.S. is shifting, with more than 45% of U.S. consumers opting for repairs rather than replacements, according to the Consumer Technology Association. This trend is expected to continue as consumers face rising device prices and become more environmentally conscious. Service providers aiming to capture market share in the U.S. need to focus on expanding their authorized service center networks, improving diagnostic capabilities, and supporting environmentally friendly practices.
The top players in the Global Electronic Equipment Repair Services Market include companies like Rockwell Automation Inc., Koninklijke Philips N.V., Curtiss-Wright Corporation, Encompass Supply Chain Solutions, and Forth Corporation Public Company Limited. To strengthen their position in the electronic equipment repair services market, leading companies are focusing on expanding their service networks and enhancing their service offerings. A key strategy involves deepening partnerships with OEMs to ensure authorized repair services and certifications, which are essential for warranty-backed repairs. Additionally, businesses are investing in advanced diagnostic tools and technologies to streamline repair processes and minimize downtime, ensuring a faster turnaround for customers. Companies are also focusing on sustainability by incorporating environmentally friendly practices such as using eco-friendly materials and reducing e-waste. Another important strategy is the development of digital platforms that enable easy customer access to repair services, further enhancing convenience and customer satisfaction. Lastly, service providers are looking to differentiate themselves by offering customized services, based on the specific needs of the customers, especially as the demand for personalized repair solutions increases.
Table of Contents
Chapter 1 Methodology & Scope
- 1.1 Market scope and definition
- 1.2 Research design
- 1.2.1 Research approach
- 1.2.2 Data collection methods
- 1.3 Data mining sources
- 1.3.1 Global
- 1.3.2 Regional/Country
- 1.4 Base estimates and calculations
- 1.4.1 Base year calculation
- 1.4.2 Key trends for market estimation
- 1.5 Primary research and validation
- 1.5.1 Primary sources
- 1.6 Forecast model
- 1.7 Research assumptions and limitations
Chapter 2 Executive Summary
- 2.1 Industry 360° synopsis
- 2.2 Key market trends
- 2.2.1 Product type trends
- 2.2.2 Service type trends
- 2.2.3 Product type trends
- 2.2.4 Sales channel trends
- 2.2.5 End use trends
- 2.2.6 Regional trends
- 2.3 TAM Analysis, 2025-2034 (USD Billion)
- 2.4 CXO perspectives: Strategic imperatives
- 2.4.1 Executive decision points
- 2.4.2 Critical success factors
- 2.5 Future Outlook and strategic recommendations
Chapter 3 Industry Insights
- 3.1 Industry ecosystem analysis
- 3.1.1 Supplier landscape
- 3.1.2 Profit margin
- 3.1.3 Cost structure
- 3.1.4 Value addition at each stage
- 3.1.5 Factor affecting the value chain
- 3.1.6 Disruptions
- 3.2 Impact forces
- 3.2.1 Growth drivers
- 3.2.1.1 Rising cost of new electronics
- 3.2.1.2 Sustainability and e-waste concerns
- 3.2.1.3 Expansion of consumer electronics
- 3.2.1.4 Increasing industrial and medical device usage
- 3.2.1.5 Growth of third-party repair providers
- 3.2.2 Industry pitfalls & challenges
- 3.2.2.1 Rapid technological obsolescence
- 3.2.2.2 Limited access to OEM parts and tools
- 3.2.1 Growth drivers
- 3.3 Growth potential analysis
- 3.4 Regulatory landscape
- 3.4.1 North America
- 3.4.2 Europe
- 3.4.3 Asia Pacific
- 3.4.4 Latin America
- 3.4.5 Middle East & Africa
- 3.5 Porter's analysis
- 3.6 PESTEL analysis
- 3.7 Technology and innovation landscape
- 3.7.1 Current technological trends
- 3.7.2 Emerging technologies
- 3.8 Emerging business models
- 3.9 Compliance requirements
- 3.10 Consumer sentiment analysis
- 3.11 Patent and IP analysis
- 3.12 Geopolitical and trade dynamics
Chapter 4 Competitive Landscape, 2024
- 4.1 Introduction
- 4.2 Company market share analysis
- 4.2.1 By region
- 4.2.1.1 North America
- 4.2.1.2 Europe
- 4.2.1.3 Asia Pacific
- 4.2.1.4 Latin America
- 4.2.1.5 MEA
- 4.2.2 Market concentration analysis
- 4.2.1 By region
- 4.3 Competitive benchmarking of key players
- 4.3.1 Financial performance comparison
- 4.3.1.1 Revenue
- 4.3.1.2 Profit margin
- 4.3.1.3 R&D
- 4.3.2 Product portfolio comparison
- 4.3.2.1 Product range breadth
- 4.3.2.2 Technology
- 4.3.2.3 Innovation
- 4.3.3 Geographic presence comparison
- 4.3.3.1 Global footprint analysis
- 4.3.3.2 Service network coverage
- 4.3.3.3 Market penetration by region
- 4.3.4 Competitive positioning matrix
- 4.3.4.1 Leaders
- 4.3.4.2 Challengers
- 4.3.4.3 Followers
- 4.3.4.4 Niche players
- 4.3.5 Strategic outlook matrix
- 4.3.1 Financial performance comparison
- 4.4 Key developments, 2021-2024
- 4.4.1 Mergers and acquisitions
- 4.4.2 Partnerships and collaborations
- 4.4.3 Technological advancements
- 4.4.4 Expansion and investment strategies
- 4.4.5 Digital Transformation Initiatives
- 4.5 Emerging/ Startup Competitors Landscape
Chapter 5 Market Estimates & Forecast, By Service Type, 2021-2034 (USD Million)
- 5.1 Key trends
- 5.2 In-warranty
- 5.3 Out-of-warranty
Chapter 6 Market Estimates & Forecast, By Product Type, 2021-2034 (USD Million)
- 6.1 Key trends
- 6.2 Consumer electronics
- 6.2.1 Smartphones & mobile phones
- 6.2.2 Televisions
- 6.2.3 Notebooks & laptops
- 6.2.4 Tablets
- 6.2.5 Others
- 6.3 Home Appliances
- 6.3.1 Refrigerators
- 6.3.2 Air conditioners
- 6.3.3 Microwaves
- 6.3.4 Washing machines
- 6.3.5 Others
- 6.4 Medical equipment
- 6.4.1 Medical monitors
- 6.4.2 Lab equipment
- 6.4.3 Dental clinic equipment
- 6.4.4 Ventilators
- 6.4.5 CT scanners
- 6.4.6 Others
- 6.5 Industrial equipment
- 6.5.1 Motors & generators
- 6.5.2 Voltmeters
- 6.5.3 Programmable Logic Controllers (PLC)
- 6.5.4 Laser equipment
- 6.5.5 Others
- 6.6 Others
Chapter 7 Market Estimates & Forecast, By Sales Channel, 2021-2034 (USD Million)
- 7.1 Key trends
- 7.2 Authorized service centers
- 7.3 Third-party repair shops
- 7.4 Others
Chapter 8 Market Estimates & Forecast, By End Use, 2021-2034 (USD Million)
- 8.1 Key trends
- 8.2 Industrial/Commercial
- 8.3 Residential
Chapter 9 Market Estimates & Forecast, By Region, 2021-2034 (USD Million)
- 9.1 Key trends
- 9.2 North America
- 9.2.1 U.S.
- 9.2.2 Canada
- 9.3 Europe
- 9.3.1 UK
- 9.3.2 Germany
- 9.3.3 France
- 9.3.4 Italy
- 9.3.5 Spain
- 9.3.6 Netherlands
- 9.4 Asia Pacific
- 9.4.1 China
- 9.4.2 India
- 9.4.3 Japan
- 9.4.4 South Korea
- 9.4.5 Australia
- 9.5 Latin America
- 9.5.1 Brazil
- 9.5.2 Mexico
- 9.5.3 Argentina
- 9.6 MEA
- 9.6.1 South Africa
- 9.6.2 Saudi Arabia
- 9.6.3 UAE
Chapter 10 Company Profiles
- 10.1 Global Key Players
- 10.1.1 Koninklijke Philips N.V.
- 10.1.2 Rockwell Automation Inc.
- 10.1.3 Curtiss-Wright Corporation
- 10.1.4 Bose Corporation
- 10.1.5 Quest International, Inc.
- 10.2 Regional Key Players
- 10.2.1 North America
- 10.2.1.1 PSI Repair Services, Inc.
- 10.2.1.2 Altra Service Professionals
- 10.2.1.3 Encompass Supply Chain Solutions
- 10.2.1.4 ASAP electronic repairs
- 10.2.2 Europe
- 10.2.2.1 AML Instruments Limited
- 10.2.2.2 Greasley Electronics LTD
- 10.2.2.3 IER Industrial Electronic Repairs LTD
- 10.2.2.4 Multicare Electronics Ltd.
- 10.2.2.5 Real Electronics 2 Ltd.
- 10.2.2.6 Repair World Direct
- 10.2.2.7 Screamer Electronic Services
- 10.2.2.8 JTD Electronics Ltd
- 10.2.3 Asia Pacific
- 10.2.3.1 Urtronics India
- 10.2.3.2 INDufit MACHINEs
- 10.2.1 North America
- 10.3 Disruptors / Niche Players
- 10.3.1 iCracked, Inc.
- 10.3.2 Forth Electronics
 電子產品維護與維修市場:依服務類型、設備類型、頻率、服務形式與產業分類-2026-2032年全球市場預測
 電子產品維修服務市場規模、佔有率和成長分析:按設備類型、服務類型、最終用戶、分銷管道和地區分類-2026-2033年產業預測電子維修服務市場:2026-2032年全球市場預測(依設備類型、維修類型、服務類型、服務提供者類型、服務地點、維修等級及最終用戶分類)
 2026年全球電子產品維修服務市場報告
 全球微型移動出行維修市場:2032 年預測 - 按車輛類型、零件、服務、所有權模式、最終用戶和地區進行分析
 全球電子產品維修服務市場:成長、展望與競爭分析(2025-2033)