


 |
市場調查報告書
商品編碼
1797732
LCR 電錶市場機會、成長動力、產業趨勢分析及 2025 - 2034 年預測LCR Meters Market Opportunity, Growth Drivers, Industry Trend Analysis, and Forecast 2025 - 2034 |
||||||
2024年,全球LCR測量儀市場規模達15.2億美元,預計2034年將以3.3%的複合年成長率成長,達到21億美元。高效能電子系統的日益普及以及消費性電子產品和物聯網設備的日益普及,推動了這一穩定成長。隨著各行各業持續專注於開發緊湊型高性能電子產品,對先進LCR測量工具的需求也隨之激增。 LCR測量儀的整合對於測試組件的精度、可靠性和長期穩定性至關重要。
材料和電路設計的創新使這些儀器能夠提供更高的精度、更好的熱穩定性和更低的能耗。此外,能源效率、環保合規性以及向符合RoHS標準和無鉛元件的轉變等全球趨勢,正在強化LCR測試在多個行業中的重要性。
| 市場範圍 | |
|---|---|
| 起始年份 | 2024 |
| 預測年份 | 2025-2034 |
| 起始值 | 15.2億美元 |
| 預測值 | 21億美元 |
| 複合年成長率 | 3.3% |
隨著智慧製造、電商物流和汽車電子的發展,製造商越來越依賴先進的 LCR 解決方案,在日益小型化的設計和節能配置中進行品質控制、系統驗證和元件匹配。生產環境向自動化、互聯互通和即時資料監控的轉變,需要能夠無縫整合到數位品質保證工作流程中的高精度測試設備。 LCR 表在確保電感器、電容器和電阻器等被動元件的可靠性方面發揮著至關重要的作用,尤其是在這些元件尺寸越來越小且用於更複雜的電路架構的情況下。
桌上型 LCR 表市場在 2024 年的營收為 6.688 億美元。桌上型 LCR 表以其卓越的精度和先進的阻抗分析能力而聞名,是電信、汽車和半導體等各行各業實驗室和測試設施的關鍵組件。這些設備提供更寬的頻率範圍並保持嚴格的測量公差,非常適合在各種測試條件下驗證性能。與攜帶式 LCR 表相比,桌上型 LCR 表提供更深入的分析、更高的資料解析度和更快的測試週期,幫助專業人員確保高度複雜的系統和組件的品質。
2024年,電容測試領域在LCR表市場中佔據重要地位,達到4.291億美元。電容測量仍然是電子測試中至關重要的功能,因為它直接影響電路的設計和可靠性。隨著複雜電容器在電信、消費性電子和汽車應用等微型設備中的應用日益廣泛,對能夠分析多層陶瓷電容器 (MLCC) 的精密儀器的需求激增。製造商依靠高精度LCR表在早期設計或最終生產階段識別偏差並預防組件的潛在故障。此測試可確保穩定的電氣行為,有助於滿足各行業的性能和監管基準。
2024年,美國LCR電錶市場規模達3.0066億美元,這得益於其強大的技術基礎設施以及在航太、汽車和電子等領域的領先地位。半導體生產、電動車研發和5G網路擴展對先進測試儀器的日益依賴,進一步增強了對高頻、自動化和高精度LCR電錶的需求。美國也受惠於大量的研發投入,這些投入正在推動下一代LCR工具在產品創新、系統整合和品質控制工作流程中的應用。隨著電子設計標準日益嚴格,市場正轉向更智慧、整合軟體的LCR電錶,這些電錶已針對高級材料測試和設備校準進行了最佳化。
LCR 表產業的競爭格局包括眾多參與者,例如 IET Labs, Inc.、Keysight Technologies、Hioki EE Corporation、GW Instek、Chroma ATE Inc.、Yokogawa Electric Corporation、B&K Precision Corporation、Extech Instruments、Fluke Corporation、Agilent Technologies、Newton4th Ltd (Nui YL)、Kikusui Electron. Co., Ltd.、Aplab Limited、Applent Instruments Inc.、Victor Instruments、Scientific Mes-Technik Pvt. Ltd. 與 Tonghui Electronics Co., Ltd.。
為了擴大影響力並強化市場定位,LCR 表產業的主要公司正專注於創新、策略合作夥伴關係和以客戶為中心的開發。許多公司正在投資研發,以推出具有自動化測試功能和增強資料分析功能的緊湊型多功能儀表。此外,各公司還與原始設備製造商 (OEM)、研究機構和半導體製造商結盟,以提供針對特定測試需求的客製化整合解決方案。
目錄
第1章:方法論與範圍
第2章:執行摘要
第3章:行業洞察
- 產業生態系統分析
- 供應商概況
- 利潤率
- 成本結構
- 每個階段的增值
- 影響價值鏈的因素
- 中斷
- 產業衝擊力
- 成長動力
- 對先進電子產品(電動車、5G、物聯網)的需求不斷成長
- 測量和自動化技術的進步
- 越來越重視產品可靠性和品質控制
- 加大半導體和航太領域的研發力度
- 智慧製造和工業4.0的擴展
- 產業陷阱與挑戰
- 永續材料成本高
- 回收基礎設施缺口
- 成長動力
- 成長潛力分析
- 監管格局
- 北美洲
- 歐洲
- 亞太地區
- 拉丁美洲
- 中東和非洲
- 波特的分析
- PESTEL分析
- 技術和創新格局
- 當前的技術趨勢
- 新興技術
- 價格趨勢
- 歷史價格分析(2021-2024)
- 價格趨勢促進因素
- 區域價格差異
- 價格預測(2025-2034年)
- 定價策略
- 新興商業模式
- 合規性要求
- 永續性措施
- 永續材料評估
- 碳足跡分析
- 循環經濟實施
- 永續性認證和標準
- 永續性投資報酬率分析
- 全球消費者情緒分析
- 專利分析
第4章:競爭格局
- 介紹
- 公司市佔率分析
- 按地區
- 北美洲
- 歐洲
- 亞太地區
- 拉丁美洲
- 中東和非洲
- 市場集中度分析
- 按地區
- 關鍵參與者的競爭基準
- 財務績效比較
- 收入
- 利潤率
- 研發
- 產品組合比較
- 產品範圍廣度
- 科技
- 創新
- 地理位置比較
- 全球足跡分析
- 服務網路覆蓋
- 各地區市場滲透率
- 競爭定位矩陣
- 領導者
- 挑戰者
- 追蹤者
- 利基市場參與者
- 戰略展望矩陣
- 財務績效比較
- 2021-2024 年關鍵發展
- 併購
- 夥伴關係和合作
- 技術進步
- 擴張和投資策略
- 永續發展舉措
- 數位轉型舉措
- 新興/新創企業競爭對手格局
第5章:市場估計與預測:按類型,2021 - 2034 年
- 主要趨勢
- 手持式 LCR 表
- 桌上型 LCR 表
- 攜帶式LCR表
- 模組化/自動 LCR 表
第6章:市場估計與預測:按測量參數,2021 - 2034 年
- 主要趨勢
- L(電感)
- C(電容)
- R(阻力)
- Q(品質因數)
- D(耗散因數)
- 阻抗
- 相位角
- 導納 (Y)、電導 (G)、電納 (B)
第7章:市場估計與預測:按頻率範圍類型,2021 - 2034 年
- 主要趨勢
- 低頻(<1 kHz)
- 中頻(1 kHz - 1 MHz)
- 高頻(> 1 MHz)
第8章:市場估計與預測:按最終用途產業,2021 - 2034 年
- 主要趨勢
- 製造業
- 汽車
- 衛生保健
- 半導體和電子產品
- 航太與國防
- 學術和研究機構
- 實用工具
- 其他(例如再生能源、物聯網設備製造商)
第9章:市場估計與預測:按地區,2021 - 2034 年
- 主要趨勢
- 北美洲
- 美國
- 加拿大
- 歐洲
- 德國
- 英國
- 法國
- 西班牙
- 義大利
- 荷蘭
- 亞太地區
- 中國
- 印度
- 日本
- 澳洲
- 韓國
- 拉丁美洲
- 巴西
- 墨西哥
- 阿根廷
- 中東和非洲
- 沙烏地阿拉伯
- 南非
- 阿拉伯聯合大公國
第10章:公司簡介
- Keysight Technologies
- Hioki EE Corporation
- Chroma ATE Inc.
- IET Labs, Inc.
- GW Instek (Good Will Instrument Co., Ltd.)
- B&K Precision Corporation
- Yokogawa Electric Corporation
- Fluke Corporation
- Agilent Technologies
- Extech Instruments
- Scientific Mes-Technik Pvt. Ltd.
- Newton4th Ltd (N4L)
- Kikusui Electronics Corporation
- Preen AC Power Corp.
- Applent Instruments Inc.
- DER EE Electrical Instrument Corp.
- TECPEL Co., Ltd.
- Victor Instruments (Shenzhen Victor Hi-Tech Co. Ltd.)
- Tonghui Electronics Co., Ltd.
- Aplab Limited
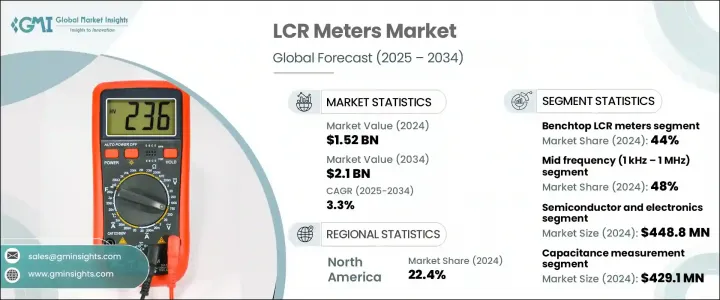
The Global LCR Meters Market was valued at USD 1.52 billion in 2024 and is estimated to grow at a CAGR of 3.3% to reach USD 2.1 billion by 2034. This steady growth is being fueled by the rising adoption of high-efficiency electronic systems and the increasing penetration of consumer electronics and IoT-enabled devices. As industries continue to focus on developing compact, high-performance electronics, the demand for advanced LCR measurement tools is surging. The integration of LCR meters is becoming vital in testing components for precision, reliability, and long-term stability.
Innovations in materials and circuit design are enabling these instruments to offer enhanced accuracy, better thermal stability, and lower energy usage. Additionally, global trends such as energy efficiency, environmental compliance, and the shift toward RoHS-compliant and lead-free components are reinforcing the importance of LCR testing across multiple industries.
| Market Scope | |
|---|---|
| Start Year | 2024 |
| Forecast Year | 2025-2034 |
| Start Value | $1.52 Billion |
| Forecast Value | $2.1 Billion |
| CAGR | 3.3% |
As smart manufacturing, e-commerce logistics, and automotive electronics evolve, manufacturers increasingly depend on advanced LCR solutions for quality control, system validation, and component matching in increasingly miniaturized designs and energy-optimized configurations. The shift toward automation, connectivity, and real-time data monitoring in production environments demands highly accurate testing equipment that can seamlessly integrate into digital quality assurance workflows. LCR meters play a critical role in ensuring the reliability of passive components like inductors, capacitors, and resistors, especially as these parts become smaller and are used in more complex circuit architectures.
The benchtop LCR meters segment generated USD 668.8 million in 2024. Known for their exceptional precision and advanced impedance analysis, benchtop models are a critical component in laboratories and testing facilities across various industries, including telecommunications, automotive, and semiconductors. These devices offer broader frequency ranges and maintain tight measurement tolerances, making them highly suitable for validating performance under diverse testing conditions. Compared to portable models, benchtop LCR meters provide deeper analysis, better data resolution, and faster test cycle times, helping professionals ensure quality assurance in highly complex systems and components.
In 2024, the capacitance testing segment captured significant value in the LCR meters market, reaching USD 429.1 million. Capacitance measurement continues to be a vital function in electronic testing as it directly affects the design and reliability of circuits. With growing use of complex capacitors in miniaturized devices across telecom, consumer electronics, and automotive applications, demand for precision instruments capable of analyzing multilayer ceramic capacitors (MLCCs) has surged. Manufacturers rely on high-accuracy LCR meters to identify deviations and prevent potential failures in components during early design or final production stages. This testing ensures stable electrical behavior, helping meet performance and regulatory benchmarks across various industry verticals.
United States LCR Meters Market was valued at USD 300.66 million in 2024, driven by robust technological infrastructure and leadership across sectors like aerospace, automotive, and electronics. The growing reliance on advanced testing instruments in semiconductor production, EV development, and 5G network expansion has reinforced the demand for LCR meters that offer high frequency, automation, and measurement accuracy. The U.S. also benefits from extensive R&D investments, which are pushing the adoption of next-gen LCR tools in product innovation, system integration, and quality control workflows. As electronic design standards become increasingly stringent, the market is shifting toward smarter, software-integrated LCR meters optimized for advanced material testing and device calibration.
The competitive landscape of the LCR Meters Industry includes a wide range of players, such as IET Labs, Inc., Keysight Technologies, Hioki E.E. Corporation, GW Instek, Chroma ATE Inc., Yokogawa Electric Corporation, B&K Precision Corporation, Extech Instruments, Fluke Corporation, Agilent Technologies, Newton4th Ltd (N4L), Kikusui Electronics Corporation, Preen AC Power Corp., DER EE Electrical Instrument Corp., TECPEL Co., Ltd., Aplab Limited, Applent Instruments Inc., Victor Instruments, Scientific Mes-Technik Pvt. Ltd., and Tonghui Electronics Co., Ltd.
To expand their presence and strengthen market positioning, key companies in the LCR meters industry are focusing on innovation, strategic partnerships, and customer-centric development. Many are investing in R&D to introduce compact, multi-functional meters with automated testing capabilities and enhanced data analysis. Companies are also forming alliances with OEMs, research institutes, and semiconductor manufacturers to offer integrated solutions tailored to specific testing needs.
Table of Contents
Chapter 1 Methodology and Scope
- 1.1 Market scope and definition
- 1.2 Research design
- 1.2.1 Research approach
- 1.2.2 Data collection methods
- 1.3 Data mining sources
- 1.3.1 Global
- 1.3.2 Regional/Country
- 1.4 Base estimates and calculations
- 1.4.1 Base year calculation
- 1.4.2 Key trends for market estimation
- 1.5 Primary research and validation
- 1.5.1 Primary sources
- 1.6 Forecast model
- 1.7 Research assumptions and limitations
Chapter 2 Executive Summary
- 2.1 Industry snapshot
- 2.2 Key market trends
- 2.2.1 Market type trends
- 2.2.2 Material trends
- 2.2.3 Application trends
- 2.2.4 Regional
- 2.3 TAM Analysis, 2025-2034 (USD Million & Units)
- 2.4 CXO perspectives: Strategic imperatives
- 2.4.1 Executive decision points
- 2.4.2 critical success factors
- 2.5 Future outlook and strategic recommendations
Chapter 3 Industry Insights
- 3.1 Industry ecosystem analysis
- 3.1.1 Supplier Landscape
- 3.1.2 Profit Margin
- 3.1.3 Cost structure
- 3.1.4 Value addition at each stage
- 3.1.5 Factor affecting the value chain
- 3.1.6 Disruptions
- 3.2 Industry impact forces
- 3.2.1 Growth drivers
- 3.2.1.1 Rising demand for advanced electronics (EVs, 5G, IoT)
- 3.2.1.2 Advancements in measurement and automation technologies
- 3.2.1.3 Growing focus on product reliability and quality control
- 3.2.1.4 Increasing R&D in semiconductors and aerospace sectors
- 3.2.1.5 Expansion of smart manufacturing and Industry 4.0
- 3.2.2 Industry pitfalls and challenges
- 3.2.2.1 High costs of sustainable materials
- 3.2.2.2 Recycling infrastructure gaps
- 3.2.1 Growth drivers
- 3.3 Growth potential analysis
- 3.4 Regulatory landscape
- 3.4.1 North America
- 3.4.2 Europe
- 3.4.3 Asia Pacific
- 3.4.4 Latin America
- 3.4.5 Middle East & Africa
- 3.5 Porter's analysis
- 3.6 PESTEL analysis
- 3.7 Technology and innovation landscape
- 3.7.1 Current technological trends
- 3.7.2 Emerging technologies
- 3.8 Price trends
- 3.8.1 Historical price analysis (2021-2024)
- 3.8.2 Price trend drivers
- 3.8.3 Regional price variations
- 3.8.4 Price forecast (2025-2034)
- 3.9 Pricing strategies
- 3.10 Emerging business models
- 3.11 Compliance requirements
- 3.12 Sustainability measures
- 3.12.1 Sustainable materials assessment
- 3.12.2 Carbon footprint analysis
- 3.12.3 Circular economy implementation
- 3.12.4 Sustainability certifications and standards
- 3.12.5 Sustainability roi analysis
- 3.13 Global consumer sentiment analysis
- 3.14 Patent analysis
Chapter 4 Competitive Landscape, 2024
- 4.1 Introduction
- 4.2 Company market share analysis
- 4.2.1 By region
- 4.2.1.1 North America
- 4.2.1.2 Europe
- 4.2.1.3 Asia Pacific
- 4.2.1.4 Latin America
- 4.2.1.5 Middle East & Africa
- 4.2.2 Market Concentration Analysis
- 4.2.1 By region
- 4.3 Competitive benchmarking of key players
- 4.3.1 Financial performance comparison
- 4.3.1.1 Revenue
- 4.3.1.2 Profit margin
- 4.3.1.3 R&D
- 4.3.2 Product portfolio comparison
- 4.3.2.1 Product range breadth
- 4.3.2.2 Technology
- 4.3.2.3 Innovation
- 4.3.3 Geographic presence comparison
- 4.3.3.1 Global footprint analysis
- 4.3.3.2 Service network coverage
- 4.3.3.3 Market penetration by region
- 4.3.4 Competitive positioning matrix
- 4.3.4.1 Leaders
- 4.3.4.2 Challengers
- 4.3.4.3 Followers
- 4.3.4.4 Niche players
- 4.3.5 Strategic outlook matrix
- 4.3.1 Financial performance comparison
- 4.4 Key developments, 2021-2024
- 4.4.1 Mergers and acquisitions
- 4.4.2 Partnerships and collaborations
- 4.4.3 Technological advancements
- 4.4.4 Expansion and investment strategies
- 4.4.5 Sustainability initiatives
- 4.4.6 Digital transformation initiatives
- 4.5 Emerging/ startup competitors landscape
Chapter 5 Market Estimates and Forecast, By Type, 2021 - 2034 (USD Million & Units)
- 5.1 Key trends
- 5.2 Handheld LCR Meters
- 5.3 Benchtop LCR Meters
- 5.4 Portable LCR Meters
- 5.5 Modular/Automatic LCR Meters
Chapter 6 Market Estimates and Forecast, By Measurement Parameters, 2021 - 2034 (USD Million & Units)
- 6.1 Key trends
- 6.2 L (Inductance)
- 6.3 C (Capacitance)
- 6.4 R (Resistance)
- 6.5 Q (Quality Factor)
- 6.6 D (Dissipation Factor)
- 6.7 Impedance
- 6.8 Phase Angle
- 6.9 Admittance (Y), Conductance (G), Susceptance (B)
Chapter 7 Market Estimates and Forecast, By Frequency Range Type, 2021 - 2034 (USD Million & Units)
- 7.1 Key trends
- 7.2 Low Frequency (< 1 kHz)
- 7.3 Mid Frequency (1 kHz - 1 MHz)
- 7.4 High Frequency (> 1 MHz)
Chapter 8 Market Estimates and Forecast, By End Use Industry, 2021 - 2034 (USD Million & Units)
- 8.1 Key trends
- 8.2 Manufacturing
- 8.3 Automotive
- 8.4 Healthcare
- 8.5 Semiconductors & electronics
- 8.6 Aerospace & defense
- 8.7 Academic & research institutions
- 8.8 Utilities
- 8.9 Others (e.g., renewable energy, iot device manufacturers)
Chapter 9 Market Estimates and Forecast, By Region, 2021 - 2034 (USD Million & Units)
- 9.1 Key trends
- 9.2 North America
- 9.2.1 U.S.
- 9.2.2 Canada
- 9.3 Europe
- 9.3.1 Germany
- 9.3.2 UK
- 9.3.3 France
- 9.3.4 Spain
- 9.3.5 Italy
- 9.3.6 Netherlands
- 9.4 Asia Pacific
- 9.4.1 China
- 9.4.2 India
- 9.4.3 Japan
- 9.4.4 Australia
- 9.4.5 South Korea
- 9.5 Latin America
- 9.5.1 Brazil
- 9.5.2 Mexico
- 9.5.3 Argentina
- 9.6 Middle East and Africa
- 9.6.1 Saudi Arabia
- 9.6.2 South Africa
- 9.6.3 UAE
Chapter 10 Company Profiles
- 10.1 Keysight Technologies
- 10.2 Hioki E.E. Corporation
- 10.3 Chroma ATE Inc.
- 10.4 IET Labs, Inc.
- 10.5 GW Instek (Good Will Instrument Co., Ltd.)
- 10.6 B&K Precision Corporation
- 10.7 Yokogawa Electric Corporation
- 10.8 Fluke Corporation
- 10.9 Agilent Technologies
- 10.10 Extech Instruments
- 10.11 Scientific Mes-Technik Pvt. Ltd.
- 10.12 Newton4th Ltd (N4L)
- 10.13 Kikusui Electronics Corporation
- 10.14 Preen AC Power Corp.
- 10.15 Applent Instruments Inc.
- 10.16 DER EE Electrical Instrument Corp.
- 10.17 TECPEL Co., Ltd.
- 10.18 Victor Instruments (Shenzhen Victor Hi-Tech Co. Ltd.)
- 10.19 Tonghui Electronics Co., Ltd.
- 10.20 Aplab Limited


