


 |
市場調查報告書
商品編碼
1797729
GaN 充電器市場機會、成長動力、產業趨勢分析及 2025 - 2034 年預測GaN-powered Chargers Market Opportunity, Growth Drivers, Industry Trend Analysis, and Forecast 2025 - 2034 |
||||||
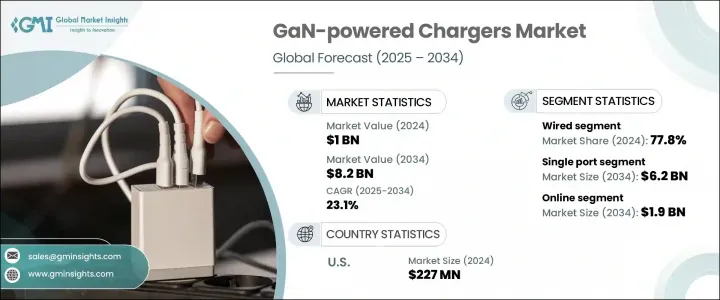
2024年,全球氮化鎵充電器市場規模達10億美元,預計2034年將以23.1%的複合年成長率成長,達到82億美元。這一快速成長的動力源於家庭和各行各業智慧型設備的日益融合,以及電動車和自動化工業系統等行業日益成長的需求。隨著全球數位互聯互通的不斷加深,越來越多的消費者和企業依賴高耗電電子設備,這反過來又加速了對緊湊、節能、高速充電方案的需求。
基於GaN的充電器因其緊湊的設計、更快的功率輸出和更高的熱效率而日益普及。這些特性符合當前人們對更小、充電更快、功耗更低的設備的技術需求。隨著全球電氣化進程的推進,尤其是在交通運輸和製造業,向GaN供電系統的轉變趨勢日益明顯。
| 市場範圍 | |
|---|---|
| 起始年份 | 2024 |
| 預測年份 | 2025-2034 |
| 起始值 | 10億美元 |
| 預測值 | 82億美元 |
| 複合年成長率 | 23.1% |
它們能夠提供緊湊的架構和高效的能量轉換,使其成為不斷發展的電動車基礎設施和智慧工業環境的首選。隨著工業和交通系統日益向電氣化轉型,對能夠最大限度減少能量損耗和佔用更少空間的高性能充電解決方案的需求也日益成長。 GaN 充電設備非常適合這種轉變,因為它們能夠實現更快的充電週期、減少熱量積聚,並能夠無縫整合到優先考慮空間最佳化和節能的下一代設計中。
2024年,有線充電市場佔了77.8%的市佔率。該領域因其高效、兼容多種快充協議以及高可靠性而備受青睞,尤其是在以工作為中心和混合充電環境中。用戶仍然依賴有線充電,因為它速度快、一致性高,尤其是在專業和旅行場景中。 USB-C PD等通用充電協定的廣泛接受也支持了有線解決方案的主導地位。建議製造商優先考慮有線GaN充電器設計的創新,特別是整合多協議支持,以滿足追求高性能和注重成本的買家的需求。
單埠 GaN 充電器市場預計到 2034 年將達到 62 億美元,這得益於其在追求簡潔便攜性的個人群體中的強大吸引力。這類充電器尤其受到學生、通勤者和追求快速行動充電的極簡主義用戶的青睞。其緊湊的尺寸和與旗艦電子設備的兼容性使其成為滿足日常需求的實用之選。此外,USB-C 供電標準的日益普及,透過簡化電力傳輸並最佳化尺寸,將繼續支持市場成長。製造商正在積極推出功率範圍為 30W 至 65W 的袖珍 GaN 型號,瞄準尋求節省空間和高效充電方案的用戶。
北美GaN充電器市場佔24.9%的市場佔有率,預計2025年至2034年的複合年成長率將達到24%。這一成長趨勢主要源自於消費者對高效能充電器日益成長的期望,以及節能電子解決方案的日益普及。該地區對緊湊型、高熱效率和高速充電設備的青睞,正在推動GaN技術的發展。消費者的偏好正在從笨重、充電速度慢的產品轉向更時尚、更先進、更符合永續發展實踐和效能需求的解決方案。
塑造GaN供電充電器市場的主要產業參與者包括Baseus Technology、RAVPower、Anker Innovations、Belkin International和Aukey International。這些公司正在積極投資研究、創新和產品多樣化,以鞏固其在競爭格局中的地位。為了加強其市場影響力,領先的公司正專注於一系列策略舉措。一項關鍵策略是持續創新,尤其是在開發緊湊型、高功率、支援多協議的GaN充電器方面,以滿足消費者和工業領域不斷變化的需求。他們正在利用策略合作夥伴關係和OEM合作來擴大全球分銷並滲透新興市場。此外,企業正在投資垂直整合,以提高供應鏈效率並降低生產成本。一些品牌優先考慮創造環保且散熱高效的設計,以符合全球能源標準和永續技術趨勢。這些積極主動的策略正在幫助市場領導者確保長期成長和持久的競爭優勢。
目錄
第1章:方法論
- 市場範圍和定義
- 研究設計
- 研究方法
- 資料收集方法
- 資料探勘來源
- 全球的
- 地區/國家
- 基礎估算與計算
- 基準年計算
- 市場評估的主要趨勢
- 初步研究和驗證
- 主要來源
- 預測模型
- 研究假設和局限性
第2章:執行摘要
第3章:行業洞察
- 產業生態系統分析
- 供應商格局
- 利潤率分析
- 成本結構
- 每個階段的增值
- 影響價值鏈的因素
- 中斷
- 產業衝擊力
- 成長動力
- 智慧型設備和消費性電子產品的普及
- 電動車和工業應用的採用率不斷提高
- USB-C 和 PD 充電標準的採用率不斷上升
- 成長動力
3.2.1.4. 5G基礎設施和物聯網生態系統的擴展
- 遠端工作和行動裝置使用量激增
- 產業陷阱與挑戰
- GaN組件和製造成本高昂
- 與舊設備的兼容性限制
- 市場機會
- 對緊湊型、高效能充電器的需求不斷成長
- 電動汽車和攜帶式電動汽車配件的成長
- GaN n 在工業和醫療電子中的整合
- 通用多埠充電站的開發
- 成長潛力分析
- 監管格局
- 北美洲
- 歐洲
- 亞太地區
- 拉丁美洲
- 中東和非洲
- 波特的分析
- PESTEL分析
- 科技與創新格局
- 當前的技術趨勢
- 新興技術
- 價格趨勢
- 按地區
- 按產品
- 定價策略
- 新興商業模式
- 合規性要求
- 專利和智慧財產權分析
- 地緣政治與貿易動態
第4章:競爭格局
- 介紹
- 公司市佔率分析
- 按地區
- 北美洲
- 歐洲
- 亞太地區
- 拉丁美洲
- 中東和非洲
- 按地區
- 關鍵參與者的競爭基準
- 財務績效比較
- 收入
- 利潤率
- 研發
- 產品組合比較
- 產品範圍廣度
- 科技
- 創新
- 地理位置比較
- 全球足跡分析
- 服務網路覆蓋
- 各地區市場滲透率
- 競爭定位矩陣
- 領導者
- 挑戰者
- 追蹤者
- 利基市場參與者
- 戰略展望矩陣
- 財務績效比較
- 2021-2024 年關鍵發展
- 併購
- 夥伴關係和合作
- 技術進步
- 擴張和投資策略
- 永續發展舉措
- 數位轉型舉措
- 新興/新創企業競爭對手格局
第5章:市場估計與預測:按類型,2021 - 2034 年
- 主要趨勢
- 有線
- 無線的
第6章:市場估計與預測:依產品類型,2021 - 2034 年
- 主要趨勢
- 壁式充電器
- 桌面充電器
- 旅行適配器
- 其他
第7章:市場估計與預測:按港口數量,2021 - 2034 年
- 主要趨勢
- 單埠
- 多埠
第8章:市場估計與預測:按發電量,2021 - 2034
- 主要趨勢
- 高達 30 瓦
- 31瓦至65瓦
- 66瓦至100瓦
- 101瓦至200瓦
- 200W以上
第9章:市場估計與預測:按港口類型,2021 - 2034 年
- 主要趨勢
- USB C 型
- USB A 型
- 混合埠
第 10 章:市場估計與預測:按設備相容性,2021 年至 2034 年
- 主要趨勢
- 智慧型手機
- 平板電腦
- 筆記型電腦
- 智慧手錶和穿戴式裝置
- 隨身遊戲機
- 相機和無人機
- 其他
第 11 章:市場估計與預測:按銷售管道,2021 年至 2034 年
- 主要趨勢
- 線上
- 離線
第 12 章:市場估計與預測:依最終用途,2021 年至 2034 年
- 主要趨勢
- 個人消費者
- 企業和公司
- 政府和國防
- 其他
第 13 章:市場估計與預測:按地區,2021 年至 2034 年
- 主要趨勢
- 北美洲
- 美國
- 加拿大
- 歐洲
- 德國
- 英國
- 法國
- 義大利
- 西班牙
- 荷蘭
- 亞太地區
- 中國
- 印度
- 日本
- 澳洲
- 韓國
- 拉丁美洲
- 巴西
- 墨西哥
- 阿根廷
- MEA
- 南非
- 沙烏地阿拉伯
- 阿拉伯聯合大公國
第 14 章:公司簡介
- Global Key Players
- Regional Key Players
- 利基市場參與者/顛覆者
- DSD技術
- iWalk電子
- OmniCharge
- Zendure
The Global GaN-powered Chargers Market was valued at USD 1 billion in 2024 and is estimated to grow at a CAGR of 23.1% to reach USD 8.2 billion by 2034. This rapid growth is being fueled by the increasing integration of smart devices across households and industries, along with growing demand from sectors such as electric vehicles and automated industrial systems. As global digital connectivity deepens, more consumers and businesses are relying on power-hungry electronics, which in turn accelerates the need for compact, energy-efficient, and high-speed charging options.
GaN-based chargers are gaining popularity for their compact designs, faster power delivery, and improved thermal efficiency. These features align with current technological demands for devices that are smaller, charge faster, and waste less power. As electrification efforts expand globally, especially in transportation and manufacturing, the shift toward GaN-powered systems is becoming more apparent.
| Market Scope | |
|---|---|
| Start Year | 2024 |
| Forecast Year | 2025-2034 |
| Start Value | $1 Billion |
| Forecast Value | $8.2 Billion |
| CAGR | 23.1% |
Their ability to offer compact architecture while delivering efficient energy conversion is making them a preferred choice in evolving EV infrastructure and smart industrial settings. As industries and transportation systems increasingly transition toward electrification, the demand for high-performance charging solutions that minimize energy loss and occupy less space is surging. GaN-powered chargers are ideally suited for this shift, as they enable faster charging cycles, reduce thermal buildup, and integrate seamlessly into next-generation designs that prioritize space optimization and energy savings.
The wired segment held a 77.8% share in 2024. This segment is favored for its efficiency, compatibility with various fast-charging protocols, and high reliability, particularly in work-centric and hybrid environments. Users continue to rely on wired charging for its speed and consistency, especially in professional and travel scenarios. The dominance of wired solutions is also supported by the broad acceptance of universal charging protocols like USB-C PD. Manufacturers are advised to prioritize innovations in wired GaN charger design, especially by integrating multi-protocol support to meet the demands of both high-performance and cost-conscious buyers.
The single-port GaN charger segment is expected to reach USD 6.2 billion by 2034, supported by its strong appeal among individuals seeking simplicity and portability. These chargers are especially popular with students, commuters, and minimalist users who require quick, on-the-go charging. Their compact size and compatibility with flagship electronic devices make them a practical choice for everyday needs. Moreover, the growing uptake of the USB-C Power Delivery standard continues to support market growth by simplifying power transfer while optimizing size. Manufacturers are actively launching pocket-sized GaN models in the 30W to 65W power range, targeting users looking for space-saving and efficient charging options.
North America GaN-powered Chargers Market held 24.9% share and is forecast to grow at a CAGR of 24% from 2025 to 2034. This upward trend is primarily driven by growing consumer expectations for high-performance chargers and the increasing adoption of energy-conscious electronic solutions. The region's embrace of compact, thermally efficient, and high-speed charging devices is pushing GaN technology forward. Consumer preferences are shifting away from bulky, slow-charging products to sleeker, more advanced solutions that align with sustainable practices and performance needs.
Major industry players shaping the GaN-powered charger market include Baseus Technology, RAVPower, Anker Innovations, Belkin International, and Aukey International. These companies are actively investing in research, innovation, and product diversification to solidify their positions within the competitive landscape. To strengthen their market presence, leading companies are focusing on a range of strategic initiatives. A key tactic involves continuous innovation, especially in developing compact, high-wattage GaN chargers with multi-protocol support that cater to the evolving needs of both consumer and industrial segments. Strategic partnerships and OEM collaborations are being leveraged to expand global distribution and penetrate emerging markets. Additionally, firms are investing in vertical integration to improve supply chain efficiency and reduce production costs. Some brands are prioritizing the creation of environmentally friendly and thermally efficient designs, aligning with global energy standards and sustainable technology trends. These proactive strategies are helping market leaders secure long-term growth and a resilient competitive advantage.
Table of Contents
Chapter 1 Methodology
- 1.1 Market scope and definition
- 1.2 Research design
- 1.2.1 Research approach
- 1.2.2 Data collection methods
- 1.3 Data mining sources
- 1.3.1 Global
- 1.3.2 Regional/Country
- 1.4 Base estimates and calculations
- 1.4.1 Base year calculation
- 1.4.2 Key trends for market estimation
- 1.5 Primary research and validation
- 1.5.1 Primary sources
- 1.6 Forecast model
- 1.7 Research assumptions and limitations
Chapter 2 Executive Summary
- 2.1 Industry 3600 synopsis, 2021 - 2034
- 2.2 Key market trends
- 2.2.1 Type trends
- 2.2.2 Product type trends
- 2.2.3 Number of ports trends
- 2.2.4 Power output trends
- 2.2.5 Port type trends
- 2.2.6 Device compatibility trends
- 2.2.7 Sales channel trends
- 2.2.8 End use trends
- 2.2.9 Regional trends
- 2.3 TAM Analysis, 2025-2034
- 2.4 CXO perspectives: Strategic imperatives
- 2.4.1 Executive decision points
- 2.4.2 Critical success factors
- 2.5 Future outlook and strategic recommendations
Chapter 3 Industry Insights
- 3.1 Industry ecosystem analysis
- 3.1.1 Supplier landscape
- 3.1.2 Profit margin analysis
- 3.1.3 Cost structure
- 3.1.4 Value addition at each stage
- 3.1.5 Factor affecting the value chain
- 3.1.6 Disruptions
- 3.2 Industry impact forces
- 3.2.1 Growth drivers
- 3.2.1.1 Proliferation of smart devices and consumer electronics
- 3.2.1.2 Increased adoption in electric vehicles and industrial applications
- 3.2.1.3 Rising adoption of USB-C and PD charging standards
- 3.2.1 Growth drivers
3.2.1.4. Expansion of 5G infrastructure and IoT ecosystems
- 3.2.1.5 Surge in remote work and mobile device usage
- 3.2.2 Industry pitfalls and challenges
- 3.2.2.1 High costs associated with GaN components and manufacturing
- 3.2.2.2 Compatibility limitations with legacy devices
- 3.2.3 Market opportunities
- 3.2.3.1 Rising demand for compact, high-efficiency chargers
- 3.2.3.2 Growth in electric mobility and portable EV accessories
- 3.2.3.3 Integration of GaN n in industrial and medical electronics
- 3.2.3.4 Development of universal multi-port charging stations
- 3.3 Growth potential analysis
- 3.4 Regulatory landscape
- 3.4.1 North America
- 3.4.2 Europe
- 3.4.3 Asia Pacific
- 3.4.4 Latin America
- 3.4.5 Middle East & Africa
- 3.5 Porter's analysis
- 3.6 PESTEL analysis
- 3.7 Technology and Innovation landscape
- 3.7.1 Current technological trends
- 3.7.2 Emerging technologies
- 3.8 Price trends
- 3.8.1 By region
- 3.8.2 By product
- 3.9 Pricing strategies
- 3.10 Emerging business models
- 3.11 Compliance requirements
- 3.12 Patent and IP analysis
- 3.13 Geopolitical and trade dynamics
Chapter 4 Competitive Landscape, 2024
- 4.1 Introduction
- 4.2 Company market share analysis
- 4.2.1 By region
- 4.2.1.1 North America
- 4.2.1.2 Europe
- 4.2.1.3 Asia Pacific
- 4.2.1.4 Latin America
- 4.2.1.5 Middle East & Africa
- 4.2.1 By region
- 4.3 Competitive benchmarking of key players
- 4.3.1 Financial performance comparison
- 4.3.1.1 Revenue
- 4.3.1.2 Profit margin
- 4.3.1.3 R&D
- 4.3.2 Product portfolio comparison
- 4.3.2.1 Product range breadth
- 4.3.2.2 Technology
- 4.3.2.3 Innovation
- 4.3.3 Geographic presence comparison
- 4.3.3.1 Global footprint analysis
- 4.3.3.2 Service network coverage
- 4.3.3.3 Market penetration by region
- 4.3.4 Competitive positioning matrix
- 4.3.4.1 Leaders
- 4.3.4.2 Challengers
- 4.3.4.3 Followers
- 4.3.4.4 Niche players
- 4.3.5 Strategic outlook matrix
- 4.3.1 Financial performance comparison
- 4.4 Key developments, 2021-2024
- 4.4.1 Mergers and acquisitions
- 4.4.2 Partnerships and collaborations
- 4.4.3 Technological advancements
- 4.4.4 Expansion and investment strategies
- 4.4.5 Sustainability initiatives
- 4.4.6 Digital transformation initiatives
- 4.5 Emerging/ startup competitors landscape
Chapter 5 Market Estimates and Forecast, By Type, 2021 - 2034 (USD Million & Thousand Units)
- 5.1 Key trends
- 5.2 Wired
- 5.3 Wireless
Chapter 6 Market Estimates and Forecast, By Product Type, 2021 - 2034 (USD Million & Thousand Units)
- 6.1 Key trends
- 6.2 Wall chargers
- 6.3 Desktop chargers
- 6.4 Travel adapters
- 6.5 Others
Chapter 7 Market Estimates and Forecast, By Number of Ports, 2021 - 2034 (USD Million & Thousand Units)
- 7.1 Key trends
- 7.2 Single port
- 7.3 Multi port
Chapter 8 Market Estimates and Forecast, By Power Output, 2021 - 2034 (USD Million & Thousand Units)
- 8.1 Key trends
- 8.2 Up to 30w
- 8.3 31w to 65w
- 8.4 66w to 100w
- 8.5 101w to 200w
- 8.6 Above 200w
Chapter 9 Market Estimates and Forecast, By Port Type, 2021 - 2034 (USD Million & Thousand Units)
- 9.1 Key trends
- 9.2 USB type-C
- 9.3 USB type-A
- 9.4 Mixed port
Chapter 10 Market Estimates and Forecast, By Device Compatibility, 2021 - 2034 (USD Million & Thousand Units)
- 10.1 Key trends
- 10.2 Smartphones
- 10.3 Tablets
- 10.4 Laptops
- 10.5 Smartwatches & wearables
- 10.6 Portable game consoles
- 10.7 Cameras & drones
- 10.8 Others
Chapter 11 Market Estimates and Forecast, By Sales Channel, 2021 - 2034 (USD Million & Thousand Units)
- 11.1 Key trends
- 11.2 Online
- 11.3 Offline
Chapter 12 Market Estimates and Forecast, By End Use, 2021 - 2034 (USD Million & Thousand Units)
- 12.1 Key trends
- 12.2 Individual consumers
- 12.3 Enterprises & corporates
- 12.4 Government & defense
- 12.5 Others
Chapter 13 Market Estimates & Forecast, By Region, 2021 - 2034 (USD Million & Thousand Units)
- 13.1 Key trends
- 13.2 North America
- 13.2.1 U.S.
- 13.2.2 Canada
- 13.3 Europe
- 13.3.1 Germany
- 13.3.2 UK
- 13.3.3 France
- 13.3.4 Italy
- 13.3.5 Spain
- 13.3.6 Netherlands
- 13.4 Asia Pacific
- 13.4.1 China
- 13.4.2 India
- 13.4.3 Japan
- 13.4.4 Australia
- 13.4.5 South Korea
- 13.5 Latin America
- 13.5.1 Brazil
- 13.5.2 Mexico
- 13.5.3 Argentina
- 13.6 MEA
- 13.6.1 South Africa
- 13.6.2 Saudi Arabia
- 13.6.3 UAE
Chapter 14 Company Profiles
- 14.1 Global Key Players
- 14.1.1 Anker Innovations
- 14.1.2 Aukey International
- 14.1.3 Baseus Technology
- 14.1.4 Belkin International
- 14.1.5 RAVPower
- 14.2 Regional Key Players
- 14.2.1 North America
- 14.2.1.1 Apple
- 14.2.1.2 Energizer
- 14.2.1.3 Spigen
- 14.2.1.4 Satechi
- 14.2.2 Europe
- 14.2.2.1 Philips
- 14.2.2.2 VOLTME
- 14.2.2.3 Hama GmbH & Co KG
- 14.2.3 APAC
- 14.2.3.1 Samsung Electronics
- 14.2.3.2 Xiaomi
- 14.2.3.3 UGREEN Group
- 14.2.3.4 Pisen Electronics
- 14.2.3.5 Momax Technology
- 14.2.3.6 Zonsan Electronics
- 14.2.1 North America
- 14.3 Niche Players / Disruptors
- 14.3.1 DSD Tech
- 14.3.2 iWalk Electronics
- 14.3.3 OmniCharge
- 14.3.4 Zendure
 2026年全球攜帶式直流快速充電器市場報告
 2035年無線充電器市場氮化鎵(GaN)分析與預測:按類型、產品類型、服務、技術、組件、應用、設備、最終用戶、功能和安裝類型分類氮化鎵充電器市場分析及預測(至2035年):依類型、產品類型、技術、組件、應用、設備、最終用戶、功能及安裝類型分類2026年全球USB牆式充電器市場報告2026年全球有線充電市場報告
 氮化鎵充電器市場 - 全球產業規模、佔有率、趨勢、機會及預測(按功率、應用、最終用戶、地區和競爭格局分類,2021-2031)
 氮化鎵(GaN)電動車充電器市場機會、成長促進因素、產業趨勢分析及預測(2025-2034年)
 可攜式直流快速充電器:全球市場佔有率和排名、總收入和需求預測(2025-2031 年)
 氮化鎵(GaN)充電器:全球市場
 65W GaN 充電器市場(按連接器連接埠、連接埠類型、應用和分銷管道)—2025 年至 2030 年全球預測