


 |
市場調查報告書
商品編碼
1782148
物流市場中的生成人工智慧機會、成長動力、產業趨勢分析及 2025 - 2034 年預測Generative AI in Logistics Market Opportunity, Growth Drivers, Industry Trend Analysis, and Forecast 2025 - 2034 |
||||||
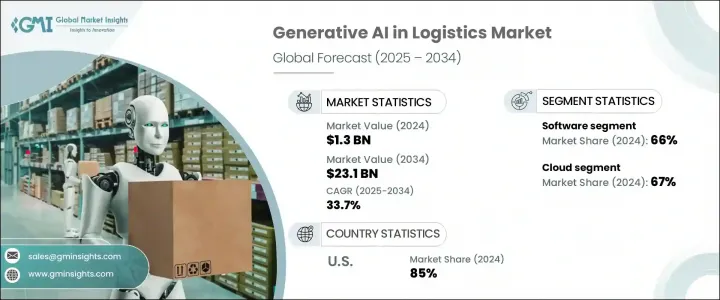
2024年,全球物流生成式人工智慧市場規模達13億美元,預計到2034年將以33.7%的複合年成長率成長,達到231億美元。這項技術透過提供即時情報和長期戰略預測,正在從根本上改變供應鏈營運。透過模擬數千條配送路線和運輸場景,物流供應商可以最佳化庫存計劃,降低運費,並為意外中斷做好準備。人工智慧驅動的需求預測還能簡化資源使用,而動態路線規劃工具則可縮短交付時間。隨著營運效率和成本控制變得越來越重要,生成式人工智慧的整合已成為塑造市場未來的關鍵力量。
生成式人工智慧使物流公司能夠透過分析客戶行為和偏好來增強服務個人化。這些智慧系統可以觸發即時警報,推薦理想的配送時間,並根據客戶互動自動調整服務。這種程度的客製化提升了客戶滿意度和忠誠度,同時也使企業能夠收取更高的價格。在競爭激烈的行業中,由人工智慧驅動的個人化物流體驗持續推動著產業發展。此外,隨著降低燃料成本和排放的壓力日益增大,物流車隊越來越依賴人工智慧,利用交通模式、天氣預測和歷史資料來推薦最佳化路線,從而使更清潔、更精簡的營運成為行業標準。
| 市場範圍 | |
|---|---|
| 起始年份 | 2024 |
| 預測年份 | 2025-2034 |
| 起始值 | 13億美元 |
| 預測值 | 231億美元 |
| 複合年成長率 | 33.7% |
2024年,軟體領域佔據了66%的市場佔有率,預計到2034年將以32%的複合年成長率成長。物流團隊優先考慮人工智慧驅動的預測工具,這些工具可以模擬各種供應鏈中斷情況,例如庫存短缺、交付延誤或需求突然激增。這些工具可協助企業主動調整營運,進而提高效率並降低成本。這些現代解決方案比舊模型更快地提供結果,並且易於與傳統系統整合,因此比耗時的客製化方案更具吸引力。
雲端部署領域在2024年佔據了67%的佔有率,預計到2034年將維持32%的複合年成長率的強勁成長。隨著物流業務在地理上日益分散,企業正在選擇靈活的、基於雲端的人工智慧解決方案,這些解決方案可以根據不斷變化的業務需求即時擴展。與傳統的伺服器設定不同,雲端平台能夠在需求激增時提供即時運算能力和資料存儲,尤其是在季節性高峰或市場意外波動期間。這種適應性使雲端系統對全球供應鏈至關重要,鞏固了其在該領域的主導地位。
北美物流市場生成式人工智慧佔85%的市場佔有率,2024年產值達3.552億美元。在IBM、微軟、亞馬遜、甲骨文、Palantir Technologies、SAP、NVIDIA和谷歌等主要科技公司的支持下,美國已成為供應鏈先進人工智慧應用的中心樞紐。這些公司提供企業級人工智慧基礎設施,使物流供應商能夠立即獲得尖端功能,加速演算法的開發和部署。這種快速的創新週期使美國成為全球物流人工智慧領域的領跑者。
物流市場生成式人工智慧的領導企業正在加倍投入戰略雲端合作夥伴關係、可擴展的人工智慧模型和行業特定的機器學習工具。他們也專注於模組化人工智慧解決方案,以快速適應特定區域和產業的物流挑戰。透過 API 整合增強用戶可存取性、建立即插即用平台以及實現即時資料視覺性是這些企業的共同目標。這些公司投資於敏捷開發環境,並提供低延遲運算以滿足即時物流需求。客製化能力、以永續性為重點的路線最佳化和預測分析被優先考慮,以提高客戶參與度並降低營運風險,從而幫助品牌在快速發展的市場格局中獲得競爭優勢。
目錄
第1章:方法論
- 市場範圍和定義
- 研究設計
- 研究方法
- 資料收集方法
- 資料探勘來源
- 全球的
- 地區/國家
- 基礎估算與計算
- 基準年計算
- 市場評估的主要趨勢
- 初步研究和驗證
- 主要來源
- 預測模型
- 研究假設和局限性
第2章:執行摘要
第3章:行業洞察
- 產業生態系統分析
- 供應商格局
- 利潤率
- 成本結構
- 每個階段的增值
- 影響價值鏈的因素
- 中斷
- 產業衝擊力
- 成長動力
- 增強供應鏈最佳化
- 重複流程的自動化
- 客戶的個人化體驗
- 具成本效益的車隊和航線管理
- 產業陷阱與挑戰
- 資料隱私和安全風險
- 與遺留系統的整合複雜性
- 市場機會
- 人工智慧驅動的需求預測與庫存最佳化
- 智慧倉儲的數位孿生創建
- 自主路線規劃與車隊管理
- 成長動力
- 成長潛力分析
- 監管格局
- 北美洲
- 歐洲
- 亞太地區
- 拉丁美洲
- 中東和非洲
- 波特的分析
- PESTEL分析
- 技術和創新格局
- 當前的技術趨勢
- 新興技術
- 案例研究
- 用例
- 成本細分分析
- 專利分析
- 永續性和環境方面
- 永續實踐
- 減少廢棄物的策略
- 生產中的能源效率
- 環保舉措
- 碳足跡考量
第4章:競爭格局
- 介紹
- 公司市佔率分析
- 北美洲
- 歐洲
- 亞太地區
- 拉丁美洲
- MEA
- 主要市場參與者的競爭分析
- 競爭定位矩陣
- 戰略展望矩陣
- 關鍵進展
- 併購
- 夥伴關係與合作
- 新產品發布
- 擴張計劃和資金
第5章:市場估計與預測:按類型,2021 - 2034 年
- 主要趨勢
- 變分自動編碼器
- 生成對抗網路
- 循環神經網路
- 長短期記憶網路
- 變形金剛
第6章:市場估計與預測:按組件,2021 - 2034 年
- 主要趨勢
- 軟體
- 服務
第7章:市場估計與預測:按部署模式,2021 - 2034 年
- 主要趨勢
- 雲
- 本地
第8章:市場估計與預測:按應用,2021 - 2034 年
- 主要趨勢
- 路線最佳化
- 需求預測
- 倉庫和庫存管理
- 供應鏈自動化
- 預測性維護
- 風險管理
- 客製化物流解決方案
- 其他
第9章:市場估計與預測:依最終用途,2021-2034
- 主要趨勢
- 第三方物流供應商
- 貨運代理
- 電子商務公司
- 製造商
第10章:市場估計與預測:按地區,2021 - 2034 年
- 主要趨勢
- 北美洲
- 美國
- 加拿大
- 歐洲
- 英國
- 德國
- 法國
- 義大利
- 西班牙
- 俄羅斯
- 北歐人
- 亞太地區
- 中國
- 印度
- 日本
- 韓國
- 澳新銀行
- 東南亞
- 拉丁美洲
- 巴西
- 墨西哥
- 阿根廷
- MEA
- 阿拉伯聯合大公國
- 沙烏地阿拉伯
- 南非
第 11 章:公司簡介
- Amazon Web Services
- DHL Group
- FedEx
- Flexport
- Four Kites
- IBM
- Locus
- Maersk
- Microsoft
- NVIDIA
- Open AI
- Optimal Dynamics
- Oracle
- Palantir Technologies
- Project44
- Salesforce
- SAP
- UPS
- XPO Logistics
The Global Generative AI in Logistics Market was valued at USD 1.3 billion in 2024 and is estimated to grow at a CAGR of 33.7% to reach USD 23.1 billion by 2034. This technology is fundamentally transforming supply chain operations by delivering both real-time intelligence and long-term strategic forecasting. By simulating thousands of delivery routes and transport scenarios, logistics providers can fine-tune inventory planning, lower freight expenses, and stay prepared for unexpected disruptions. AI-powered demand forecasting also streamlines resource use, while dynamic routing tools improve delivery timelines. As operational efficiency and cost control become more important, the integration of generative AI has emerged as a key force shaping the market's future.
Generative AI enables logistics firms to enhance service personalization by analyzing customer behavior and preferences. These intelligent systems can trigger real-time alerts, recommend ideal delivery windows, and automatically adjust services based on client interactions. This level of customization boosts customer satisfaction and loyalty while allowing businesses to charge premium prices. In a competitive industry, personalized logistics experiences powered by AI continue to drive momentum. Moreover, with growing pressure to reduce fuel costs and emissions, logistics fleets increasingly rely on AI to suggest optimized routes using traffic patterns, weather predictions, and historical data, making cleaner and leaner operations the standard.
| Market Scope | |
|---|---|
| Start Year | 2024 |
| Forecast Year | 2025-2034 |
| Start Value | $1.3 Billion |
| Forecast Value | $23.1 Billion |
| CAGR | 33.7% |
In 2024, the software segment held a 66% share and is set to grow at a CAGR of 32% through 2034. Logistics teams have prioritized AI-driven predictive tools that simulate numerous supply chain disruptions like stock shortages, delivery hold-ups, or sudden demand spikes. These tools help firms adjust operations proactively, improving both efficiency and cost outcomes. These modern solutions offer faster results than older models and integrate easily with legacy systems, making them more attractive than time-consuming, custom-built options.
The cloud deployment segment held a 67% share in 2024 and is expected to maintain strong growth at a CAGR of 32% through 2034. As logistics operations become more geographically dispersed, firms are choosing flexible, cloud-based AI solutions that scale instantly based on fluctuating business needs. Unlike traditional server setups, cloud platforms provide real-time computing power and data storage as demand surges, especially during seasonal peaks or unexpected market shifts. This adaptability makes cloud systems critical for global supply chains, reinforcing their dominance in the sector.
North America Generative AI In Logistics Market held 85% share and generated USD 355.2 million in 2024. The country has emerged as a central hub for advanced AI adoption in supply chains, backed by major tech firms like IBM, Microsoft, Amazon, Oracle, Palantir Technologies, SAP, NVIDIA, and Google. These companies offer enterprise-ready AI infrastructure, giving logistics providers immediate access to cutting-edge capabilities that accelerate algorithm development and deployment. This rapid innovation cycle positions the U.S. as a frontrunner in logistics AI worldwide.
Leading firms in the Generative AI in Logistics Market are doubling down on strategic cloud partnerships, scalable AI models, and industry-specific machine learning tools. They're also focusing on modular AI solutions that adapt quickly to regional and sector-specific logistics challenges. Enhancing user accessibility through API integration, building plug-and-play platforms, and enabling real-time data visibility are common goals. These companies invest in agile development environments and provide low-latency computing to meet real-time logistics demands. Customization capabilities, sustainability-focused route optimization, and predictive analytics are being prioritized to improve customer engagement and reduce operational risks, giving brands a competitive edge in a fast-evolving market landscape.
Table of Contents
Chapter 1 Methodology
- 1.1 Market scope and definition
- 1.2 Research design
- 1.2.1 Research approach
- 1.2.2 Data collection methods
- 1.3 Data mining sources
- 1.3.1 Global
- 1.3.2 Regional/Country
- 1.4 Base estimates and calculations
- 1.4.1 Base year calculation
- 1.4.2 Key trends for market estimation
- 1.5 Primary research and validation
- 1.5.1 Primary sources
- 1.6 Forecast model
- 1.7 Research assumptions and limitations
Chapter 2 Executive Summary
- 2.1 Industry 360° synopsis
- 2.2 Key market trends
- 2.2.1 Regional
- 2.2.2 Type
- 2.2.3 Component
- 2.2.4 Deployment mode
- 2.2.5 Application
- 2.2.6 End Use
- 2.3 TAM Analysis, 2025-2034
- 2.4 CXO perspectives: strategic imperatives
- 2.4.1 Executive decision points
- 2.4.2 Critical success factors
- 2.5 Future outlook and strategic recommendations
Chapter 3 Industry Insights
- 3.1 Industry ecosystem analysis
- 3.1.1 Supplier landscape
- 3.1.2 Profit margin
- 3.1.3 Cost structure
- 3.1.4 Value addition at each stage
- 3.1.5 Factors affecting the value chain
- 3.1.6 Disruptions
- 3.2 Industry impact forces
- 3.2.1 Growth drivers
- 3.2.1.1 Enhanced supply chain optimization
- 3.2.1.2 Automation of repetitive process
- 3.2.1.3 Personalized experience of the customers
- 3.2.1.4 Cost-efficient fleet & route management
- 3.2.2 Industry pitfalls and challenges
- 3.2.2.1 Data privacy and security risks
- 3.2.2.2 Integration complexity with legacy systems
- 3.2.3 Market opportunities
- 3.2.3.1 AI driven demand forecasting and inventory optimization
- 3.2.3.2 Digital twin creation for smart warehousing
- 3.2.3.3 Autonomous route planning and fleet management
- 3.2.1 Growth drivers
- 3.3 Growth potential analysis
- 3.4 Regulatory landscape
- 3.4.1 North America
- 3.4.2 Europe
- 3.4.3 Asia Pacific
- 3.4.4 Latin America
- 3.4.5 Middle East & Africa
- 3.5 Porter’s analysis
- 3.6 PESTEL analysis
- 3.7 Technology and innovation landscape
- 3.7.1 Current technological trends
- 3.7.2 Emerging technologies
- 3.8 Case studies
- 3.9 Use cases
- 3.10 Cost breakdown analysis
- 3.11 Patent analysis
- 3.12 Sustainability and environmental aspects
- 3.12.1 Sustainable practices
- 3.12.2 Waste reduction strategies
- 3.12.3 Energy efficiency in production
- 3.12.4 Eco-friendly initiatives
- 3.12.5 Carbon footprint considerations
Chapter 4 Competitive Landscape, 2024
- 4.1 Introduction
- 4.2 Company market share analysis
- 4.2.1 North America
- 4.2.2 Europe
- 4.2.3 Asia Pacific
- 4.2.4 LATAM
- 4.2.5 MEA
- 4.3 Competitive analysis of major market players
- 4.4 Competitive positioning matrix
- 4.5 Strategic outlook matrix
- 4.6 Key developments
- 4.6.1 Mergers & acquisitions
- 4.6.2 Partnerships & collaborations
- 4.6.3 New product launches
- 4.6.4 Expansion plans and funding
Chapter 5 Market Estimates & Forecast, By Type, 2021 - 2034 (USD Million)
- 5.1 Key trends
- 5.2 Variational autoencoder
- 5.3 Generative adversarial networks
- 5.4 Recurrent neural networks
- 5.5 Long short-term memory networks
- 5.6 Transformers
Chapter 6 Market Estimates & Forecast, By Component, 2021 - 2034 (USD Million)
- 6.1 Key trends
- 6.2 Software
- 6.3 Services
Chapter 7 Market Estimates & Forecast, By Deployment Mode, 2021 - 2034 (USD Million)
- 7.1 Key trends
- 7.2 Cloud
- 7.3 On-premises
Chapter 8 Market Estimates & Forecast, By Application, 2021 - 2034 (USD Million)
- 8.1 Key trends
- 8.2 Route optimization
- 8.3 Demand forecasting
- 8.4 Warehouse and inventory management
- 8.5 Supply chain automation
- 8.6 Predictive maintenance
- 8.7 Risk management
- 8.8 Customized logistics solution
- 8.9 Others
Chapter 9 Market Estimates & Forecast, By End Use, 2021- 2034 (USD Million)
- 9.1 Key trends
- 9.2 Third party logistics providers
- 9.3 Freight forwarders
- 9.4 E-commerce companies
- 9.5 Manufacturers
Chapter 10 Market Estimates & Forecast, By Region, 2021 - 2034 (USD Million)
- 10.1 Key trends
- 10.2 North America
- 10.2.1 U.S.
- 10.2.2 Canada
- 10.3 Europe
- 10.3.1 UK
- 10.3.2 Germany
- 10.3.3 France
- 10.3.4 Italy
- 10.3.5 Spain
- 10.3.6 Russia
- 10.3.7 Nordics
- 10.4 Asia Pacific
- 10.4.1 China
- 10.4.2 India
- 10.4.3 Japan
- 10.4.4 South Korea
- 10.4.5 ANZ
- 10.4.6 Southeast Asia
- 10.5 Latin America
- 10.5.1 Brazil
- 10.5.2 Mexico
- 10.5.3 Argentina
- 10.6 MEA
- 10.6.1 UAE
- 10.6.2 Saudi Arabia
- 10.6.3 South Africa
Chapter 11 Company Profiles
- 11.1 Amazon Web Services
- 11.2 DHL Group
- 11.3 FedEx
- 11.4 Flexport
- 11.5 Four Kites
- 11.6 Google
- 11.7 IBM
- 11.8 Locus
- 11.9 Maersk
- 11.10 Microsoft
- 11.11 NVIDIA
- 11.12 Open AI
- 11.13 Optimal Dynamics
- 11.14 Oracle
- 11.15 Palantir Technologies
- 11.16 Project44
- 11.17 Salesforce
- 11.18 SAP
- 11.19 UPS
- 11.20 XPO Logistics


