


 |
市場調查報告書
商品編碼
1773482
種植及施肥機械市場機會、成長動力、產業趨勢分析及 2025 - 2034 年預測Planting and Fertilizing Machinery Market Opportunity, Growth Drivers, Industry Trend Analysis, and Forecast 2025 - 2034 |
||||||
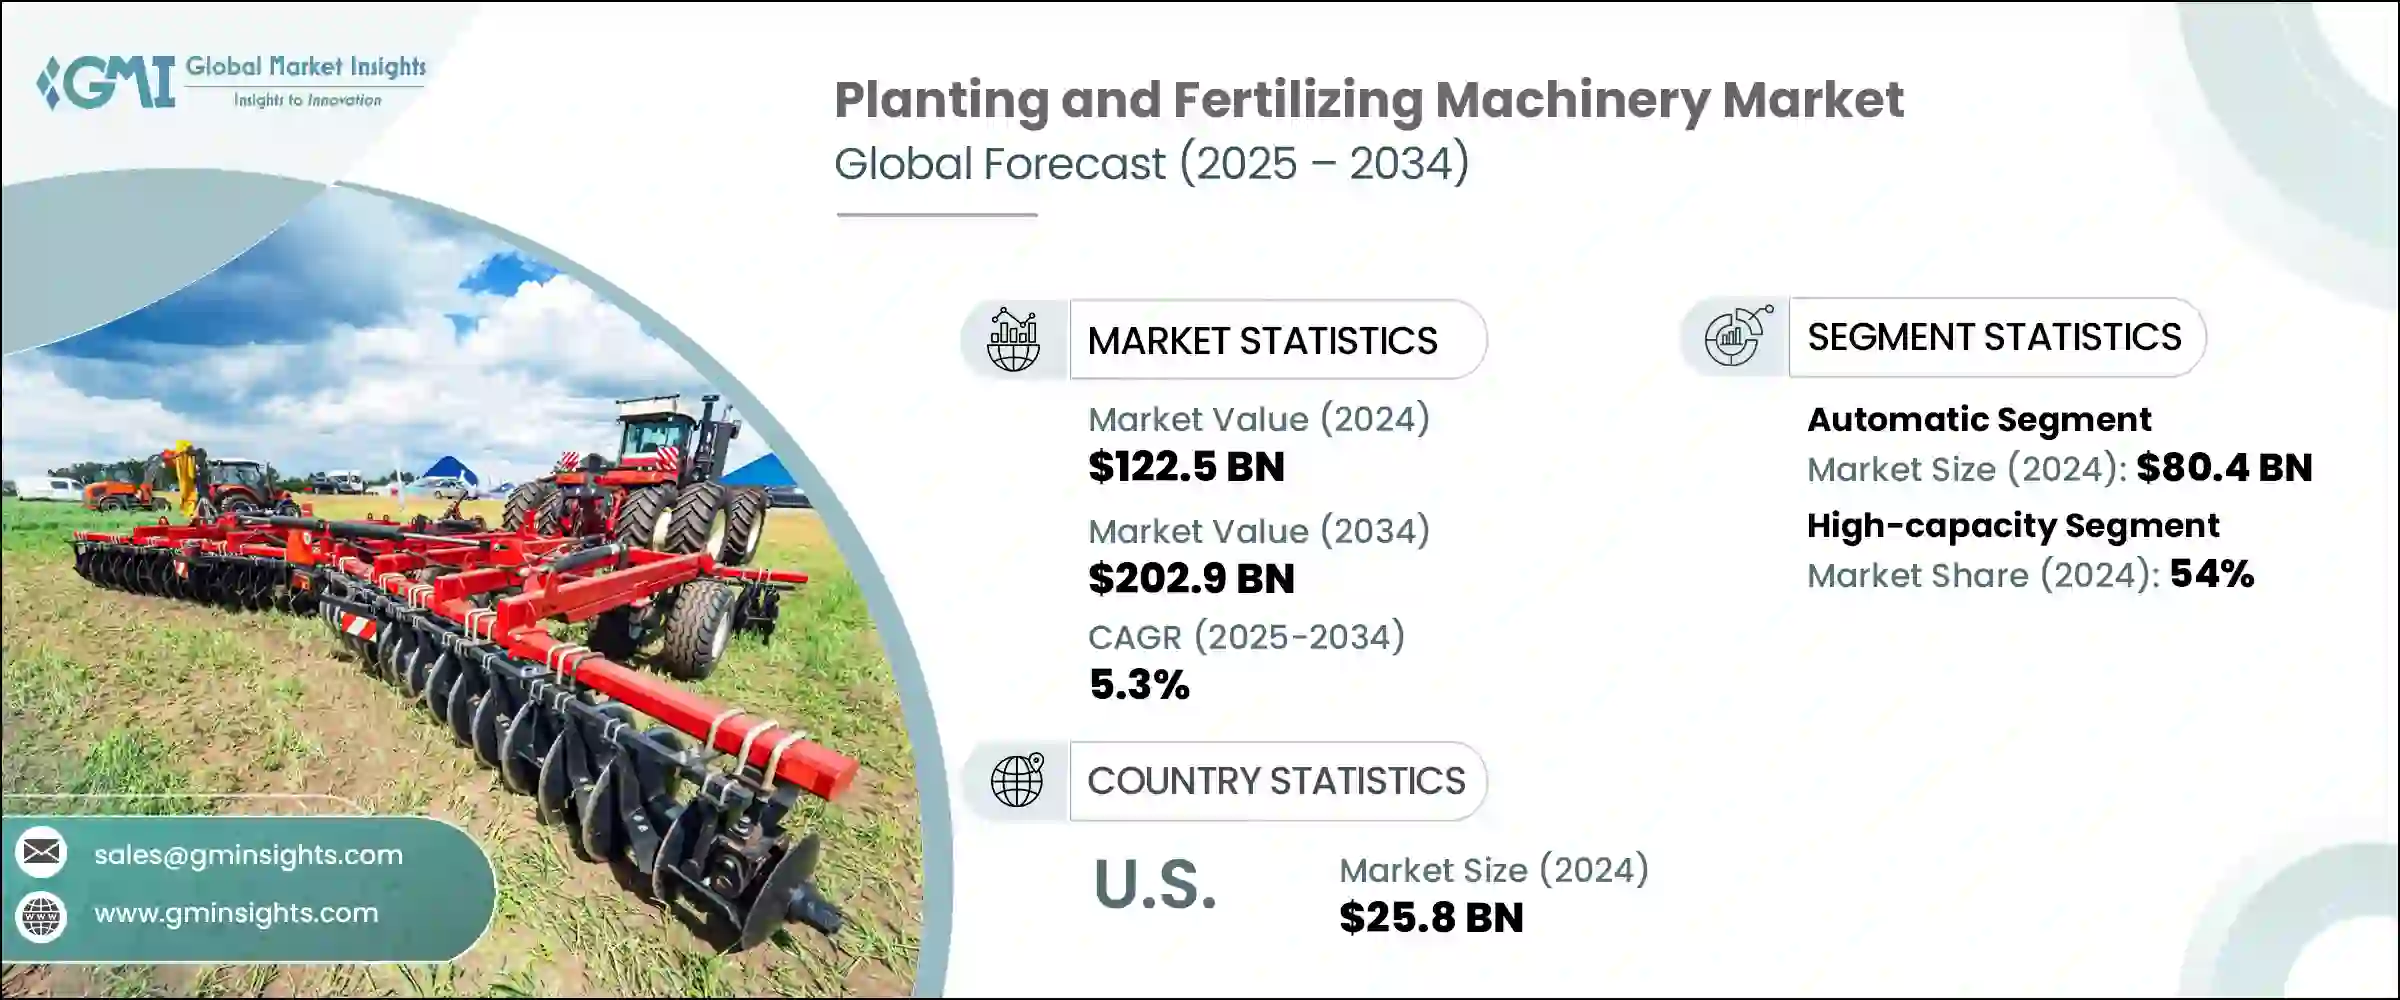
2024年,全球種植施肥機械市場規模達1,225億美元,預計2034年將以5.3%的複合年成長率成長,達到2,029億美元。這一成長主要歸因於農業實踐的持續轉型,傳統的手工作業正日益被現代機械化系統所取代。在許多發展中和轉型經濟體中,勞動成本的上升和持續的勞動力短缺迫使農場經營者轉向能夠更有效率、更精準地完成任務的機械。由於對及時作業和更高產量的需求,對能夠加快播種施肥速度並減少人力投入的設備的需求正在快速成長。
機械化在促進永續農業實踐方面也發揮著至關重要的作用。先進的播種施肥機械透過精準施肥減少種子和肥料的浪費,最大限度地減少對環境的影響,同時提高整體生產力。機械化工具的吸引力不僅在於節省勞動力,還在於其能夠提高投入效率——幫助種植者以更少的資源獲得更高的產量。隨著農業日益數據化,價值鏈上的利益相關者——包括製造商、農場經營者和政策制定者——對採用支持高效精準農業的機械表現出越來越濃厚的興趣。智慧控制系統和GPS導航等數位技術的融合進一步增強了這類設備的功能,使其成為現代農業的基石。全球糧食需求的成長,加上以更少的資源生產更多產品的需求,使得投資播種施肥機械成為許多國家的戰略重點。
| 市場範圍 | |
|---|---|
| 起始年份 | 2024 |
| 預測年份 | 2025-2034 |
| 起始值 | 1225億美元 |
| 預測值 | 2029億美元 |
| 複合年成長率 | 5.3% |
2024年,自動化種植和施肥機械市場規模將達到804億美元,位居榜首,預計預測期內複合年成長率將達到5.7%。隨著農場企業採用更精準、容錯率更低的解決方案,這個細分市場將持續受到青睞。自動化機械配備了先進的技術,支援即時決策、變數施肥和基於地理位置的操作。這些特性有助於實現更均勻的種植、最佳化肥料分配並提高作物產量,使自動化成為尋求永續規模化農場的理想選擇。
自動化機械因其能夠減少對勞動力的依賴和營運效率低下而受到農民的青睞。這些系統能夠更好地控制田間狀況,促進智慧投入品的使用,並支援更高水準的作物管理,從而帶來更高的回報和長期成本節約。因此,預計未來幾年該領域將佔據更大的市場佔有率。
以容量計算,2024年,大容量機械佔據最大市場佔有率,達到54%,預計2025年至2034年期間的複合年成長率為5.6%。市場對大容量設備的日益青睞反映了大規模農業經營的持續趨勢,這種經營模式要求更快的執行速度和更高的產量。這些機械旨在在廣闊的土地上高效運行,減少停機時間並最大限度地擴大田間覆蓋範圍。其卓越的設計以及與現代控制系統的整合,使其能夠快速部署並提升田間作業性能,成為尋求實現更高產量目標的商業農場的必備工具。
從區域角度來看,美國在2024年北美市場佔據主導地位,佔據約76%的區域佔有率,創造了258億美元的收入。在基礎設施、科學研究和促進農業創新的政策的支持下,美國國內市場對精準農業的轉型表現出極大的熱情。美國農民正在採用配備即時感測器、GPS追蹤和半自主自主系統的先進機械,這些機械降低了操作的勞動強度,並提高了生產效率。向技術驅動型農業的轉變也有助於生產者最大限度地降低因種子和化肥過量使用而產生的成本,同時滿足環境保護和資源利用方面的監管要求。
全球種植和施肥機械市場的主要參與者正在積極推行併購、合作等策略性舉措,以維持市場領先地位。他們還在研發方面投入巨資,以開發符合不斷變化的客戶需求和技術進步的機械產品。透過擴大產品組合和全球影響力,這些公司正致力於滿足對更聰明、更有效率的農業解決方案日益成長的需求。他們的努力正在推動創新,並提供可擴展的解決方案,以支持全球糧食安全目標。
目錄
第1章:方法論與範圍
第2章:執行摘要
第3章:行業洞察
- 產業生態系統分析
- 供應商格局
- 利潤率
- 每個階段的增值
- 影響價值鏈的因素
- 產業衝擊力
- 成長動力
- 全球糧食需求不斷成長
- 農業機械化
- 產業陷阱與挑戰
- 初始資本投入高
- 環境和監管壓力
- 機會
- 成長動力
- 成長潛力分析
- 未來市場趨勢
- 技術和創新格局
- 當前的技術趨勢
- 新興技術
- 價格趨勢
- 按地區
- 按產品
- 監管格局
- 標準和合規性要求
- 區域監理框架
- 認證標準
- 波特的分析
- PESTEL分析
第4章:競爭格局
- 介紹
- 公司市佔率分析
- 按地區
- 北美洲
- 歐洲
- 亞太地區
- 拉丁美洲
- MEA
- 公司矩陣分析
- 主要市場參與者的競爭分析
- 競爭定位矩陣
- 關鍵進展
- 併購
- 夥伴關係與合作
- 新產品發布
- 擴張計劃
第5章:市場估計與預測:按類型,2021 - 2034 年
- 主要趨勢
- 種植機械
- 廣播播種機
- 氣力播種機
- 種植園主
- 條播機
- 其他(移植者等)
- 施肥機械
- 廣播傳播者
- 撒播機
- 液體噴霧器
- 顆粒施藥器
- 其他(灌溉系統等)
第6章:市場估計與預測:按營運,2021 - 2034 年
- 主要趨勢
- 手動的
- 自動的
第7章:市場估計與預測:依產能,2021 - 2034 年
- 主要趨勢
- 容量低
- 中等容量
- 高容量
第8章:市場估計與預測:依最終用途,2021 - 2034 年
- 主要趨勢
- 家庭農場
- 大型商業農場
第9章:市場估計與預測:按配銷通路,2021 - 2034 年
- 主要趨勢
- 直銷
- 間接銷售
第10章:市場估計與預測:按地區,2021 - 2034 年
- 主要趨勢
- 北美洲
- 美國
- 加拿大
- 歐洲
- 德國
- 英國
- 法國
- 西班牙
- 義大利
- 荷蘭
- 亞太地區
- 中國
- 日本
- 印度
- 澳洲
- 韓國
- 拉丁美洲
- 巴西
- 墨西哥
- 阿根廷
- 中東和非洲
- 南非
- 沙烏地阿拉伯
- 阿拉伯聯合大公國
第 11 章:公司簡介
- AGCO
- Amazon
- CLAAS
- CNH Industrial
- Deutz-Fahr Group
- CNH Industrial
- Kinze Manufacturing
- Kubota
- Kverneland
- Lemken
- Mahindra & Mahindra
- Maschio Gaspardo
- Salford Group
- Vaderstad
- Yanmar
The Global Planting and Fertilizing Machinery Market was valued at USD 122.5 billion in 2024 and is estimated to grow at a CAGR of 5.3% to reach USD 202.9 billion by 2034. This growth is primarily attributed to the ongoing transformation of agricultural practices, as traditional manual methods are increasingly being replaced by modern mechanized systems. In many developing and transitioning economies, rising labor costs and persistent labor shortages are compelling farm operators to shift towards machinery that can perform tasks more efficiently and with greater accuracy. The demand for equipment that can accelerate seeding and fertilization while reducing human input is growing rapidly, driven by the need for timely operations and higher yields.
Mechanization is also playing a vital role in promoting sustainable agricultural practices. Advanced planting and fertilizing machines reduce seed and fertilizer waste through precise application, minimizing environmental impact while improving overall productivity. The appeal of mechanized tools lies not just in labor savings, but in their ability to enhance input efficiency-helping growers produce more using fewer resources. As agriculture becomes increasingly data-driven, stakeholders across the value chain-including manufacturers, farm operators, and policymakers-are showing stronger interest in adopting machinery that supports high-efficiency and precision farming. The integration of digital technologies, such as smart control systems and GPS guidance, is further enhancing the capabilities of this equipment, making it a cornerstone of modern agriculture. Increased global food demand, coupled with the need to produce more with less, is making investment in planting and fertilizing machinery a strategic priority for many countries.
| Market Scope | |
|---|---|
| Start Year | 2024 |
| Forecast Year | 2025-2034 |
| Start Value | $122.5 Billion |
| Forecast Value | $202.9 Billion |
| CAGR | 5.3% |
Within the market, in 2024, automatic planting and fertilizing machinery led the market with a revenue of USD 80.4 billion and is projected to grow at a CAGR of 5.7% over the forecast period. This segment continues to gain traction as farm businesses adopt solutions that offer greater precision and less margin for error. Automatic machines are equipped with advanced technologies that support real-time decision-making, variable-rate application, and geolocation-based operations. These features contribute to more uniform planting, optimized fertilizer distribution, and increased crop yields, making automation an appealing option for farms aiming to scale sustainably.
Farmers are steadily favoring automated machinery due to its ability to reduce labor dependency and operational inefficiencies. These systems allow better control over field conditions, promote smart input use, and support a higher level of crop management, which translates into better returns and long-term cost savings. As a result, this segment is expected to capture even greater market share in the coming years.
Based on capacity, in 2024, high-capacity machinery accounted for the largest share of the market, commanding 54%, and is forecasted to grow at a CAGR of 5.6% between 2025 and 2034. The growing preference for high-capacity equipment reflects the ongoing trend toward large-scale farming operations that demand faster execution and higher throughput. These machines are designed to operate efficiently across vast tracts of land, reducing downtime and maximizing field coverage. Their superior design and integration with modern control systems allow for rapid deployment and enhanced field performance, making them essential tools for commercial farms looking to meet increasing production targets.
From a regional perspective, the United States represented a dominant force in the North American market in 2024, holding approximately 76% of the regional share and generating USD 25.8 billion in revenue. The domestic market has embraced the transition to precision-based agriculture with strong enthusiasm, supported by infrastructure, research, and policy that promote agricultural innovation. Farmers in the U.S. are adopting advanced machinery that features real-time sensors, GPS-enabled tracking, and semi-autonomous autonomous systems that make operations less labor-intensive and more productive. The shift toward technology-driven agriculture is also helping producers minimize costs associated with excess seed and fertilizer usage while meeting regulatory expectations around environmental conservation and resource use.
Key players in the global planting and fertilizing machinery market are actively pursuing strategic initiatives such as mergers, acquisitions, and collaborative ventures to stay ahead of market trends. They are also investing significantly in R&D to develop machinery that aligns with evolving customer needs and technological advancements. By expanding their product portfolios and global reach, these companies are working to meet the growing demand for smarter, more efficient agricultural solutions. Their efforts are helping drive innovation and offer scalable solutions that support global food security objectives.
Table of Contents
Chapter 1 Methodology & Scope
- 1.1 Market scope and definition
- 1.2 Research design
- 1.2.1 Research approach
- 1.2.2 Data collection methods
- 1.3 Data mining sources
- 1.3.1 Global
- 1.3.2 Regional/Country
- 1.4 Base estimates and calculations
- 1.4.1 Base year calculation
- 1.4.2 Key trends for market estimation
- 1.5 Primary research and validation
- 1.5.1 Primary sources
- 1.6 Forecast model
- 1.7 Research assumptions and limitations
Chapter 2 Executive Summary
- 2.1 Industry 3600 synopsis
- 2.2 Key market trends
- 2.2.1 Regional
- 2.2.2 Type
- 2.2.3 Operation
- 2.2.4 Capacity
- 2.2.5 End use
- 2.2.6 Distribution channel
- 2.3 CXO perspectives: Strategic imperatives
- 2.3.1 Key decision points for industry executives
- 2.3.2 Critical success factors for market players
- 2.4 Future outlook and strategic recommendations
Chapter 3 Industry Insights
- 3.1 Industry ecosystem analysis
- 3.1.1 Supplier landscape
- 3.1.2 Profit margin
- 3.1.3 Value addition at each stage
- 3.1.4 Factor affecting the value chain
- 3.2 Industry impact forces
- 3.2.1 Growth drivers
- 3.2.1.1 Rising global food demand
- 3.2.1.2 Mechanization of agriculture
- 3.2.2 Industry pitfalls & challenges
- 3.2.2.1 High initial capital investment
- 3.2.2.2 Environmental and regulatory pressure
- 3.2.3 Opportunities
- 3.2.1 Growth drivers
- 3.3 Growth potential analysis
- 3.4 Future market trends
- 3.5 Technology and innovation landscape
- 3.5.1 Current technological trends
- 3.5.2 Emerging technologies
- 3.6 Price trends
- 3.6.1 By region
- 3.6.2 By product
- 3.7 Regulatory landscape
- 3.7.1 Standards and compliance requirements
- 3.7.2 Regional regulatory frameworks
- 3.7.3 Certification standards
- 3.8 Porter's analysis
- 3.9 PESTEL analysis
Chapter 4 Competitive Landscape, 2024
- 4.1 Introduction
- 4.2 Company market share analysis
- 4.2.1 By region
- 4.2.2 North America
- 4.2.3 Europe
- 4.2.4 Asia Pacific
- 4.2.5 Latin America
- 4.2.6 MEA
- 4.3 Company matrix analysis
- 4.4 Competitive analysis of major market players
- 4.5 Competitive positioning matrix
- 4.6 Key developments
- 4.6.1 Mergers & acquisitions
- 4.6.2 Partnerships & collaborations
- 4.6.3 New product launches
- 4.6.4 Expansion plans
Chapter 5 Market Estimates & Forecast, By Type, 2021 - 2034 ($Billion, Thousand Units)
- 5.1 Key trends
- 5.2 Planting machinery
- 5.2.1 Broadcast seeders
- 5.2.2 Air seeders
- 5.2.3 Planters
- 5.2.4 Drill seeders
- 5.2.5 Others(transplanters, etc.)
- 5.3 Fertilizing machinery
- 5.3.1 Broadcast spreaders
- 5.3.2 Drop spreaders
- 5.3.3 Liquid sprayers
- 5.3.4 Granular applicators
- 5.3.5 Others(fertigation systems, etc.)
Chapter 6 Market Estimates & Forecast, By Operation, 2021 - 2034 ($Billion, Thousand Units)
- 6.1 Key trends
- 6.2 Manual
- 6.3 Automatic
Chapter 7 Market Estimates & Forecast, By Capacity, 2021 - 2034 ($Billion, Thousand Units)
- 7.1 Key trends
- 7.2 Low capacity
- 7.3 Mid capacity
- 7.4 High capacity
Chapter 8 Market Estimates & Forecast, By End Use, 2021 - 2034 ($Billion, Thousand Units)
- 8.1 Key trends
- 8.2 Family-owned farms
- 8.3 Large-scale commercial farms
Chapter 9 Market Estimates & Forecast, By Distribution Channel, 2021 - 2034 ($Billion, Thousand Units)
- 9.1 Key trends
- 9.2 Direct sales
- 9.3 Indirect sales
Chapter 10 Market Estimates & Forecast, By Region, 2021 - 2034 ($Billion, Thousand Units)
- 10.1 Key trends
- 10.2 North America
- 10.2.1 U.S.
- 10.2.2 Canada
- 10.3 Europe
- 10.3.1 Germany
- 10.3.2 UK
- 10.3.3 France
- 10.3.4 Spain
- 10.3.5 Italy
- 10.3.6 Netherlands
- 10.4 Asia Pacific
- 10.4.1 China
- 10.4.2 Japan
- 10.4.3 India
- 10.4.4 Australia
- 10.4.5 South Korea
- 10.5 Latin America
- 10.5.1 Brazil
- 10.5.2 Mexico
- 10.5.3 Argentina
- 10.6 Middle East and Africa
- 10.6.1 South Africa
- 10.6.2 Saudi Arabia
- 10.6.3 UAE
Chapter 11 Company Profiles
- 11.1 AGCO
- 11.2 Amazon
- 11.3 CLAAS
- 11.4 CNH Industrial
- 11.5 Deutz-Fahr Group
- 11.6 CNH Industrial
- 11.7 Kinze Manufacturing
- 11.8 Kubota
- 11.9 Kverneland
- 11.10 Lemken
- 11.11 Mahindra & Mahindra
- 11.12 Maschio Gaspardo
- 11.13 Salford Group
- 11.14 Vaderstad
- 11.15 Yanmar
 自走式蔬菜移植市場:按類型、引擎功率、種植行數、價格範圍、通路、最終用戶和應用分類-2026-2032年全球預測農業植物保護無人機市場:按無人機類型、組件、作物類型、應用、最終用戶分類,全球預測(2026-2032)
 2026年全球播種機市場報告2026年全球施肥機械市場報告2026年全球肥料施用與植物保護設備市場報告
 種植設備市場規模、佔有率和成長分析(按設備類型、動力來源、行類型、最終用途、分銷通路和地區分類)-2026-2033年產業預測蔬菜種植機器人市場(依動力源、商業農場、自主機器人、露天農場、播種和機械臂)——2026-2032年全球預測
 水稻插秧機市場:依產品類型(騎乘式插秧機、步行式插秧機)、驅動方式(自走式、手排式)、容量(4行以下、4-8行)、導航系統與應用領域劃分-全球預測至2035年
 全球作物保護設備市場預測(至2032年):按設備類型、作物類型、動力來源、分銷管道、應用、最終用戶和地區分類種植設備市場按產品類型、播種機制、操作類型、農場規模、行距、動力來源、應用和銷售管道分類-2025-2032 年全球預測