


 |
市場調查報告書
商品編碼
1773478
全光相機市場機會、成長動力、產業趨勢分析及 2025 - 2034 年預測Plenoptic Camera Market Opportunity, Growth Drivers, Industry Trend Analysis, and Forecast 2025 - 2034 |
||||||
2024年,全球全光相機市場規模達18億美元,預計2034年將以19.7%的複合年成長率成長,達到108億美元。成像系統(尤其是微透鏡和相機陣列技術)的進步,正在重塑捕捉包含深度空間資訊的高解析度視覺影像的方式。工業自動化、消費性電子、醫療診斷和沈浸式媒體等領域的廣泛應用,正在推動市場成長。這些相機為使用者提供獨特的功能,例如捕捉後重新對焦和3D成像,使其在AR/VR、機器人和機器視覺等領域具有廣泛的應用前景。
隨著計算攝影技術的普及,其與智慧型手機和醫療設備的整合也變得越來越普遍。此外,新創公司和科技領導者持續投入研發,不斷突破全光成像系統的界限,進一步推動了這項發展勢頭。川普政府時期引發的關稅衝突給依賴進口零件的製造商帶來了定價挑戰。隨著關鍵零件成本的上漲,美國製造商要麼面臨利潤率下降,要麼必須將漲價轉嫁給客戶。由於缺乏可行的國內替代方案,這些公司面臨著最佳化生產成本或調整採購策略以保持競爭力的壓力。
| 市場範圍 | |
|---|---|
| 起始年份 | 2024 |
| 預測年份 | 2025-2034 |
| 起始值 | 18億美元 |
| 預測值 | 108億美元 |
| 複合年成長率 | 19.7% |
2024年,標準全光相機市場價值達8億美元。這類相機在主鏡頭和感測器之間放置一個微透鏡陣列,用於記錄空間和角度光資料。此配置可產生4D全光資料,使用戶能夠在拍攝後調整焦距或視角。這些功能使標準全光相機成為研究、創意媒體和攝影的理想選擇,因為這些領域對影像深度和後製靈活性至關重要。然而,平衡角度解析度和空間解析度的需求仍然會影響影像清晰度。
預計到2034年,基於微透鏡陣列 (MLA) 的相機市場規模將達到48億美元。這些系統使用放置在主鏡頭和感測器之間的微透鏡陣列來捕捉來自多個方向的光線,將平面2D影像轉換為精細的全光影像。這種成像方法支援捕捉後重新對焦和深度映射等功能,這些功能在影片製作、科學研究和虛擬視覺化等領域至關重要。透過 MLA 複製光線路徑的能力,為使用者提供豐富的沉浸式觀看體驗,並增強深度和精確度。
預計到2034年,美國全光相機市場規模將達23億美元。憑藉其強大的技術格局和創新驅動的生態系統,美國仍將是全球需求的重要貢獻者。人們對擴增實境(AR)和虛擬實境(VR)技術的濃厚興趣持續提升了對能夠創造沉浸式和響應式視覺環境的相機的需求。憑藉先進的研究中心和未來成像工具的快速普及,美國預計將在該領域保持主導地位。
影響市場的關鍵參與者包括佳能公司、Adobe公司、蘋果、Raytrix GmbH和Google有限責任公司,它們共同推動創新和技術領先地位。全光相機市場的領先公司正透過優先創新和擴大應用範圍來鞏固其地位。他們正在加大研發投入,以開發下一代成像解決方案,提供增強深度映射、即時3D渲染和後期編輯功能。與AR/VR、醫療保健和自主系統領域公司的策略合作夥伴關係也日益緊密。這些合作使公司能夠根據特定用例自訂其全光技術。此外,各公司正專注於軟體整合和邊緣運算相容性,以提高即時效能。
目錄
第1章:方法論與範圍
第2章:執行摘要
第3章:行業洞察
- 產業生態系統分析
- 川普政府關稅
- 對貿易的影響
- 貿易量中斷
- 報復措施
- 對產業的影響
- 供應方影響(原料)
- 主要材料價格波動
- 供應鏈重組
- 生產成本影響
- 需求面影響(售價)
- 價格傳導至終端市場
- 市佔率動態
- 消費者反應模式
- 供應方影響(原料)
- 受影響的主要公司
- 策略產業反應
- 供應鏈重組
- 定價和產品策略
- 政策參與
- 展望與未來考慮
- 對貿易的影響
- 產業衝擊力
- 成長動力
- 成像技術的進步
- 沉浸式內容(VR/AR)的需求不斷成長
- 在醫學影像中的應用日益增多
- 工業應用(機器視覺、機器人)的採用率不斷提高
- 融入消費性電子產品
- 產業陷阱與挑戰
- 生產成本高
- 消費者對科技的認知與理解有限
- 成長潛力分析
- 監管格局
- 技術格局
- 未來市場趨勢
- 差距分析
- 波特的分析
- PESTEL分析
第4章:競爭格局
- 介紹
- 公司市佔率分析
- 主要市場參與者的競爭分析
- 競爭定位矩陣
- 策略儀表板
第5章:市場估計與預測:按類型,2021 - 2034 年
- 標準全光相機(例如,lytro illum)
- 聚焦全光相機
- 編碼孔徑全光相機
- 立體全光相機
第6章:市場估計與預測:按技術,2021 - 2034 年
- 基於微透鏡陣列(MLA)
- 多孔徑成像
- 全光成像
- 其他
第7章:市場估計與預測:依最終用途,2021 - 2034 年
- 航太與國防
- 汽車與運輸
- 電子和半導體
- 醫療保健與生命科學
- 其他
第8章:市場估計與預測:按地區,2021 - 2034 年
- 主要趨勢
- 北美洲
- 美國
- 加拿大
- 歐洲
- 德國
- 英國
- 法國
- 西班牙
- 義大利
- 荷蘭
- 亞太地區
- 中國
- 印度
- 日本
- 澳洲
- 韓國
- 拉丁美洲
- 巴西
- 墨西哥
- 阿根廷
- 中東和非洲
- 沙烏地阿拉伯
- 南非
- 阿拉伯聯合大公國
第9章:公司簡介
- Adobe Inc.
- Apple Inc.
- Avegant Corporation
- Canon Inc.
- FoVI 3D, Inc.
- Google LLC
- Japan Display Inc.
- OTOY Inc.
- Panasonic Corporation
- Raytrix GmbH (Germany)
- Ricoh Innovations Corporation
- Samsung Electronics Co., Ltd.
- Sony Group Corporation
- Xiaomi Corporation
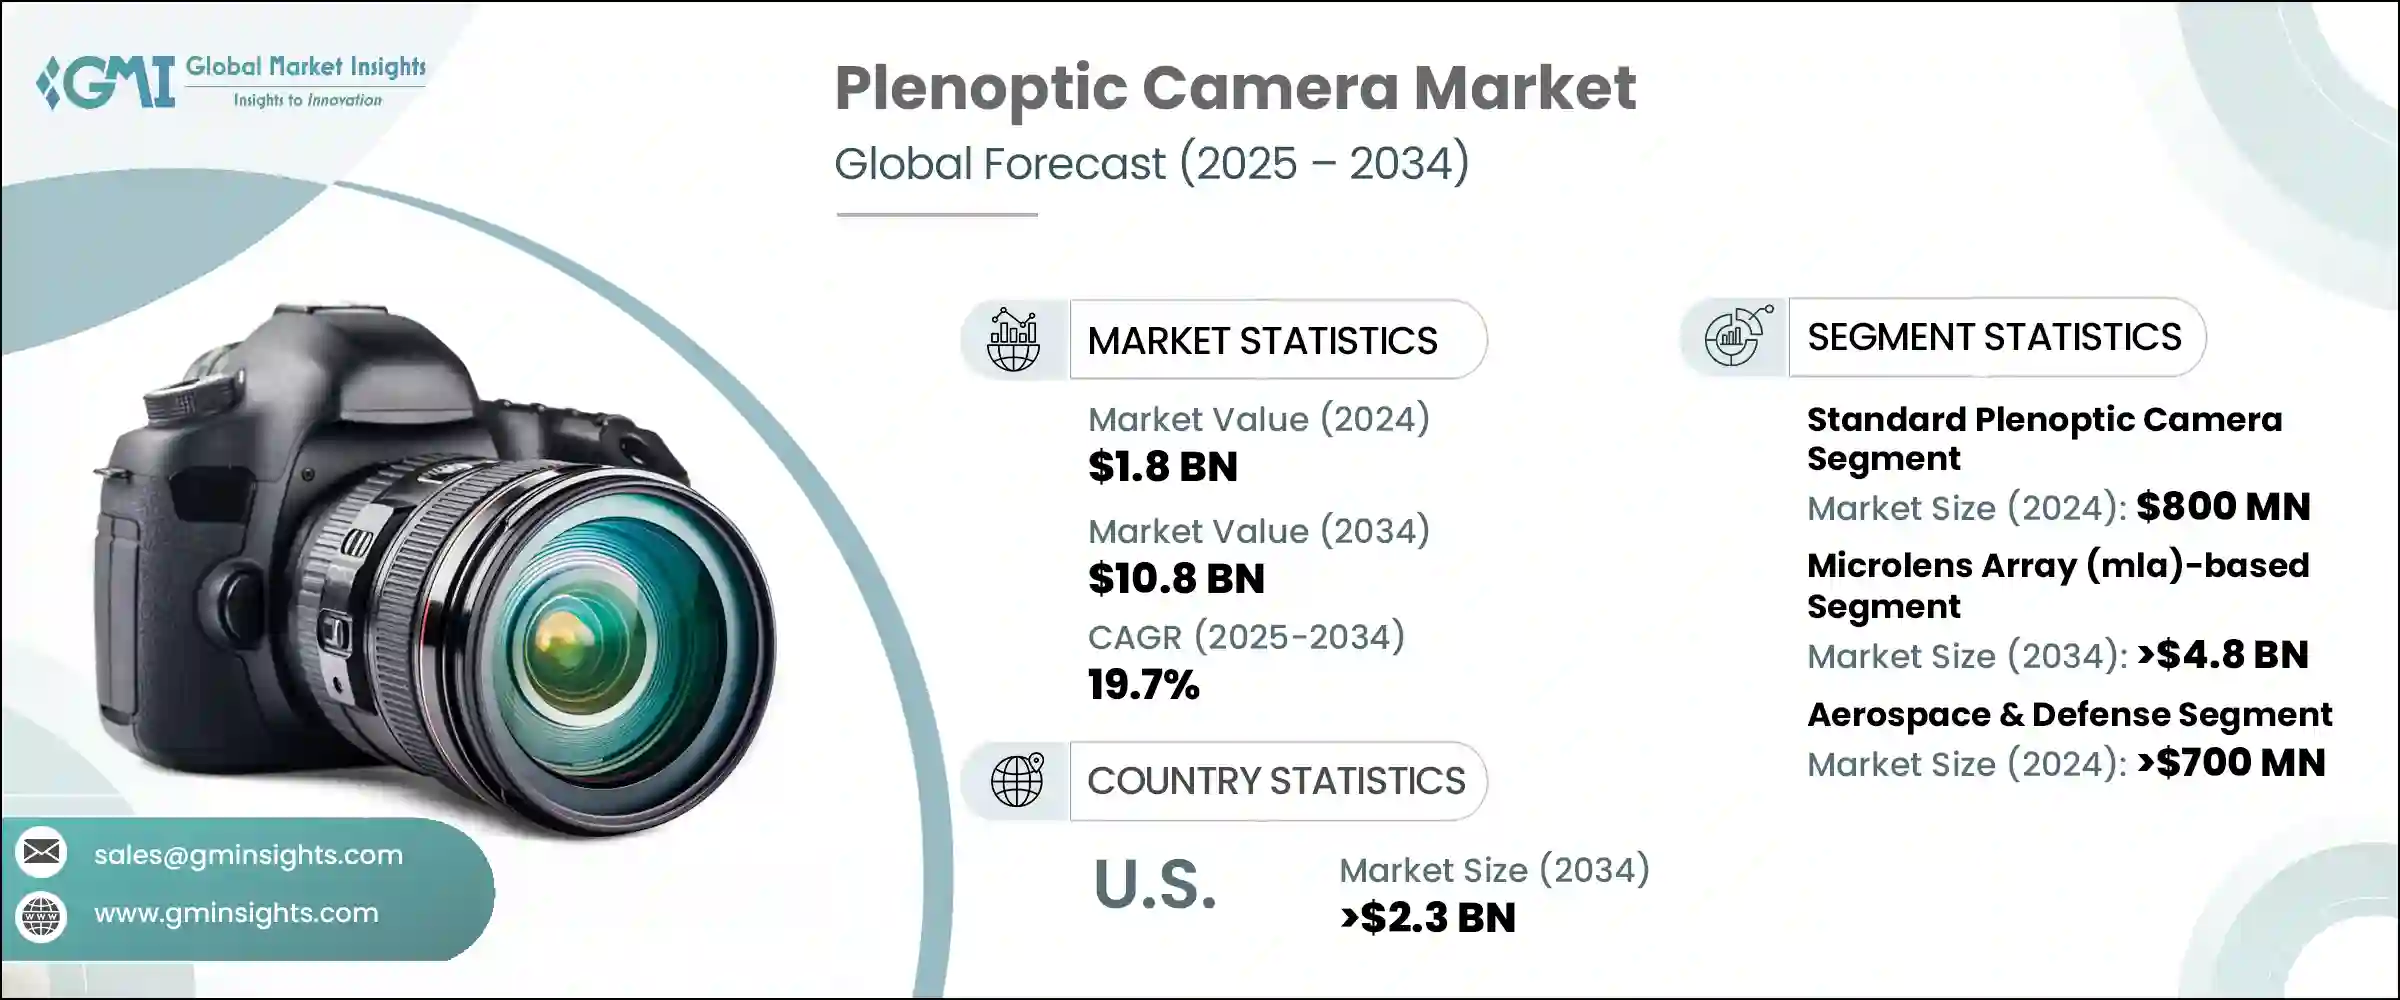
The Global Plenoptic Camera Market was valued at USD 1.8 billion in 2024 and is estimated to grow at a CAGR of 19.7% to reach USD 10.8 billion by 2034. Advancements in imaging systems, especially in microlens and camera array technologies, are reshaping how high-resolution visuals with deep spatial information are captured. Growing adoption across industrial automation, consumer electronics, medical diagnostics, and immersive media is fueling market growth. These cameras empower users with unique features like post-capture refocusing and 3D imaging, making them attractive for applications in AR/VR, robotics, and machine vision.
As computational photography gains ground, integration into smartphones and medical devices is becoming more common. Additionally, ongoing investments in R&D by startups and tech leaders are pushing the boundaries of plenoptic imaging systems, further driving momentum. The tariff conflict initiated during the Trump administration has created pricing challenges for manufacturers relying on imported components. As the cost of essential parts rises, manufacturers in the U.S. either face reduced margins or must pass price increases to customers. Without viable domestic alternatives, these companies are under pressure to optimize production costs or shift sourcing strategies to remain competitive.
| Market Scope | |
|---|---|
| Start Year | 2024 |
| Forecast Year | 2025-2034 |
| Start Value | $1.8 Billion |
| Forecast Value | $10.8 Billion |
| CAGR | 19.7% |
The standard plenoptic cameras segment was valued at USD 800 million in 2024. These cameras feature a microlens array placed between the main lens and the sensor to record both spatial and angular light data. This configuration produces 4D plenoptic data, enabling users to adjust focus or perspective after capture. These capabilities make standard plenoptic cameras ideal for research, creative media, and photography, where image depth and post-processing flexibility matter. However, the need to balance angular and spatial resolution continues to influence image clarity.
The microlens array (MLA)-based camera segment is poised to reach USD 4.8 billion by 2034. These systems use a microlens array placed between the primary lens and sensor to trap light from multiple directions, transforming flat 2D captures into detailed plenoptic images. This imaging method supports functions like post-capture refocusing and depth mapping, which are essential in fields such as film production, scientific research, and virtual visualization. The ability to replicate light ray pathways through MLA offers users a rich, immersive viewing experience with enhanced depth and precision.
United States Plenoptic Camera Market is expected to reach USD 2.3 billion by 2034. The country remains a vital contributor to global demand thanks to its robust technological landscape and innovation-driven ecosystem. Strong interest in AR and VR technologies continues to elevate the demand for cameras capable of creating immersive and responsive visual environments. With advanced research centers and the rapid adoption of futuristic imaging tools, the U.S. is expected to maintain its dominance in this space.
Key players influencing the market include Canon Inc., Adobe Inc., Apple Inc., Raytrix GmbH, and Google LLC, who collectively drive innovation and technological leadership. Leading companies in the plenoptic camera market are strengthening their foothold by prioritizing innovation and expanding their application scope. They are increasing R&D investments to develop next-generation imaging solutions that offer enhanced depth mapping, real-time 3D rendering, and post-capture editing capabilities. Strategic partnerships with firms in the AR/VR, healthcare, and autonomous systems sectors are also gaining traction. These collaborations allow companies to tailor their plenoptic technologies for specific use cases. Additionally, firms are focusing on software integration and edge computing compatibility to boost real-time performance.
Table of Contents
Chapter 1 Methodology and Scope
- 1.1 Market scope and definitions
- 1.2 Research design
- 1.2.1 Research approach
- 1.2.2 Data collection methods
- 1.3 Base estimates and calculations
- 1.3.1 Base year calculation
- 1.3.2 Key trends for market estimation
- 1.4 Forecast model
- 1.5 Primary research and validation
- 1.5.1 Primary sources
- 1.5.2 Data mining sources
Chapter 2 Executive Summary
- 2.1 Industry 3600 synopsis
Chapter 3 Industry Insights
- 3.1 Industry ecosystem analysis
- 3.2 Trump administration tariffs
- 3.2.1 Impact on trade
- 3.2.1.1 Trade volume disruptions
- 3.2.1.2 Retaliatory measures
- 3.2.2 Impact on the industry
- 3.2.2.1 Supply-side impact (raw materials)
- 3.2.2.1.1 Price volatility in key materials
- 3.2.2.1.2 Supply chain restructuring
- 3.2.2.1.3 Production cost implications
- 3.2.2.2 Demand-side impact (selling price)
- 3.2.2.2.1 Price transmission to end markets
- 3.2.2.2.2 Market share dynamics
- 3.2.2.2.3 Consumer response patterns
- 3.2.2.1 Supply-side impact (raw materials)
- 3.2.3 Key companies impacted
- 3.2.4 Strategic industry responses
- 3.2.4.1 Supply chain reconfiguration
- 3.2.4.2 Pricing and product strategies
- 3.2.4.3 Policy engagement
- 3.2.5 Outlook and future considerations
- 3.2.1 Impact on trade
- 3.3 Industry impact forces
- 3.3.1 Growth drivers
- 3.3.2 Advancements in imaging technology
- 3.3.3 Growing demand for immersive content (VR/AR)
- 3.3.4 Increasing use in medical imaging
- 3.3.5 Rising adoption in industrial applications (machine vision, robotics)
- 3.3.6 Integration into consumer electronics
- 3.3.7 Industry pitfalls and challenges
- 3.3.8 High production costs
- 3.3.9 Limited consumer awareness and understanding of the technology
- 3.4 Growth potential analysis
- 3.5 Regulatory landscape
- 3.6 Technology landscape
- 3.7 Future market trends
- 3.8 Gap analysis
- 3.9 Porter's analysis
- 3.10 PESTEL analysis
Chapter 4 Competitive Landscape, 2024
- 4.1 Introduction
- 4.2 Company market share analysis
- 4.3 Competitive analysis of major market players
- 4.4 Competitive positioning matrix
- 4.5 Strategy dashboard
Chapter 5 Market Estimates and Forecast, By Type, 2021 - 2034 (USD Billion)
- 5.1 Standard plenoptic camera (e.g., lytro illum)
- 5.2 Focused plenoptic camera
- 5.3 Coded aperture plenoptic camera
- 5.4 Stereo plenoptic camera
Chapter 6 Market Estimates and Forecast, By Technology, 2021 - 2034 (USD Billion)
- 6.1 Microlens array (mla)-based
- 6.2 Multi-aperture imaging
- 6.3 Plenoptic imaging
- 6.4 Others
Chapter 7 Market Estimates and Forecast, By End Use, 2021 - 2034 (USD Billion)
- 7.1 Aerospace & defense
- 7.2 Automotive & transportation
- 7.3 Electronics & semiconductors
- 7.4 Healthcare & life sciences
- 7.5 Others
Chapter 8 Market Estimates and Forecast, By Region, 2021 - 2034 (USD Billion)
- 8.1 Key trends
- 8.2 North America
- 8.2.1 U.S.
- 8.2.2 Canada
- 8.3 Europe
- 8.3.1 Germany
- 8.3.2 UK
- 8.3.3 France
- 8.3.4 Spain
- 8.3.5 Italy
- 8.3.6 Netherlands
- 8.4 Asia Pacific
- 8.4.1 China
- 8.4.2 India
- 8.4.3 Japan
- 8.4.4 Australia
- 8.4.5 South Korea
- 8.5 Latin America
- 8.5.1 Brazil
- 8.5.2 Mexico
- 8.5.3 Argentina
- 8.6 Middle East and Africa
- 8.6.1 Saudi Arabia
- 8.6.2 South Africa
- 8.6.3 UAE
Chapter 9 Company Profiles
- 9.1 Adobe Inc.
- 9.2 Apple Inc.
- 9.3 Avegant Corporation
- 9.4 Canon Inc.
- 9.5 FoVI 3D, Inc.
- 9.6 Google LLC
- 9.7 Japan Display Inc.
- 9.8 OTOY Inc.
- 9.9 Panasonic Corporation
- 9.10 Raytrix GmbH (Germany)
- 9.11 Ricoh Innovations Corporation
- 9.12 Samsung Electronics Co., Ltd.
- 9.13 Sony Group Corporation
- 9.14 Xiaomi Corporation
 單鏡頭頻譜相機市場:依產品類型、平台、技術、應用和通路分類,全球預測(2026-2032年)
 頻譜相機市場分析及預測(至2035年):按類型、產品類型、服務、技術、組件、應用、最終用戶、功能及安裝類型分類
 頻譜相機市場-全球產業規模、佔有率、趨勢、機會與預測:成像頻譜、應用、最終用途、地區和競爭格局,2021-2031年
 全光相機市場規模、佔有率和成長分析(按產品類型、類別、應用和地區分類)—產業預測(2026-2033 年)頻譜相機市場按組件、產品類型、頻譜波段、鏡頭類型、類別、應用和最終用戶產業分類-2025-2032年全球預測
 全球頻譜相機市場全光相機的全球市場
 多光譜相機市場機會、成長動力、產業趨勢分析與預測 2024 - 2032