


 |
市場調查報告書
商品編碼
1773457
太陽能封裝市場機會、成長動力、產業趨勢分析及 2025 - 2034 年預測Solar Encapsulation Market Opportunity, Growth Drivers, Industry Trend Analysis, and Forecast 2025 - 2034 |
||||||
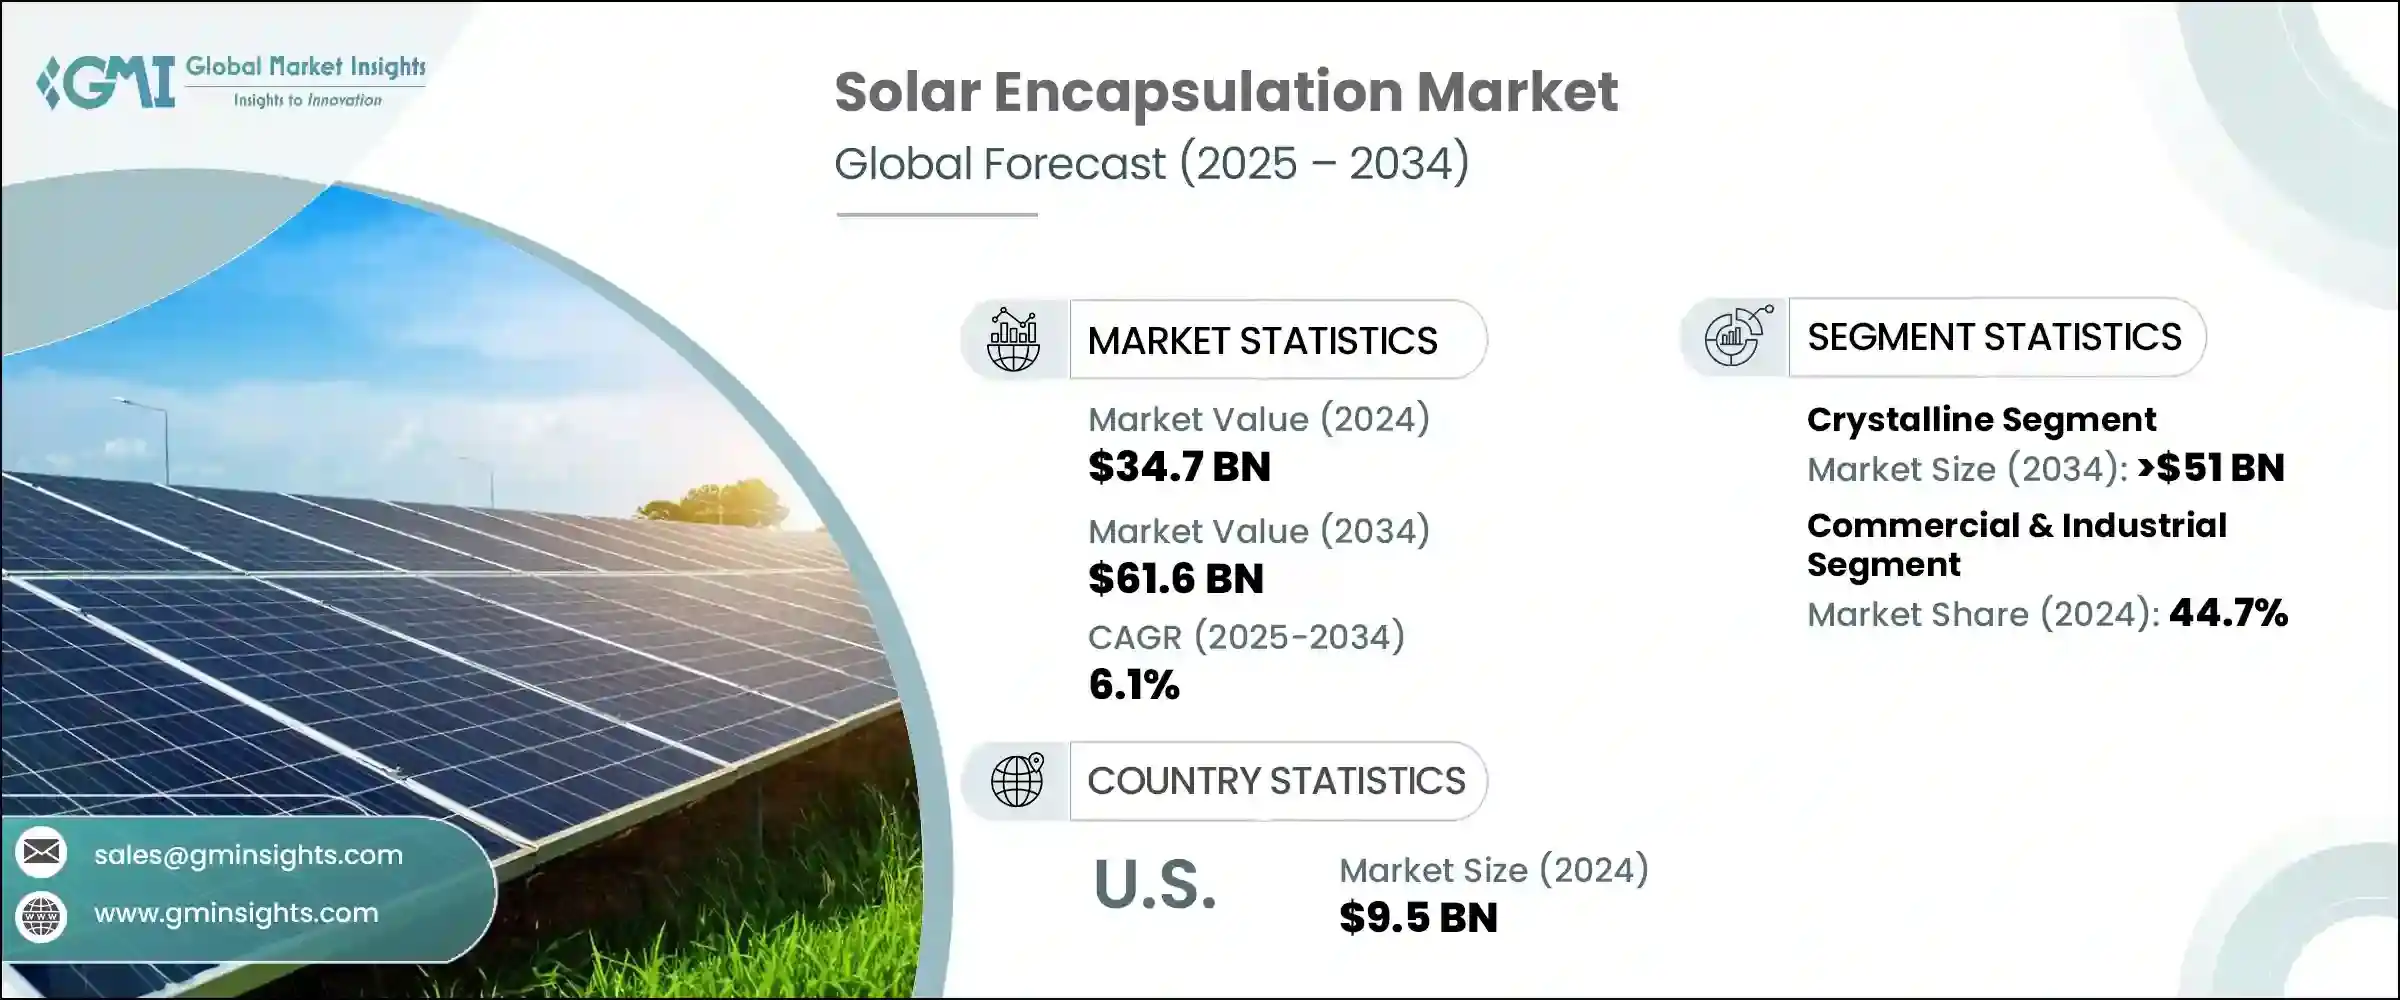
2024年,全球太陽能封裝市場規模達347億美元,預計到2034年將以6.1%的複合年成長率成長,達到616億美元。這一上升趨勢主要得益於全球轉向國內太陽能製造,以及政府利好政策的支持。世界各國紛紛推出激勵機制,以減少對進口光電模組的依賴,進而促進封裝材料等關鍵材料的本地生產。這些材料在保護太陽能電池免受環境影響、延長電池板壽命和提高整體性能方面發揮著至關重要的作用。隨著太陽能在住宅、商業和公用事業規模項目中的應用持續成長,無論是成熟經濟體還是新興太陽能經濟體,對可靠、高品質封裝材料的需求都日益重要。
製造商正在擴大生產規模以滿足激增的需求,尤其是在太陽能電池組件生產快速擴張的市場。已開發國家和發展中國家都在大力投資基礎設施,以支持太陽能電池組件的本地生產,並專注於供應鏈的精簡。這種轉變正推動封裝材料消費的大幅成長,而封裝材料是確保組件長期效率和耐用性的關鍵。越來越多的垂直整合太陽能公司需要可靠的封裝材料供應以實現大規模生產,這進一步強化了這一趨勢。隨著這些公司鞏固對價值鏈(包括原料採購和組件組裝)的控制,它們對穩定一致的封裝材料供應的需求預計將成長,從而對未來幾年的市場動態產生積極影響。
| 市場範圍 | |
|---|---|
| 起始年份 | 2024 |
| 預測年份 | 2025-2034 |
| 起始值 | 347億美元 |
| 預測值 | 616億美元 |
| 複合年成長率 | 6.1% |
預計到2034年,晶體矽太陽能板市場將創造超過510億美元的收入。由於其成本效益高且與標準封裝技術相容,這些電池板將繼續佔據市場主導地位。晶體矽組件通常與EVA基封裝材料搭配使用,這種封裝材料以實惠的價格提供充足的紫外線防護和耐熱性。由於其結構相對簡單,且在各種太陽能應用中被廣泛採用,使其成為傳統層壓材料的理想選擇,從而進一步支持封裝材料市場的成長。
在應用領域,商業和工業領域在2024年佔據了全球太陽能封裝市場佔有率的44.7%。該領域的突出表現得益於高性能太陽能組件的日益普及,尤其是在大規模安裝中。這些專案通常需要先進的封裝系統,能夠承受惡劣的工作條件,並保持卓越的長期效率。由於商業太陽能裝置面臨嚴格的性能標準,對能夠提供更高可靠性、熱控制和抗分解性能的創新封裝材料的需求日益成長。
從區域來看,北美市場在2024年佔了29.8%的佔有率,其中美國佔據主導地位。美國太陽能封裝市場的價值在2022年為47億美元,2023年為76億美元,2024年為95億美元。支持這一成長的關鍵因素是聯邦政府致力於發展強大的國內太陽能供應鏈,並特別重視封裝材料製造。旨在加強基於矽基和薄膜技術的太陽能組件生產的國家舉措正在促進高性能封裝材料的更廣泛應用。預計這些發展將為封裝材料領域的老牌企業和新進業者創造強大的市場機會。
該領域的主要公司正在運用多種策略來鞏固其市場地位。他們正在擴大產能,投資EVA和POE薄膜的內部生產,並與頂級太陽能模組生產商建立牢固的合作夥伴關係。許多公司也專注於針對區域市場客製化產品,與聚合物供應商進行後向整合,並加強研發力度,以提高材料的耐久性和抗紫外線性能。這有助於確保其封裝材料符合不斷變化的性能標準,同時保持成本競爭力。
領先的封裝材料生產商也注重材料特性的創新,例如透明度和抗PID(電致變性)性能,以提高組件效率。同時,他們正在建造本地化製造中心,以改善物流並縮短交貨時間。與垂直整合的組件製造商簽訂的策略協議正在幫助這些公司提升市場佔有率並增強供應鏈穩定性。他們的努力也擴展到擴大薄膜擠出能力、最佳化層壓技術,並確保符合IEC和BIS等國際認證標準,所有這些都有助於在全球太陽能封裝領域保持長期競爭力。
目錄
第1章:方法論與範圍
第2章:執行摘要
第3章:行業洞察
- 產業生態系統
- 監管格局
- 產業衝擊力
- 成長動力
- 產業陷阱與挑戰
- 成長潛力分析
- 波特的分析
- PESTEL分析
第4章:競爭格局
- 介紹
- 公司市佔率分析
- 戰略儀表板
- 策略舉措
- 競爭基準測試
- 創新與技術格局
第5章:市場規模及預測:依面板類型,2021 - 2034
- 主要趨勢
- 結晶
- 薄膜
- 其他
第6章:市場規模及預測:依材料類型,2021 - 2034
- 主要趨勢
- 乙烯-醋酸乙烯酯
- 聚醚醚酮
- 珍珠棉
第7章:市場規模及預測:依應用,2021 - 2034
- 主要趨勢
- 住宅
- 商業和工業
- 公用事業
第8章:市場規模及預測:依最終用途,2021 - 2034
- 主要趨勢
- 建造
- 電子產品
- 其他
第9章:市場規模及預測:按地區,2021 - 2034
- 主要趨勢
- 北美洲
- 美國
- 加拿大
- 墨西哥
- 歐洲
- 奧地利
- 丹麥
- 芬蘭
- 法國
- 德國
- 義大利
- 亞太地區
- 中國
- 澳洲
- 印度
- 日本
- 韓國
- 新加坡
- 中東和非洲
- 以色列
- 沙烏地阿拉伯
- 阿拉伯聯合大公國
- 約旦
- 阿曼
- 拉丁美洲
- 巴西
- 智利
- 阿根廷
- 秘魯
第10章:公司簡介
- 3M
- Al Technology
- Celanese
- Dow Corning
- DuPont
- Eastman
- First Solar
- Hangzhou First PV Material
- Momentive
- Mitsubishi Chemicals
- RenewSys India
- STR Holdings
- Trosifol
The Global Solar Encapsulation Market was valued at USD 34.7 billion in 2024 and is estimated to grow at a CAGR of 6.1% to reach USD 61.6 billion by 2034. This upward trend is largely driven by the global pivot toward domestic solar manufacturing, supported by favorable government policies. Countries across the globe are introducing incentive-based frameworks to reduce dependency on imported photovoltaic components, thereby bolstering local production of critical materials such as encapsulants. These materials play a vital role in safeguarding solar cells from environmental exposure, prolonging panel life, and enhancing overall performance. As solar adoption continues to gain ground in residential, commercial, and utility-scale projects, the need for reliable, high-quality encapsulation materials is becoming increasingly essential across both established and emerging solar economies.
Manufacturers are scaling up their operations to meet the surging demand, particularly in markets where solar module production is expanding rapidly. Both developed and developing countries are investing heavily in infrastructure that supports the local manufacturing of solar modules, with a strong focus on streamlining the supply chain. This shift is encouraging significant growth in the consumption of encapsulation materials, which are key to ensuring long-term module efficiency and durability. The trend is further reinforced by the growing number of vertically integrated solar companies that require dependable access to encapsulants for large-scale production. As these companies consolidate control over the value chain, including raw material sourcing and module assembly, their demand for stable and consistent encapsulation supply is expected to grow, positively influencing market dynamics over the coming years.
| Market Scope | |
|---|---|
| Start Year | 2024 |
| Forecast Year | 2025-2034 |
| Start Value | $34.7 Billion |
| Forecast Value | $61.6 Billion |
| CAGR | 6.1% |
The crystalline panel segment is anticipated to generate over USD 51 billion in revenue by 2034. These panels continue to dominate the market due to their cost-effectiveness and compatibility with standard encapsulation techniques. Crystalline modules are commonly paired with EVA-based encapsulants, which offer adequate UV protection and thermal resistance at affordable rates. Their relatively simple structure and mainstream adoption across various solar applications make them an ideal fit for conventional lamination materials, further supporting encapsulant market growth.
Within the application landscape, the commercial and industrial sector accounted for 44.7% of the global solar encapsulation market share in 2024. The segment's prominence is attributed to the rising deployment of high-performance solar modules, particularly in large-scale installations. These projects often require advanced encapsulation systems capable of withstanding harsh operating conditions while delivering superior efficiency over time. As commercial solar installations face rigorous performance standards, demand is growing for innovative encapsulants that offer enhanced reliability, thermal control, and resistance to degradation.
In regional terms, the North American market held a 29.8% share in 2024, with the U.S. playing a dominant role. The solar encapsulation market in the United States was valued at USD 4.7 billion in 2022, USD 7.6 billion in 2023, and USD 9.5 billion in 2024. A key factor supporting this growth is the federal commitment to developing a robust domestic solar supply chain, with specific emphasis on encapsulant manufacturing. National initiatives aimed at strengthening the production of solar components across both silicon-based and thin-film technologies are contributing to the broader adoption of high-performance encapsulation materials. These developments are expected to create strong market opportunities for both established players and new entrants in the encapsulant space.
Major companies operating in this sector are leveraging a combination of strategies to secure their market position. They are expanding their production capacities, investing in in-house manufacturing of EVA and POE films, and forming strong partnerships with top-tier solar module producers. Many are also focusing on tailoring products for regional markets, integrating backward with polymer suppliers, and intensifying their research and development efforts to improve material durability and UV resistance. This helps ensure their encapsulants meet evolving performance standards while remaining cost-competitive.
Leading encapsulant producers are also prioritizing innovation in material properties such as transparency and PID resistance to enhance module efficiency. At the same time, they are building localized manufacturing hubs to improve logistics and reduce lead times. Strategic agreements with vertically integrated module manufacturers are helping these companies boost their market presence and improve supply chain stability. Their efforts also extend to scaling up film extrusion capabilities, optimizing lamination technologies, and ensuring compliance with international certification standards such as IEC and BIS, all of which are instrumental in maintaining long-term competitiveness in the global solar encapsulation landscape.
Table of Contents
Chapter 1 Methodology & Scope
- 1.1 Research design
- 1.2 Base estimates & calculations
- 1.3 Forecast calculation
- 1.4 Primary research & validation
- 1.4.1 Primary sources
- 1.4.2 Data mining sources
- 1.5 Market definitions
Chapter 2 Executive Summary
- 2.1 Industry synopsis, 2021 - 2034
Chapter 3 Industry Insights
- 3.1 Industry ecosystem
- 3.2 Regulatory landscape
- 3.3 Industry impact forces
- 3.3.1 Growth drivers
- 3.3.2 Industry pitfalls & challenges
- 3.4 Growth potential analysis
- 3.5 Porter's analysis
- 3.5.1 Bargaining power of suppliers
- 3.5.2 Bargaining power of buyers
- 3.5.3 Threat of new entrants
- 3.5.4 Threat of substitutes
- 3.6 PESTEL analysis
Chapter 4 Competitive landscape, 2025
- 4.1 Introduction
- 4.2 Company market share analysis, 2024
- 4.3 Strategic dashboard
- 4.4 Strategic initiatives
- 4.5 Competitive benchmarking
- 4.6 Innovation & technology landscape
Chapter 5 Market Size and Forecast, By Panel Type, 2021 - 2034 (USD Billion)
- 5.1 Key trends
- 5.2 Crystalline
- 5.3 Thin Film
- 5.4 Others
Chapter 6 Market Size and Forecast, By Material Type, 2021 - 2034 (USD Billion)
- 6.1 Key trends
- 6.2 EVA
- 6.3 POE
- 6.4 EPE
Chapter 7 Market Size and Forecast, By Application, 2021 - 2034 (USD Billion)
- 7.1 Key trends
- 7.2 Residential
- 7.3 Commercial & industrial
- 7.4 Utility
Chapter 8 Market Size and Forecast, By End Use, 2021 - 2034 (USD Billion)
- 8.1 Key trends
- 8.2 Construction
- 8.3 Electronics
- 8.4 Others
Chapter 9 Market Size and Forecast, By Region, 2021 - 2034 (USD Million & MT)
- 9.1 Key trends
- 9.2 North America
- 9.2.1 U.S.
- 9.2.2 Canada
- 9.2.3 Mexico
- 9.3 Europe
- 9.3.1 Austria
- 9.3.2 Denmark
- 9.3.3 Finland
- 9.3.4 France
- 9.3.5 Germany
- 9.3.6 Italy
- 9.4 Asia Pacific
- 9.4.1 China
- 9.4.2 Australia
- 9.4.3 India
- 9.4.4 Japan
- 9.4.5 South Korea
- 9.4.6 Singapore
- 9.5 Middle East and Africa
- 9.5.1 Israel
- 9.5.2 Saudi Arabia
- 9.5.3 UAE
- 9.5.4 Jordan
- 9.5.5 Oman
- 9.6 Latin America
- 9.6.1 Brazil
- 9.6.2 Chile
- 9.6.3 Argentina
- 9.6.4 Peru
Chapter 10 Company Profiles
- 10.1 3M
- 10.2 Al Technology
- 10.3 Celanese
- 10.4 Dow Corning
- 10.5 DuPont
- 10.6 Eastman
- 10.7 First Solar
- 10.8 Hangzhou First PV Material
- 10.9 Momentive
- 10.10 Mitsubishi Chemicals
- 10.11 RenewSys India
- 10.12 STR Holdings
- 10.13 Trosifol
 太陽能纖維素封裝市場:按材料、技術、安裝類型、透明度、封裝方法、應用和最終用戶分類-2026-2032年全球市場預測太陽能電池封裝市場:按材料類型、技術、最終用途和應用分類-2026-2032年全球市場預測建築用太陽能封裝市場:依材料類型、製程、最終用途、應用類型和分銷管道分類-全球預測,2026-2032年
 2026年全球太陽能封裝市場報告
 太陽能電池封裝市場規模、佔有率和成長分析(按材料、技術、應用和地區分類)—2026-2033年產業預測
 太陽能電池封裝:全球市場佔有率和排名、總收入和需求預測(2025-2031 年)
 美國光伏封裝封裝市場規模、佔有率及趨勢分析報告:2025-2033年材料、技術、應用及細分市場預測太陽能電池封裝市場規模、佔有率及趨勢分析報告:依材料、技術、應用、地區及細分市場預測,2025-2033年
 太陽能電池封裝材的全球市場的評估:類別,面板類別,各用途,各地區,機會,預測(2018年~2032年)太陽能電池封裝材的印度市場評估:類別,各面板類型,各用途,各地區,機會,預測(2019年度~2033年度)