

 |
市場調查報告書
商品編碼
1773429
相量測量單元市場機會、成長動力、產業趨勢分析及 2025 - 2034 年預測Phasor Measurement Unit Market Opportunity, Growth Drivers, Industry Trend Analysis, and Forecast 2025 - 2034 |
||||||
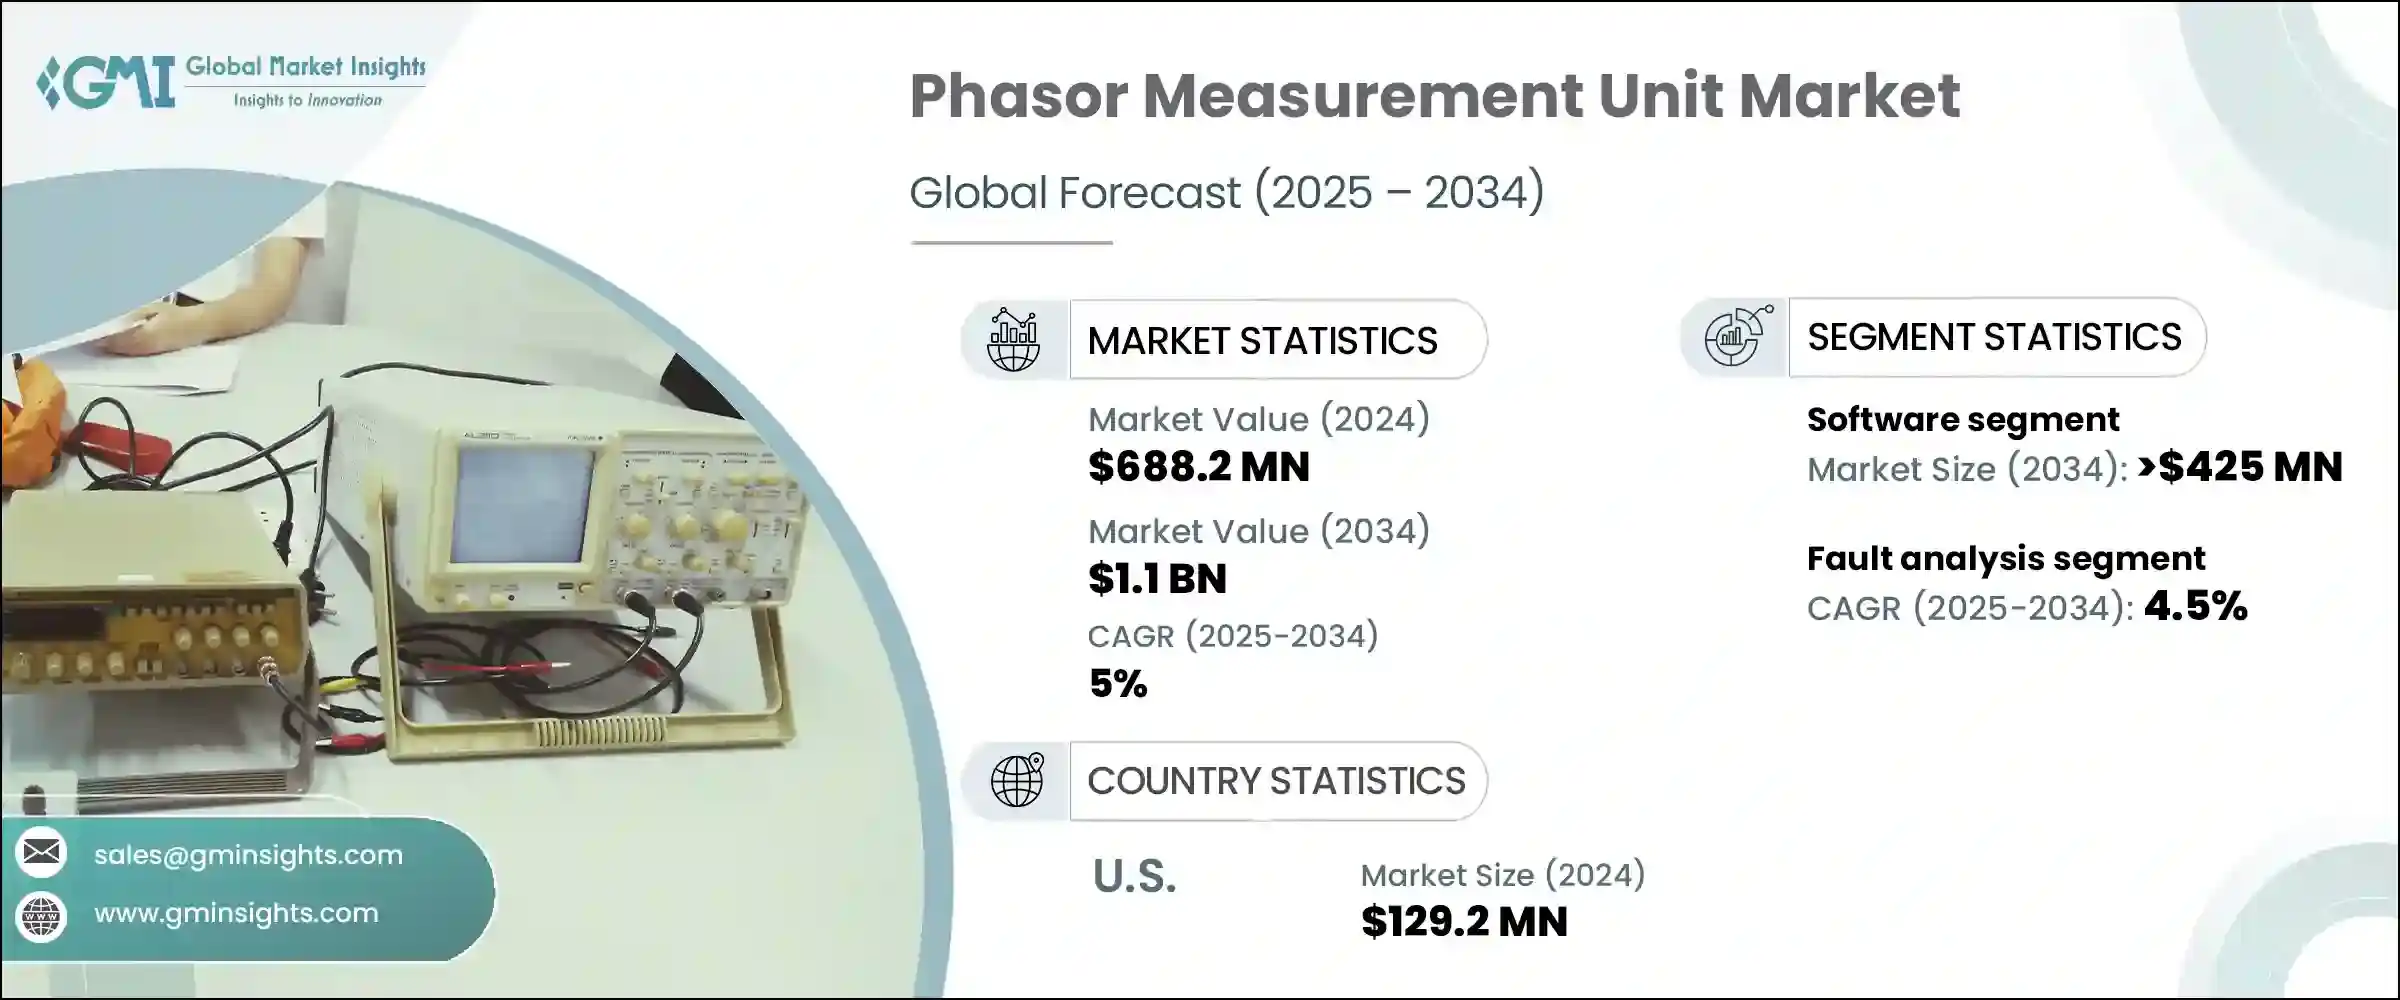
2024年,全球相量測量單元(PMU)市場規模達6.882億美元,預計2034年將以5%的複合年成長率成長,達到11億美元。全球對更智慧、更穩健電網的需求日益成長,這些電網能夠應對再生能源和老化基礎設施整合帶來的挑戰,推動了這一成長。全球公用事業公司正將PMU作為實現即時電網視覺性、更快故障偵測和改善動態電網控制的關鍵解決方案。在支持性監管框架和注重可靠性和彈性的長期能源策略的推動下,這些先進設備正成為輸配電網路現代化建設中不可或缺的一部分。
隨著電網日益分散和複雜化,PMU 的使用正在加速,尤其是在能源需求持續成長的新興市場。技術創新使 PMU 更加高效、可擴展且價格更實惠。測量精度、資料處理和通訊技術性能的提升,使公用事業公司能夠透過先進的分析和智慧電網管理系統,實現預測性維護和更精準的電網預測。這些系統的演進在擴大 PMU 在已開發地區和發展中地區的全球應用方面發揮著重要作用。
| 市場範圍 | |
|---|---|
| 起始年份 | 2024 |
| 預測年份 | 2025-2034 |
| 起始值 | 6.882億美元 |
| 預測值 | 11億美元 |
| 複合年成長率 | 5% |
預計到2034年,相量測量單元市場的軟體部分將創造4.25億美元的產值,其成長主要得益於尖端資料科學工具與人工智慧模型的整合。這些工具使公用事業公司能夠更有效率地執行即時故障檢測、主動電網監控和基於狀態的維護策略。改進的軟體平台能夠更深入地洞察營運資料,幫助公用事業公司做出明智的決策,從而提升整體電網效能。
同時,預計到2034年,狀態估計應用領域將創造2.77億美元的市場規模。隨著再生能源、分散式能源系統和數位技術的日益融合,電網正變得越來越複雜。這種複雜性增加了系統異常的可能性,因此準確、持續的狀態估計對於維護系統可靠性和預防故障至關重要。
2024年,美國相量測量單元(PMU)市場規模達1.292億美元。這一成長得益於對智慧電網技術的持續投資、電網基礎設施的升級以及對先進即時測量系統日益成長的需求。隨著美國持續推動清潔能源轉型,PMU在實現更具彈性和適應性的電網運作方面發揮關鍵作用。
為全球相量測量單元市場競爭格局做出貢獻的主要參與者包括西門子、Powerside、STER (Studio Elektronike Rijeka) Ltd.、電力集團、GE Vernova、Valiant Communications、施耐德電氣、Schweitzer Engineering Laboratories, Inc.、日立、Qualitrol Corp 和 Arbiter Systems。相量測量單元市場中的公司為加強其影響力而採取的關鍵策略包括高度重視創新和協作。領先的公司正在投資研發,以提高 PMU 精度、成本效率以及與下一代電網系統的整合。該公司還與公用事業和技術公司結成策略聯盟,以開發可擴展的軟體平台和智慧電網解決方案。許多公司正在透過合作和收購來擴大其地理覆蓋範圍,尤其是在快速發展的市場。
目錄
第1章:方法論與範圍
第2章:執行摘要
第3章:行業洞察
- 產業生態系統分析
- 監管格局
- 產業衝擊力
- 成長動力
- 產業陷阱與挑戰
- 成長潛力分析
- 波特的分析
- PESTEL分析
第4章:競爭格局
- 戰略儀表板
- 創新與永續發展格局
第5章:市場規模及預測:依組件分類,2021 - 2034 年
- 主要趨勢
- 硬體
- 軟體
第6章:市場規模及預測:依應用,2021 - 2034
- 主要趨勢
- 故障分析
- 狀態估計
- 穩定性監測
- 電力系統控制
- 營運監控
- 網格視覺化
- 其他
第7章:市場規模及預測:依地區,2021 - 2034
- 主要趨勢
- 北美洲
- 美國
- 加拿大
- 墨西哥
- 歐洲
- 英國
- 法國
- 德國
- 義大利
- 俄羅斯
- 西班牙
- 亞太地區
- 中國
- 澳洲
- 印度
- 日本
- 韓國
- 中東和非洲
- 沙烏地阿拉伯
- 阿拉伯聯合大公國
- 土耳其
- 南非
- 埃及
- 拉丁美洲
- 巴西
- 阿根廷
第8章:公司簡介
- Arbiter Systems
- Electric Power Group
- GE Vernova
- Hitachi
- Powerside
- Qualitrol Corp
- Schneider Electric
- Schweitzer Engineering Laboratories, Inc.
- Siemens
- STER (Studio Elektronike Rijeka) Ltd.
- Valiant Communications
The Global Phasor Measurement Unit Market was valued at USD 688.2 million in 2024 and is estimated to grow at a CAGR of 5% to reach USD 1.1 billion by 2034. This growth is fueled by the increasing global demand for smarter, more robust power grids that can withstand the challenges posed by the integration of renewable energy and aging infrastructure. Utilities worldwide are turning to PMUs as a critical solution for real-time grid visibility, faster fault detection, and improved dynamic grid control. These advanced devices are becoming integral in modernizing transmission and distribution networks, driven by supportive regulatory frameworks and long-term energy strategies focused on reliability and resilience.
As power networks become more decentralized and complex, the use of PMUs is accelerating, particularly in emerging markets where energy demand continues to rise. Technological innovations are making PMUs more efficient, scalable, and affordable. Enhanced performance in measurement precision, data processing, and communication technologies is empowering utilities to leverage predictive maintenance and better grid forecasting through advanced analytics and smart grid management systems. The evolution of these systems is playing a significant role in expanding the global adoption of PMUs across both developed and developing regions.
| Market Scope | |
|---|---|
| Start Year | 2024 |
| Forecast Year | 2025-2034 |
| Start Value | $688.2 Million |
| Forecast Value | $1.1 Billion |
| CAGR | 5% |
The software segment of the Phasor Measurement Unit Market is forecasted to generate USD 425 million by 2034, with its growth driven largely by the integration of cutting-edge data science tools and artificial intelligence models. These tools allow utilities to carry out real-time fault detection, proactive grid monitoring, and condition-based maintenance strategies with higher efficiency. Improved software platforms offer deeper insights into operational data, helping utilities make informed decisions that enhance overall grid performance.
Meanwhile, the state estimation application segment is expected to generate USD 277 million by 2034. With the increased integration of renewable sources, distributed energy systems, and digital technologies, power grids are becoming more intricate. This complexity heightens the potential for system anomalies, making accurate and continuous state estimation essential to maintain system reliability and prevent failures.
United States Phasor Measurement Unit Market generated USD 129.2 million in 2024. This progress is attributed to sustained investments in smart grid technologies, grid infrastructure upgrades, and the growing need for advanced, real-time measurement systems. As the country continues to push for clean energy transformation, PMUs are playing a pivotal role in enabling more resilient and adaptive grid operations.
Key players contributing to the competitive landscape in the Global Phasor Measurement Unit Market include Siemens, Powerside, STER (Studio Elektronike Rijeka) Ltd., Electric Power Group, GE Vernova, Valiant Communications, Schneider Electric, Schweitzer Engineering Laboratories, Inc., Hitachi, Qualitrol Corp, and Arbiter Systems. Key strategies adopted by companies in the phasor measurement unit market to strengthen their presence include a strong focus on innovation and collaboration. Leading players are investing in research and development to enhance PMU precision, cost efficiency, and integration with next-generation grid systems. Companies are also forming strategic alliances with utilities and technology firms to develop scalable software platforms and smart grid solutions. Many firms are expanding their geographic reach through partnerships and acquisitions, especially in rapidly developing markets.
Table of Contents
Chapter 1 Methodology & Scope
- 1.1 Market definitions
- 1.2 Base estimates & calculations
- 1.3 Forecast calculation
- 1.4 Data sources
- 1.4.1 Primary
- 1.4.2 Secondary
- 1.4.2.1 Paid
- 1.4.2.2 Public
Chapter 2 Executive Summary
- 2.1 Industry synopsis, 2021 – 2034
Chapter 3 Industry Insights
- 3.1 Industry ecosystem analysis
- 3.2 Regulatory landscape
- 3.3 Industry impact forces
- 3.3.1 Growth drivers
- 3.3.2 Industry pitfalls & challenges
- 3.4 Growth potential analysis
- 3.5 Porter's analysis
- 3.5.1 Bargaining power of suppliers
- 3.5.2 Bargaining power of buyers
- 3.5.3 Threat of new entrants
- 3.5.4 Threat of substitutes
- 3.6 PESTEL analysis
Chapter 4 Competitive landscape, 2024
- 4.1 Strategic dashboard
- 4.2 Innovation & sustainability landscape
Chapter 5 Market Size and Forecast, By Component, 2021 - 2034 (USD Million)
- 5.1 Key trends
- 5.2 Hardware
- 5.3 Software
Chapter 6 Market Size and Forecast, By Application, 2021 - 2034 (USD Million)
- 6.1 Key trends
- 6.2 Fault analysis
- 6.3 State estimation
- 6.4 Stability monitoring
- 6.5 Power system control
- 6.6 Operational monitoring
- 6.7 Grid visualization
- 6.8 Others
Chapter 7 Market Size and Forecast, By Region, 2021 - 2034 (USD Million)
- 7.1 Key trends
- 7.2 North America
- 7.2.1 U.S.
- 7.2.2 Canada
- 7.2.3 Mexico
- 7.3 Europe
- 7.3.1 UK
- 7.3.2 France
- 7.3.3 Germany
- 7.3.4 Italy
- 7.3.5 Russia
- 7.3.6 Spain
- 7.4 Asia Pacific
- 7.4.1 China
- 7.4.2 Australia
- 7.4.3 India
- 7.4.4 Japan
- 7.4.5 South Korea
- 7.5 Middle East & Africa
- 7.5.1 Saudi Arabia
- 7.5.2 UAE
- 7.5.3 Turkey
- 7.5.4 South Africa
- 7.5.5 Egypt
- 7.6 Latin America
- 7.6.1 Brazil
- 7.6.2 Argentina
Chapter 8 Company Profiles
- 8.1 Arbiter Systems
- 8.2 Electric Power Group
- 8.3 GE Vernova
- 8.4 Hitachi
- 8.5 Powerside
- 8.6 Qualitrol Corp
- 8.7 Schneider Electric
- 8.8 Schweitzer Engineering Laboratories, Inc.
- 8.9 Siemens
- 8.10 STER (Studio Elektronike Rijeka) Ltd.
- 8.11 Valiant Communications


