


 |
市場調查報告書
商品編碼
1773244
醬料及調味品市場機會、成長動力、產業趨勢分析及 2025 - 2034 年預測Sauces and Condiments Market Opportunity, Growth Drivers, Industry Trend Analysis, and Forecast 2025 - 2034 |
||||||
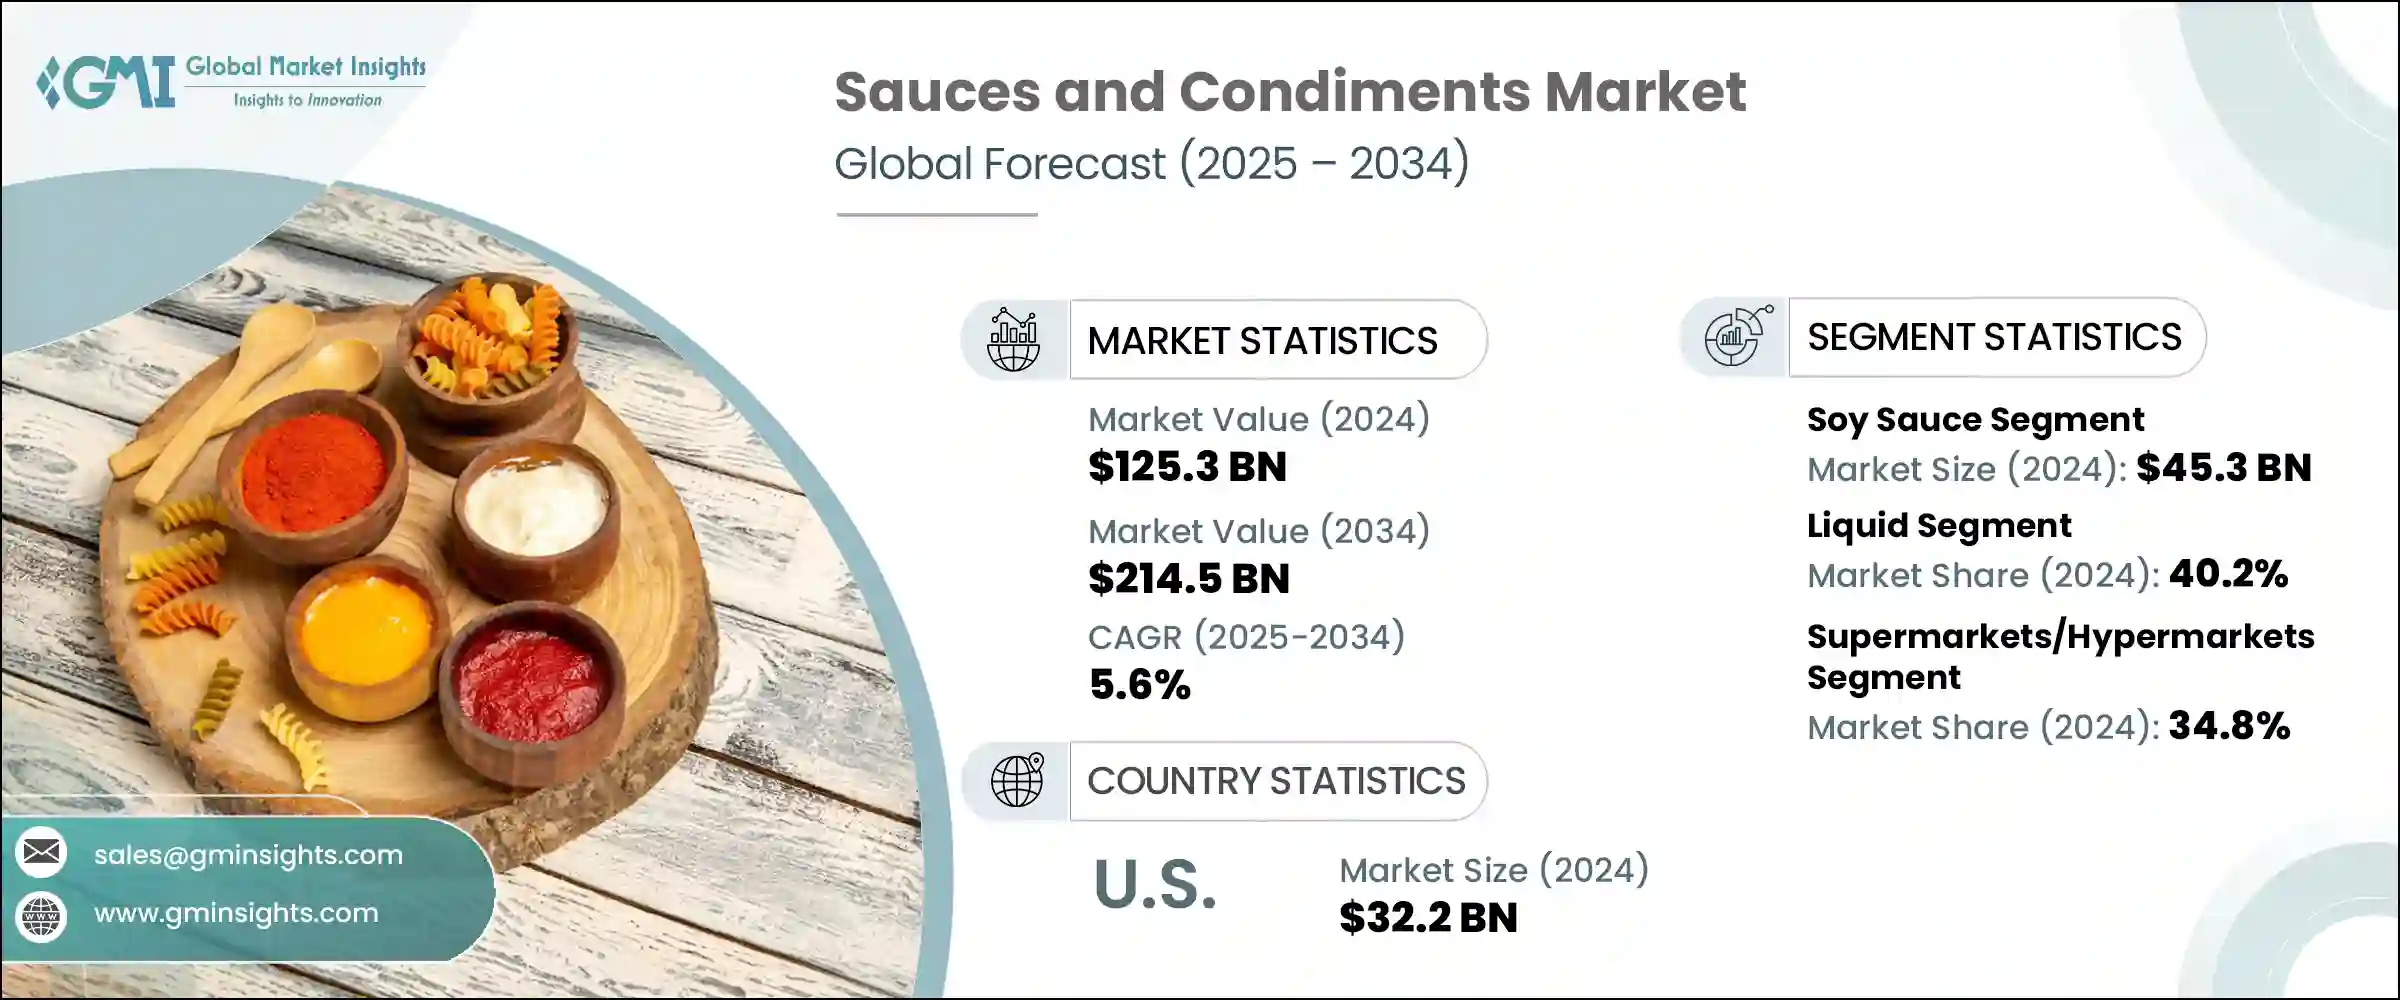
2024年,全球醬料和調味品市場規模達1,253億美元,預計到2034年將以5.6%的複合年成長率成長,達到2,145億美元。這一成長源自於消費者對便利性和更佳烹飪體驗的日益追求。隨著生活節奏的加快和全球消費者口味的不斷提升,許多消費者如今更青睞那些能夠快速便捷地豐富膳食的即食醬料和調味品。
家庭烹飪和膳食準備的興起進一步刺激了需求,促使製造商不斷創新,重新配製食譜以提升口味和健康益處,探索新的食材,並改進包裝以滿足不斷變化的消費者需求。這些因素共同推動市場的發展。然而,隨著越來越多的參與者以激進的定價、新穎的產品和強大的行銷策略進入市場,來自新興品牌和成熟企業的激烈競爭也給利潤率帶來了壓力。
| 市場範圍 | |
|---|---|
| 起始年份 | 2024 |
| 預測年份 | 2025-2034 |
| 起始值 | 1253億美元 |
| 預測值 | 2145億美元 |
| 複合年成長率 | 5.6% |
此外,自有品牌的激增正以低價吸引注重預算的消費者,這對品牌醬料製造商維持其市場佔有率和盈利能力構成挑戰。這些自有品牌不僅在價格上競爭,而且越來越注重提升品質、口味和包裝,以縮小與知名品牌的差距。零售商正在增加貨架空間和產品線的曝光度,並提供促銷和忠誠度激勵措施,以推動消費者對自有品牌調味品的偏好。
因此,老牌企業面臨巨大的壓力,需要透過提升風味、簡化成分標籤和永續包裝,打造差異化產品、創新產品線,並證明高價位的合理性。自有品牌的日益壯大正在改變競爭格局,迫使傳統品牌重新思考其在不斷發展變化且價格敏感的市場中的定位策略。
2024年,醬油市場估值達453億美元,預計2025年至2034年的複合年成長率為5.7%。醬油的受歡迎程度源自於其用途廣泛,例如烹飪、醃製和作為餐桌調味品。醬油的全球吸引力跨越了文化界限,使其成為各種美食的必備食材。目前的消費趨勢表明,在注重健康的消費者的推動下,對無麩質和低鈉醬油的需求不斷成長。添加大蒜、柑橘或鬆露等成分的調味醬油正日益流行,因為它們為尋求新穎口味體驗的消費者提供了便利和多樣性。
2024年,液體醬料市場佔據了40.2%的市場佔有率,這主要歸功於其易用性。這些醬料佔據了調味品市場的一半以上,用途廣泛,既可用作烹飪配料,也可作為蘸料。醬油、辣醬和油醋汁等產品是全球家庭必需品。消費者越來越青睞那些標榜純天然、無糖或富含益生菌的液體醬料。擠壓瓶和小袋等包裝創新因其便利性和份量控制而廣受歡迎,進一步刺激了該領域的需求。
2024年,美國醬料和調味品市場產值達322億美元。多元文化人口、廣泛的全球旅行和媒體消費推動了國際風味的日益普及。這一趨勢體現在各種辛辣濃郁的調味品消費量的成長。社群媒體對烹飪潮流的影響力激增,使得國際醬料更容易被美國消費者接受,也更受消費者青睞,加速了對新奇風味的需求。
醬料和調味品市場的領先公司包括康尼格拉品牌、雀巢、味好美公司、卡夫亨氏公司、瑪氏公司、伯納食品、龜甲萬株式會社、聯合利華、Bay Valley、Casa Fiesta、Fuchs Gewurze GmbH、李錦記、荷美爾食品公司和匯豐食品。為鞏固市場地位,醬料和調味品產業的公司採取了多種策略方針。產品創新始終處於領先地位,各公司不斷開發更健康、純天然和特色醬料,以滿足不斷變化的消費者偏好。他們還大力投資永續和環保的包裝解決方案,以符合環境目標並吸引環保意識的買家。透過傳統零售和電子商務通路擴大分銷網路可以擴大市場覆蓋率和可及性。
目錄
第1章:方法論與範圍
第2章:執行摘要
第3章:行業洞察
- 產業生態系統分析
- 供應商概況
- 利潤率
- 每個階段的增值
- 影響價值鏈的因素
- 中斷
- 產業衝擊力
- 成長動力
- 產業陷阱與挑戰
- 市場機會
- 成長潛力分析
- 監管格局
- 北美洲
- 歐洲
- 亞太地區
- 拉丁美洲
- 中東和非洲
- 波特的分析
- PESTEL分析
- 價格趨勢
- 按地區
- 未來市場趨勢
- 科技與創新格局
- 當前的技術趨勢
- 新興技術
- 專利態勢
- 貿易統計資料(HS 編碼)(註:僅提供主要國家的貿易統計數據
- 主要進口國
- 主要出口國
- 永續性和環境方面
- 永續實踐
- 減少廢棄物的策略
- 生產中的能源效率
- 環保舉措
第4章:競爭格局
- 介紹
- 公司市佔率分析
- 按地區
- 北美洲
- 歐洲
- 亞太地區
- 拉丁美洲
- MEA
- 按地區
- 公司矩陣分析
- 主要市場參與者的競爭分析
- 競爭定位矩陣
- 關鍵進展
- 併購
- 夥伴關係與合作
- 新產品發布
- 擴張計劃
第5章:市場估計與預測:依產品類型,2021 年至 2034 年
- 主要趨勢
- 醬油
- 辣醬
- 蘑菇醬
- 雞尾酒醬
- 其他
第6章:市場估計與預測:依形式,2021 年至 2034 年
- 主要趨勢
- 液體
- 貼上
- 乾燥
第7章:市場估計與預測:按配銷通路,2021 年至 2034 年
- 主要趨勢
- 超市/大賣場
- 便利商店
- 網路零售
- 專賣店
- 其他
第8章:市場估計與預測:按地區,2021 年至 2034 年
- 主要趨勢
- 北美洲
- 美國
- 加拿大
- 歐洲
- 德國
- 英國
- 法國
- 西班牙
- 義大利
- 歐洲其他地區
- 亞太地區
- 中國
- 印度
- 日本
- 澳洲
- 韓國
- 亞太其他地區
- 拉丁美洲
- 巴西
- 墨西哥
- 阿根廷
- 拉丁美洲其他地區
- 中東和非洲
- 沙烏地阿拉伯
- 南非
- 阿拉伯聯合大公國
- 中東和非洲其他地區
第9章:公司簡介
- Bay Valley
- Berner Foods
- Casa Fiesta
- Conagra Brands
- Fuchs Gewurze GmbH
- General Mills
- Hormel Foods Corporation
- Huy Fong Foods
- Kikkoman Corporation
- Lee Kum Kee
- Mars, Incorporated
- McCormick & Company
- Nestle
- The Kraft Heinz Company
- Unilever
The Global Sauces and Condiments Market was valued at USD 125.3 billion in 2024 and is estimated to grow at a CAGR of 5.6% to reach USD 214.5 billion by 2034. This growth is driven by consumers' increasing preference for convenience and enhanced culinary experiences. With hectic lifestyles and expanding global palates, many consumers now favor ready-to-use sauces and condiments that enrich meals quickly and easily.
The rising trend of home cooking and meal preparation has further fueled demand, prompting manufacturers to innovate by reformulating recipes for better taste and health benefits, exploring new ingredients, and improving packaging to align with evolving consumer needs. These factors collectively are propelling the market forward. However, intensified competition from emerging brands and well-established companies alike is putting pressure on profit margins, as more players enter the market with aggressive pricing, novel products, and robust marketing strategies.
| Market Scope | |
|---|---|
| Start Year | 2024 |
| Forecast Year | 2025-2034 |
| Start Value | $125.3 Billion |
| Forecast Value | $214.5 Billion |
| CAGR | 5.6% |
Additionally, the proliferation of private label brands is attracting budget-conscious consumers with lower-priced options, challenging branded sauce manufacturers to maintain their market share and profitability. These private labels are not only competing on price but are increasingly focusing on improving quality, taste, and packaging-closing the gap with well-established brands. Retailers are giving more shelf space and visibility to their product lines, offering promotions and loyalty incentives that drive customer preference toward store-brand condiments.
As a result, established players are under pressure to differentiate their offerings, innovate product lines, and justify premium pricing through enhanced flavor profiles, cleaner ingredient labels, and sustainable packaging. The intensifying presence of private labels is shifting the competitive landscape, forcing traditional brands to rethink their positioning strategies in an evolving, price-sensitive market.
In 2024, the soy sauce segment held a valuation of USD 45.3 billion and is projected to grow at a CAGR of 5.7% from 2025 to 2034. Its popularity stems from versatile applications such as cooking, marinating, and serving as a table condiment. Soy sauce's global appeal crosses cultural boundaries, making it a staple in diverse cuisines. Current consumer trends show a rising demand for gluten-free and low-sodium soy sauces, driven by health-conscious shoppers. Flavored soy sauces infused with ingredients like garlic, citrus, or truffle are gaining momentum as they offer convenience and variety to consumers seeking novel taste experiences.
The liquid sauces segment accounted for a 40.2% share in 2024, largely due to their ease of use. These sauces cover over half of the condiments market, serving multiple purposes as cooking ingredients or dipping options. Products like soy sauce, hot sauce, and vinaigrette are household essentials globally. Consumers increasingly prefer liquid sauces marketed as all-natural, sugar-free, or enriched with probiotics. Packaging innovations such as squeeze bottles and sachets have gained popularity for their convenience and portion control, further boosting demand in this segment.
United States Sauces and Condiments Market generated USD 32.2 billion in 2024. The rising popularity of international flavors is fueled by a multicultural population and widespread global travel and media consumption. This trend is reflected in the growing consumption of diverse spicy and bold condiments. The surge in social media's influence on culinary trends has made international sauces more accessible and desirable to American consumers, accelerating demand for new and exotic flavors.
Leading companies in the Sauces and Condiments Market include Conagra Brands, Nestle, McCormick & Company, The Kraft Heinz Company, Mars, Incorporated, Berner Foods, Kikkoman Corporation, Unilever, Bay Valley, Casa Fiesta, Fuchs Gewurze GmbH, Lee Kum Kee, Hormel Foods Corporation, Huy Fong Foods. To solidify their market presence, companies in the sauces and condiments industry adopt several strategic approaches. Product innovation remains at the forefront, with firms continuously developing healthier, all-natural, and specialty sauces to meet shifting consumer preferences. They also invest heavily in sustainable and eco-friendly packaging solutions to align with environmental goals and appeal to eco-conscious buyers. Expanding distribution networks through both traditional retail and e-commerce channels enables broader market reach and accessibility.
Table of Contents
Chapter 1 Methodology and Scope
- 1.1 Market scope and definition
- 1.2 Research design
- 1.2.1 Research approach
- 1.2.2 Data collection methods
- 1.3 Data mining sources
- 1.3.1 Global
- 1.3.2 Regional/Country
- 1.4 Base estimates and calculations
- 1.4.1 Base year calculation
- 1.4.2 Key trends for market estimation
- 1.5 Primary research and validation
- 1.5.1 Primary sources
- 1.6 Forecast model
- 1.7 Research assumptions and limitations
Chapter 2 Executive Summary
- 2.1 Industry 3600 synopsis
- 2.2 Key market trends
- 2.2.1 Regional
- 2.2.2 By type
- 2.2.3 By form
- 2.2.4 By distribution channel
- 2.3 TAM Analysis, 2025-2034
- 2.4 CXO perspectives: Strategic imperatives
- 2.4.1 Executive decision points
- 2.4.2 Critical success factors
- 2.5 Future Outlook and Strategic Recommendations
Chapter 3 Industry Insights
- 3.1 Industry ecosystem analysis
- 3.1.1 Supplier Landscape
- 3.1.2 Profit Margin
- 3.1.3 Value addition at each stage
- 3.1.4 Factor affecting the value chain
- 3.1.5 Disruptions
- 3.2 Industry impact forces
- 3.2.1 Growth drivers
- 3.2.2 Industry pitfalls and challenges
- 3.2.3 Market opportunities
- 3.3 Growth potential analysis
- 3.4 Regulatory landscape
- 3.4.1 North America
- 3.4.2 Europe
- 3.4.3 Asia Pacific
- 3.4.4 Latin America
- 3.4.5 Middle East & Africa
- 3.5 Porter's analysis
- 3.6 PESTEL analysis
- 3.6.1 Technology and Innovation landscape
- 3.6.2 Current technological trends
- 3.6.3 Emerging technologies
- 3.7 Price trends
- 3.7.1 By region
- 3.8 Future market trends
- 3.9 Technology and Innovation landscape
- 3.9.1 Current technological trends
- 3.9.2 Emerging technologies
- 3.10 Patent Landscape
- 3.11 Trade statistics (HS code) (Note: the trade statistics will be provided for key countries only
- 3.11.1 Major importing countries
- 3.11.2 Major exporting countries
- 3.12 Sustainability and Environmental Aspects
- 3.12.1 Sustainable Practices
- 3.12.2 Waste Reduction Strategies
- 3.12.3 Energy Efficiency in Production
- 3.12.4 Eco-friendly Initiatives
Chapter 4 Competitive Landscape, 2024
- 4.1 Introduction
- 4.2 Company market share analysis
- 4.2.1 By region
- 4.2.1.1 North America
- 4.2.1.2 Europe
- 4.2.1.3 Asia Pacific
- 4.2.1.4 LATAM
- 4.2.1.5 MEA
- 4.2.1 By region
- 4.3 Company matrix analysis
- 4.4 Competitive analysis of major market players
- 4.5 Competitive positioning matrix
- 4.6 Key developments
- 4.6.1 Mergers & acquisitions
- 4.6.2 Partnerships & collaborations
- 4.6.3 New Product Launches
- 4.6.4 Expansion Plans
Chapter 5 Market Estimates and Forecast, By Product Type, 2021 – 2034 (USD Billion) (Kilo Tons)
- 5.1 Key trends
- 5.2 Soy sauce
- 5.3 Hot sauce
- 5.4 Mushroom sauce
- 5.5 Cocktail sauce
- 5.6 Others
Chapter 6 Market Estimates and Forecast, By Form, 2021 – 2034 (USD Billion) (Kilo Tons)
- 6.1 Key trends
- 6.2 Liquid
- 6.3 Paste
- 6.4 Dry
Chapter 7 Market Estimates and Forecast, By Distribution Channel, 2021 – 2034 (USD Billion) (Kilo Tons)
- 7.1 Key trends
- 7.2 Supermarkets/hypermarkets
- 7.3 Convenience stores
- 7.4 Online retail
- 7.5 Specialty stores
- 7.6 Others
Chapter 8 Market Estimates and Forecast, By Region, 2021 – 2034 (USD Billion) (Kilo Tons)
- 8.1 Key trends
- 8.2 North America
- 8.2.1 U.S.
- 8.2.2 Canada
- 8.3 Europe
- 8.3.1 Germany
- 8.3.2 UK
- 8.3.3 France
- 8.3.4 Spain
- 8.3.5 Italy
- 8.3.6 Rest of Europe
- 8.4 Asia Pacific
- 8.4.1 China
- 8.4.2 India
- 8.4.3 Japan
- 8.4.4 Australia
- 8.4.5 South Korea
- 8.4.6 Rest of Asia Pacific
- 8.5 Latin America
- 8.5.1 Brazil
- 8.5.2 Mexico
- 8.5.3 Argentina
- 8.5.4 Rest of Latin America
- 8.6 Middle East and Africa
- 8.6.1 Saudi Arabia
- 8.6.2 South Africa
- 8.6.3 UAE
- 8.6.4 Rest of Middle East & Africa
Chapter 9 Company Profiles
- 9.1 Bay Valley
- 9.2 Berner Foods
- 9.3 Casa Fiesta
- 9.4 Conagra Brands
- 9.5 Fuchs Gewurze GmbH
- 9.6 General Mills
- 9.7 Hormel Foods Corporation
- 9.8 Huy Fong Foods
- 9.9 Kikkoman Corporation
- 9.10 Lee Kum Kee
- 9.11 Mars, Incorporated
- 9.12 McCormick & Company
- 9.13 Nestle
- 9.14 The Kraft Heinz Company
- 9.15 Unilever

