


 |
市場調查報告書
商品編碼
1766348
藍氫市場機會、成長動力、產業趨勢分析及 2025 - 2034 年預測Blue Hydrogen Market Opportunity, Growth Drivers, Industry Trend Analysis, and Forecast 2025 - 2034 |
||||||
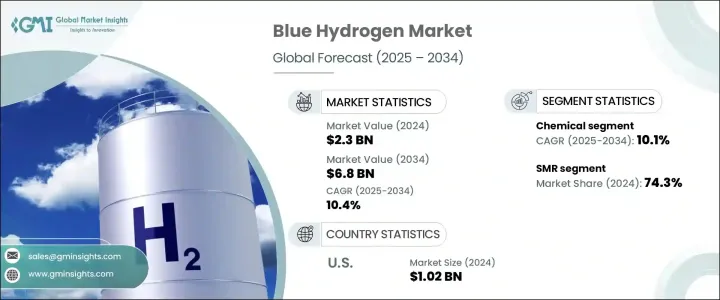
2024年,全球藍氫市場規模達23億美元,預計2034年將以10.4%的複合年成長率成長,達到68億美元。能源多元化和能源安全日益受到重視,這加速了藍氫的生產,尤其得益於其能夠利用現有天然氣基礎設施大規模生產氫氣,同時保持相對較低的碳強度。隨著工業領域減排壓力日益增大,藍氫的應用,尤其是在能源密集產業,正蓬勃發展。與氫氣設施結合的碳捕獲與封存 (CCS) 解決方案,在鋼鐵、合成氨和煉油等領域實現氣候目標方面發揮著至關重要的作用。此外,藍氫基礎設施具有可擴展性,使其成為可行的長期工業脫碳策略。
隨著跨境合作的不斷發展,國際夥伴關係預計將透過在區域和全球供應鏈中提供低碳氫化合物燃料,進一步加速市場發展。這些合作投資為推動清潔能源計畫奠定了堅實的基礎。支持性的政策框架和充足的天然氣供應正在推動藍氫生產的擴張。利用現有的管道和儲存系統也為減排難度較高的產業創造了一條經濟的脫碳途徑。各國政府支持碳捕獲和清潔氫能政策,並持續激勵全球工業運作中採用這些技術。
| 市場範圍 | |
|---|---|
| 起始年份 | 2024 |
| 預測年份 | 2025-2034 |
| 起始值 | 23億美元 |
| 預測值 | 68億美元 |
| 複合年成長率 | 10.4% |
預計2025年至2034年,石油煉製領域的複合年成長率將達到8.1%。為減少煉油作業的碳足跡,對低排放氫氣的需求仍然強勁。更嚴格的環境法規正促使下游業者將藍氫納入其排放合規策略。隨著生產商尋求使用更清潔的替代燃料來實現營運的現代化和麵向未來,這些發展預計將在未來幾年內提升該領域的佔有率。
預計2025年至2034年間,ATR細分市場的複合年成長率將達到24.8%,這主要得益於其與碳捕集技術的出色兼容性以及高效生產高純度氫氣的能力。與傳統的重整製程不同,ATR將部分氧化和蒸汽重整結合在一個反應器中,使其更易於與CCS系統整合。這種雙功能方法提高了製程效率,使ATR成為大型低碳氫氣設施的首選。
2024年,美國藍氫市場規模達10.2億美元。北美佔了54.4%的佔有率。這一區域主導地位得益於全球範圍內合作夥伴關係的加強和旨在建立高效氫氨出口走廊的基礎設施建設。這些國際合作正在幫助美國透過提高生產能力和強化供應鏈,擴大其在全球氫能經濟中的地位。
藍氫市場的主要參與者包括 BP、Woodside、蒂森克虜伯工業解決方案、莊信萬豐、Maire Tecnimont、Saipem、殼牌、SK E&S、TOPSOE、Technip Energies、埃尼、Bechtel Corporation、液化空氣集團、埃克森美孚公司、約翰伍德集團、空氣產品公司和 Equinor。為了擴大市場佔有率和加強競爭地位,藍氫領域的主要參與者正在部署一系列策略性措施。這些措施包括組成全球合資企業和合作夥伴關係,共同開發碳捕獲和低排放氫氣分配的基礎設施。一些公司正在用先進的 CCS 技術改造現有的天然氣工廠,以快速、經濟高效地擴大生產規模。其他公司則專注於政府合作,以獲得監管支持、資金和長期合約。技術創新仍然是核心,人們正在持續進行研發投資,以提高製程效率並降低生產的碳強度。
目錄
第1章:方法論與範圍
第2章:執行摘要
第3章:行業洞察
- 產業生態系統
- 監管格局
- 產業衝擊力
- 成長動力
- 產業陷阱與挑戰
- 成長潛力分析
- 波特的分析
- PESTEL分析
第4章:競爭格局
- 介紹
- 公司市佔率
- 戰略儀表板
- 策略舉措
- 競爭基準測試
- 創新與永續發展格局
第5章:市場規模及預測:依應用,2021 - 2034
- 主要趨勢
- 石油煉油廠
- 化學
- 其他
第6章:市場規模及預測:依技術分類,2021 - 2034 年
- 主要趨勢
- 小型磁共振
- ATR
- 部分氧化
第7章:市場規模及預測:依地區,2021 - 2034
- 主要趨勢
- 北美洲
- 美國
- 加拿大
- 墨西哥
- 歐洲
- 德國
- 法國
- 英國
- 義大利
- 俄羅斯
- 亞太地區
- 中國
- 印度
- 日本
- 澳洲
- 中東和非洲
- 沙烏地阿拉伯
- 阿曼
- 阿拉伯聯合大公國
- 科威特
- 卡達
- 南非
- 拉丁美洲
第8章:公司簡介
- Air Products
- Air Liquide
- Bechtel Corporation
- BP
- Eni
- Exxon Mobil Corporation
- Equinor
- John Wood Group
- Johnson Matthey
- MaireTecnimont
- Saipem
- SK E&S
- Shell
- Technip Energies
- TOPSOE
- thyssenkrupp Industrial Solutions
- Woodside
The Global Blue Hydrogen Market was valued at USD 2.3 billion in 2024 and is estimated to grow at a CAGR of 10.4% to reach USD 6.8 billion by 2034. The rising focus on energy diversification and enhanced energy security is accelerating blue hydrogen production, particularly due to its ability to generate hydrogen at scale using existing natural gas infrastructure while keeping carbon intensity relatively low. With mounting pressure on industries to reduce emissions, the use of blue hydrogen-especially in energy-intensive sectors-is gaining momentum. Carbon capture and storage (CCS) solutions integrated with hydrogen facilities are playing a vital role in meeting climate objectives in segments like steel, ammonia, and oil refining. Additionally, blue hydrogen infrastructure is scalable, making it a viable long-term strategy for industrial decarbonization.
As cross-border collaborations grow, international partnerships are expected to further accelerate market development by delivering low-carbon hydrogen fuels across regional and global supply chains. These collaborative investments serve as a strong foundation for advancing clean energy initiatives. Supportive policy frameworks and an abundant supply of natural gas are encouraging the expansion of blue hydrogen production. Utilizing existing pipelines and storage systems also creates an economical pathway to decarbonize sectors where emission reductions are particularly challenging. Governments backing carbon capture and clean hydrogen policies continue to incentivize adoption in industrial operations globally.
| Market Scope | |
|---|---|
| Start Year | 2024 |
| Forecast Year | 2025-2034 |
| Start Value | $2.3 Billion |
| Forecast Value | $6.8 Billion |
| CAGR | 10.4% |
The petroleum refining segment is forecasted to grow at a CAGR of 8.1% from 2025 to 2034. Demand for lower-emission hydrogen to reduce carbon footprints in refining operations remains strong. Stricter environmental regulations are pushing downstream operators to integrate blue hydrogen as part of their emissions compliance strategies. These developments are expected to enhance the segment's share in the coming years as producers look to modernize and future-proof operations using cleaner fuel alternatives.
The ATR segment is projected to grow at a CAGR of 24.8% between 2025 and 2034, primarily due to its exceptional compatibility with carbon capture technologies and its ability to produce high-purity hydrogen efficiently. Unlike conventional reforming processes, ATR combines partial oxidation and steam reforming in a single reactor, making it more adaptable for integration with CCS systems. This dual-function approach enhances process efficiency and makes ATR a preferred choice for large-scale, low-carbon hydrogen production facilities.
United States Blue Hydrogen Market was valued at USD 1.02 billion in 2024. North America accounted for 54.4% of the share in 2024. This regional dominance is underpinned by the growth of global-scale partnerships and infrastructure developments geared toward establishing efficient hydrogen-ammonia export corridors. These international collaborations are helping the U.S. expand its role in the global hydrogen economy by increasing production capabilities and strengthening supply chains.
Leading participants in the Blue Hydrogen Market include BP, Woodside, ThyssenKrupp Industrial Solutions, Johnson Matthey, Maire Tecnimont, Saipem, Shell, SK E&S, TOPSOE, Technip Energies, Eni, Bechtel Corporation, Air Liquide, Exxon Mobil Corporation, John Wood Group, Air Products, and Equinor. To expand market share and reinforce their competitive standing, major players in the blue hydrogen sector are deploying a range of strategic initiatives. These include forming global joint ventures and partnerships to co-develop infrastructure for carbon capture and low-emission hydrogen distribution. Several companies are retrofitting existing natural gas plants with advanced CCS technologies to scale production quickly and cost-effectively. Others are focusing on government collaborations to secure regulatory support, funding, and long-term contracts. Technological innovation also remains central, with continuous R&D investments being made to improve process efficiency and reduce the carbon intensity of production.
Table of Contents
Chapter 1 Methodology & Scope
- 1.1 Research design
- 1.2 Base estimates & calculations
- 1.3 Forecast calculation
- 1.4 Primary research & validation
- 1.4.1 Primary sources
- 1.4.2 Data mining sources
- 1.5 Market definitions
Chapter 2 Executive Summary
- 2.1 Industry synopsis, 2021 - 2034
Chapter 3 Industry Insights
- 3.1 Industry ecosystem
- 3.2 Regulatory landscape
- 3.3 Industry impact forces
- 3.3.1 Growth drivers
- 3.3.2 Industry pitfalls & challenges
- 3.4 Growth potential analysis
- 3.5 Porter's analysis
- 3.5.1 Bargaining power of suppliers
- 3.5.2 Bargaining power of buyers
- 3.5.3 Threat of new entrants
- 3.5.4 Threat of substitutes
- 3.6 PESTEL analysis
Chapter 4 Competitive landscape, 2024
- 4.1 Introduction
- 4.2 Company market share
- 4.3 Strategic dashboard
- 4.4 Strategic initiatives
- 4.5 Competitive benchmarking
- 4.6 Innovation & sustainability landscape
Chapter 5 Market Size and Forecast, By Application, 2021 - 2034 (USD Billion & MT)
- 5.1 Key trends
- 5.2 Petroleum refinery
- 5.3 Chemical
- 5.4 Others
Chapter 6 Market Size and Forecast, By Technology, 2021 - 2034 (USD Billion & MT)
- 6.1 Key trends
- 6.2 SMR
- 6.3 ATR
- 6.4 Partial oxidation
Chapter 7 Market Size and Forecast, By Region, 2021 - 2034 (USD Billion & MT)
- 7.1 Key trends
- 7.2 North America
- 7.2.1 U.S.
- 7.2.2 Canada
- 7.2.3 Mexico
- 7.3 Europe
- 7.3.1 Germany
- 7.3.2 France
- 7.3.3 UK
- 7.3.4 Italy
- 7.3.5 Russia
- 7.4 Asia Pacific
- 7.4.1 China
- 7.4.2 India
- 7.4.3 Japan
- 7.4.4 Australia
- 7.5 Middle East & Africa
- 7.5.1 Saudi Arabia
- 7.5.2 Oman
- 7.5.3 UAE
- 7.5.4 Kuwait
- 7.5.5 Qatar
- 7.5.6 South Africa
- 7.6 Latin America
Chapter 8 Company Profiles
- 8.1 Air Products
- 8.2 Air Liquide
- 8.3 Bechtel Corporation
- 8.4 BP
- 8.5 Eni
- 8.6 Exxon Mobil Corporation
- 8.7 Equinor
- 8.8 John Wood Group
- 8.9 Johnson Matthey
- 8.10 MaireTecnimont
- 8.11 Saipem
- 8.12 SK E&S
- 8.13 Shell
- 8.14 Technip Energies
- 8.15 TOPSOE
- 8.16 thyssenkrupp Industrial Solutions
- 8.17 Woodside
 藍氫市場:2026-2032年全球預測(依生產技術、供應模式、應用及最終用途產業分類)
 2026年全球藍氫市場報告2034年全球藍氫市場機會與策略
 藍氫市場分析及預測(至2035年):類型、產品類型、技術、組件、應用、最終用戶、製程、部署形式、解決方案與設施
 2026-2034年全球藍氫市場規模、佔有率、趨勢和成長分析報告2026年全球化學藍氫市場報告藍氫市場規模、佔有率、成長及全球產業分析:依類型、應用和地區劃分的洞察與預測(2026-2034)
 藍色氫氣市場-全球產業規模、佔有率、趨勢、機會和預測,依技術、運輸方式、應用、地區和競爭格局分類,2020-2030年預測
 藍氫市場規模、佔有率和趨勢分析報告:按應用、運輸方式、技術、地區和細分市場預測,2025-2030 年
 青氫市場,佔有率,規模,產業分析報告:各技術,各用途,運輸模式別,各地區,2025年~2034年的市場預測