


 |
市場調查報告書
商品編碼
1766275
化妝品生物活性成分市場機會、成長動力、產業趨勢分析及 2025 - 2034 年預測Cosmetic Bioactive Ingredients Market Opportunity, Growth Drivers, Industry Trend Analysis, and Forecast 2025 - 2034 |
||||||
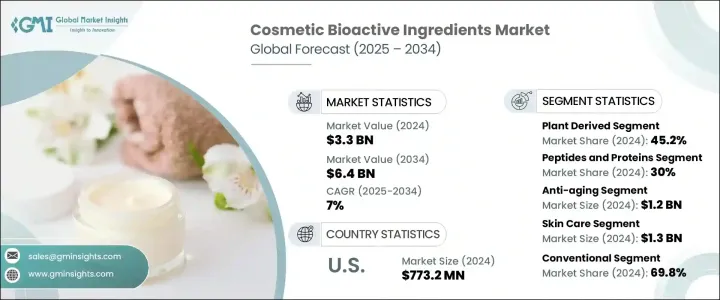
2024年,全球化妝品生物活性成分市場規模達33億美元,預計2034年將以7%的複合年成長率成長,達到64億美元。這一成長主要源於對多功能個人護理產品日益成長的需求,這些產品能夠顯著改善肌膚和秀髮。生物活性成分因其精準的生物效應——增強保濕、煥發光彩、緊緻肌膚、延緩衰老以及抵禦環境壓力——而成為現代化妝品配方中不可或缺的一部分。隨著消費者越來越注重成分,並尋求功效得到驗證的產品,生物活性成分的作用也變得越來越重要。消費者對清潔美容、永續性和實證功效的追求也在重塑化妝品配方的發展方式。封裝和微遞送系統等新技術正在提升這些成分的穩定性和吸收率。
在護膚和護髮領域,生物活性化合物正被用於解決特定問題,使品牌在競爭激烈且快速發展的市場中脫穎而出。這些成分能夠針對老化、乾燥、色素沉著、敏感和頭皮失衡等問題提供針對性解決方案,幫助配方師打造出效果顯著、科學可靠的產品。隨著消費者越來越重視個人化照護和成分透明度,品牌紛紛轉向胜肽、神經醯胺、植物幹細胞、海洋萃取物和微生物友善成分等生物活性成分,以建立信任並提升功效。高性能生物活性成分的整合不僅提升了產品吸引力,也支持了純淨美妝的定位,使品牌在吸引大眾和高階細分市場中注重健康、注重效果的消費者方面擁有戰略優勢。
| 市場範圍 | |
|---|---|
| 起始年份 | 2024 |
| 預測年份 | 2025-2034 |
| 起始值 | 33億美元 |
| 預測值 | 64億美元 |
| 複合年成長率 | 7% |
植物成分佔45.2%的市場佔有率,預計到2034年將以7.2%的複合年成長率成長。由於其天然來源、功能多樣性以及抗氧化、抗炎和舒緩肌膚的功效,植物成分的受歡迎程度持續上升。包括海洋植物萃取物在內的植物成分因其消費者吸引力和安全性而擴大被融入個人護理產品中。發酵和胜肽合成等功能性過程進一步提高了天然化合物的精準度和功效,從而催生出更具針對性且效果顯著的護膚解決方案。
2024年,胜肽類和蛋白質類產品佔據30%的市場佔有率,預計到2034年將以7%的複合年成長率穩定成長。這些成分因其再生能力,是抗衰老配方的基礎。胜肽類產品能夠刺激膠原蛋白生成,並透過作用於細胞層面來提升肌膚彈性,從而幫助減少皺紋,恢復肌膚緊緻。生物工程胜肽類和載體蛋白因其精準的功效而備受青睞,能夠為消費者帶來更有效率、更個人化的益處。其功效和在皮膚科學領域日益成長的聲譽,使其繼續成為化妝品創新領域的高價值成分。
2024年,北美化妝品生物活性成分市場規模達7.732億美元,預計2034年複合年成長率將達5.4%。美國市場憑藉其成熟的美容和個人護理行業、高人均消費以及對科學和功效型產品的強烈偏好而脫穎而出。消費者積極尋求透明度和臨床支援的配方。對胜肽、抗氧化劑和植物萃取物等成分的需求激增,正在推動市場向前發展。整體健康和抗衰老趨勢,加上強大的研發管道和積極的產品推廣,正在鞏固美國作為全球市場關鍵驅動力的地位。
該行業的領先公司包括科萊恩股份公司 (Clariant AG)、亞什蘭全球控股公司 (Ashland Global Holdings Inc.)、BioSpectrum 公司、Active Concepts LLC 和巴斯夫歐洲公司 (BASF SE)。為了提升競爭優勢,化妝品生物活性成分領域的公司正在部署一系列策略措施。這些措施包括大力投資研發,以創新高性能、以科學為依據的成分,滿足不斷變化的消費者偏好。許多公司正在透過加入符合清潔美容價值觀的天然來源和永續成分來擴展其產品組合。與化妝品品牌和皮膚病學機構的合作有助於驗證功效聲明並擴大市場範圍。此外,該公司正在採用奈米封裝等先進加工技術來提高成分穩定性和生物利用度。區域擴張、定製配方和遵守監管標準正在進一步加強其全球影響力。
目錄
第1章:方法論
- 市場範圍和定義
- 研究設計
- 研究方法
- 資料收集方法
- 資料探勘來源
- 全球的
- 地區/國家
- 基礎估算與計算
- 基準年計算
- 市場評估的主要趨勢
- 初步研究和驗證
- 主要來源
- 預測模型
- 研究假設和局限性
第2章:執行摘要
第3章:行業洞察
- 產業生態系統分析
- 供應商概況
- 利潤率
- 每個階段的增值
- 影響價值鏈的因素。
- 中斷
- 產業衝擊力
- 成長動力
- 產業陷阱與挑戰
- 市場機會
- 成長潛力分析
- 監管格局
- 北美洲
- 歐洲
- 亞太地區
- 拉丁美洲
- 中東和非洲
- 波特的分析
- PESTEL分析
- 價格趨勢
- 按地區
- 按產品
- 未來市場趨勢
- 技術和創新格局
- 當前的技術趨勢
- 新興技術
- 專利格局
- 貿易統計(HS編碼)
(註:僅提供重點國家的貿易統計數據
- 主要進口國
- 主要出口國
- 永續性和環境方面
- 永續實踐
- 減少廢棄物的策略
- 生產中的能源效率
- 環保舉措
- 碳足跡考量
- 原料分析
- 植物衍生材料
- 海洋衍生材料
- 生物技術衍生材料
- 動物源性材料
- 原物料採購挑戰
- 永續性考慮
- 萃取和加工技術
- 傳統萃取方法
- 綠色萃取技術
- 生物技術生產
- 酵素法萃取
- 超臨界流體萃取
- 超音波輔助萃取
- 品質控制和測試
- 配銷通路分析
- 直銷
- 分銷商/批發商
- 網路零售
- 專業供應商
- 技術創新與進步
- 新型萃取技術
- 先進的輸送系統
- 封裝技術
- 生物技術應用
- 人工智慧在成分發現的應用
第4章:競爭格局
- 介紹
- 公司市佔率分析
- 按地區
- 北美洲
- 歐洲
- 亞太地區
- 拉丁美洲
- MEA
- 按地區
- 公司矩陣分析
- 主要市場參與者的競爭分析
- 競爭定位矩陣
- 關鍵進展
- 併購
- 夥伴關係與合作
- 新產品發布
- 擴張計劃
第5章:市場估計與預測:按來源,2021 - 2034 年
- 主要趨勢
- 植物衍生
- 草藥和植物藥
- 水果和蔬菜
- 種子和油
- 其他
- 海洋衍生
- 藻類和海藻
- 魚和魚副產品
- 海洋微生物
- 其他
- 生物技術衍生
- 發酵產品
- 工程胜肽
- 其他
- 動物源性
- 膠原蛋白和明膠
- 蜂蜜和蜂膠
- 其他
第6章:市場估計與預測:按類型,2021 - 2034 年
- 主要趨勢
- 抗氧化劑
- 多酚
- 類胡蘿蔔素
- 維生素
- 其他
- 胜肽和蛋白質
- 膠原蛋白胜肽
- 訊號肽
- 載體胜肽
- 酵素抑制胜肽
- 其他
- 多醣
- 玻尿酸
- 藻酸鹽
- 殼聚醣
- 其他
- 脂質和脂肪酸
- Omega-3脂肪酸
- 神經醯胺
- 磷脂
- 其他
- 酵素
- 蛋白酶
- 脂肪酶
- 其他
- 維生素和礦物質
- 維生素A
- 維生素C
- 維生素E
- 其他
- 其他
第7章:市場估計與預測:按應用,2021 - 2034 年
- 主要趨勢
- 抗衰老
- 使肌膚亮麗明亮。
- 防紫外線
- 保濕補水
- 抗痤瘡
- 頭髮護理
- 其他
第8章:市場估計與預測:依最終用途,2021 - 2034 年
- 主要趨勢
- 皮膚護理
- 臉部護理
- 身體護理
- 防曬護理
- 其他
- 頭髮護理
- 洗髮精和護髮素
- 髮油和精華素
- 染髮劑
- 其他
- 化妝品和彩妝
- 臉部化妝
- 眼妝
- 唇部產品
- 其他
- 香水
- 口腔護理
- 其他
第9章:市場估計與預測:依功能,2021-2034
- 主要趨勢
- 傳統的
- 膠囊
- 脂質體
- 囊泡
- 微乳液
- 固體脂質奈米顆粒
- 其他
第10章:市場估計與預測:按地區,2021 - 2034 年
- 主要趨勢
- 北美洲
- 美國
- 加拿大
- 歐洲
- 德國
- 英國
- 法國
- 義大利
- 西班牙
- 歐洲其他地區
- 亞太地區
- 中國
- 印度
- 日本
- 澳洲
- 韓國
- 亞太其他地區
- 拉丁美洲
- 巴西
- 墨西哥
- 阿根廷
- 拉丁美洲其他地區
- 中東和非洲
- 沙烏地阿拉伯
- 南非
- 阿拉伯聯合大公國
- 中東和非洲其他地區
第 11 章:公司簡介
- Active Concepts LLC
- Ashland Global Holdings Inc.
- BASF SE
- BioSpectrum, Inc.
- Clariant AG
- Codif Technologie Naturelle
- Croda International Plc
- Evonik Industries AG
- Gattefosse SAS
- Givaudan SA
- Laboratoires Expanscience
- Lipotec SAU
- Lonza Group
- Lucas Meyer Cosmetics (IFF)
- Mibelle Biochemistry
- Provital Group
- Seppic SA
- Silab
- Symrise AG
- Vytrus Biotech
The Global Cosmetic Bioactive Ingredients Market was valued at USD 3.3 billion in 2024 and is estimated to grow at a CAGR of 7% to reach USD 6.4 billion by 2034. This growth is fueled by rising demand for multifunctional personal care products that deliver visible skin and hair improvements. Bioactive ingredients are integral to modern cosmetic formulations due to their targeted biological effects-enhancing hydration, promoting radiance, firming the skin, reversing signs of aging, and defending against environmental stressors. As consumers become more ingredient-conscious and seek products offering proven efficacy, the role of bioactives has become increasingly important. The shift toward clean beauty, sustainability, and evidence-backed performance is also reshaping how formulations are developed. New technologies like encapsulation and micro-delivery systems are advancing the stability and absorption of these ingredients.
In both skincare and haircare, bioactive compounds are being leveraged to address specific concerns, allowing brands to differentiate themselves in a competitive and rapidly evolving landscape. These ingredients enable targeted solutions for issues such as aging, dryness, pigmentation, sensitivity, and scalp imbalances, helping formulators create products that offer visible, science-backed results. As consumers increasingly prioritize personalized care and ingredient transparency, brands are turning to bioactives like peptides, ceramides, plant stem cells, marine extracts, and microbiome-friendly agents to build trust and deliver efficacy. The integration of high-performance bioactives not only elevates product appeal but also supports clean beauty positioning, giving brands a strategic advantage in appealing to health-conscious, results-driven consumers across both mass and premium segments.
| Market Scope | |
|---|---|
| Start Year | 2024 |
| Forecast Year | 2025-2034 |
| Start Value | $3.3 Billion |
| Forecast Value | $6.4 Billion |
| CAGR | 7% |
The plant-based ingredients segment held 45.2% share and is projected to grow at a CAGR of 7.2% through 2034. Their popularity continues to rise due to their natural origin, functional versatility, and effectiveness in delivering antioxidant, anti-inflammatory, and skin-soothing benefits. Botanical elements, including marine and plant extracts, are increasingly integrated into personal care products because of their consumer appeal and perceived safety. Functional processes such as fermentation and peptide synthesis are further enhancing the precision and performance of natural compounds, giving rise to more targeted skincare solutions with measurable results.
The peptides and proteins segment held a 30% share in 2024 and is forecast to grow at a steady 7% CAGR by 2034. These ingredients are fundamental to anti-aging formulations due to their regenerative capabilities. Peptides stimulate collagen production and improve elasticity by acting at the cellular level, helping reduce wrinkles and restore skin firmness. Bioengineered peptides and carrier proteins are particularly favored for their ability to deliver targeted action, giving consumers more potent and personalized benefits. Their effectiveness and growing reputation in dermal science continue to position them as high-value components in cosmetic innovation.
North America Cosmetic Bioactive Ingredients Market generated USD 773.2 million in 2024 and is expected to see a 5.4% CAGR through 2034. The U.S. market stands out due to its mature beauty and personal care sector, high per capita spending, and strong inclination toward scientific and performance-driven products. Consumers are actively seeking transparency and clinically supported formulations. A surge in demand for ingredients such as peptides, antioxidants, and botanical extracts is propelling the market forward. The trend toward holistic wellness and anti-aging, along with robust R&D pipelines and aggressive product rollouts, is cementing the U.S. as a key driver in the global market.
Leading companies in this industry include Clariant AG, Ashland Global Holdings Inc., BioSpectrum, Inc., Active Concepts LLC, and BASF SE. To enhance their competitive positioning, companies in the cosmetic bioactive ingredients space are deploying a range of strategic measures. These include investing heavily in research and development to innovate high-performance, science-backed ingredients that meet evolving consumer preferences. Many firms are expanding their portfolios by incorporating naturally sourced and sustainable ingredients that align with clean beauty values. Collaborations with cosmetic brands and dermatological institutes help validate efficacy claims and expand market reach. Additionally, companies are adopting advanced processing technologies like nano-encapsulation to improve ingredient stability and bioavailability. Regional expansion, customized formulations, and compliance with regulatory standards are further strengthening their global footprint.
Table of Contents
Chapter 1 Methodology
- 1.1 Market scope and definition
- 1.2 Research design
- 1.2.1 Research approach
- 1.2.2 Data collection methods
- 1.3 Data mining sources
- 1.3.1 Global
- 1.3.2 Regional/Country
- 1.4 Base estimates and calculations
- 1.4.1 Base year calculation
- 1.4.2 Key trends for market estimation
- 1.5 Primary research and validation
- 1.5.1 Primary sources
- 1.6 Forecast model
- 1.7 Research assumptions and limitations
Chapter 2 Executive Summary
- 2.1 Industry 3600 synopsis
- 2.2 Key market trends
- 2.2.1 Regional
- 2.2.2 Sources
- 2.2.3 Type
- 2.2.4 Application
- 2.2.5 End use
- 2.2.6 Function
- 2.3 TAM Analysis, 2025-2034
- 2.4 CXO perspectives: Strategic imperatives
- 2.4.1 Executive decision points
- 2.4.2 Critical success factors
- 2.5 Future Outlook and Strategic Recommendations
Chapter 3 Industry Insights
- 3.1 Industry ecosystem analysis
- 3.1.1 Supplier Landscape
- 3.1.2 Profit Margin
- 3.1.3 Value addition at each stage
- 3.1.4 Factor affecting the value chain.
- 3.1.5 Disruptions
- 3.2 Industry impact forces
- 3.2.1 Growth drivers
- 3.2.2 Industry pitfalls and challenges
- 3.2.3 Market opportunities
- 3.3 Growth potential analysis
- 3.4 Regulatory landscape
- 3.4.1 North America
- 3.4.2 Europe
- 3.4.3 Asia Pacific
- 3.4.4 Latin America
- 3.4.5 Middle East & Africa
- 3.5 Porter's analysis
- 3.6 PESTEL analysis
- 3.7 Price trends
- 3.7.1 By region
- 3.7.2 By product
- 3.8 Future market trends
- 3.9 Technology and innovation landscape
- 3.9.1 Current technological trends
- 3.9.2 Emerging technologies
- 3.10 Patent landscape
- 3.11 Trade statistics (HS code)
( Note: the trade statistics will be provided for key countries only
- 3.11.1 Major importing countries
- 3.11.2 Major exporting countries
- 3.12 Sustainability and environmental aspects
- 3.12.1 Sustainable practices
- 3.12.2 Waste reduction strategies
- 3.12.3 Energy efficiency in production
- 3.12.4 Eco-friendly initiatives
- 3.13 Carbon Footprint Considerations
- 3.14 Raw material analysis
- 3.14.1 Plant-derived materials
- 3.14.2 Marine-derived materials
- 3.14.3 Biotechnology-derived materials
- 3.14.4 Animal-derived materials
- 3.14.5 Raw material sourcing challenges
- 3.14.6 Sustainability considerations
- 3.15 Extraction & processing technologies
- 3.15.1 Conventional extraction methods
- 3.15.2 Green extraction technologies
- 3.15.3 Biotechnological production
- 3.15.4 Enzymatic extraction
- 3.15.5 Supercritical fluid extraction
- 3.15.6 Ultrasonic-assisted extraction
- 3.15.7 Quality control and testing
- 3.16 Distribution channel analysis
- 3.16.1 Direct sales
- 3.16.2 Distributors/wholesalers
- 3.16.3 Online retail
- 3.16.4 Specialty suppliers
- 3.17 Technological innovations and advancements
- 3.17.1 Novel extraction techniques
- 3.17.2 Advanced delivery systems
- 3.17.3 Encapsulation technologies
- 3.17.4 Biotechnology applications
- 3.17.5 Artificial intelligence in ingredient discovery
Chapter 4 Competitive Landscape, 2024
- 4.1 Introduction
- 4.2 Company market share analysis
- 4.2.1 By region
- 4.2.1.1 North America
- 4.2.1.2 Europe
- 4.2.1.3 Asia Pacific
- 4.2.1.4 LATAM
- 4.2.1.5 MEA
- 4.2.1 By region
- 4.3 Company matrix analysis
- 4.4 Competitive analysis of major market players
- 4.5 Competitive positioning matrix
- 4.6 Key developments
- 4.6.1 Mergers & acquisitions
- 4.6.2 Partnerships & collaborations
- 4.6.3 New product launches
- 4.6.4 Expansion plans
Chapter 5 Market Estimates & Forecast, By Source, 2021 - 2034 (USD Million) (Kilo Tons)
- 5.1 Key trend
- 5.2 Plant-derived
- 5.2.1 Herbs and botanicals
- 5.2.2 Fruits and vegetables
- 5.2.3 Seeds and oils
- 5.2.4 Others
- 5.3 Marine-derived
- 5.3.1 Algae and seaweed
- 5.3.2 Fish and fish by-products
- 5.3.3 Marine microorganisms
- 5.3.4 Others
- 5.4 Biotechnology-derived
- 5.4.1 Fermentation products
- 5.4.2 Engineered peptides
- 5.4.3 Others
- 5.5 Animal-derived
- 5.5.1 Collagen and gelatin
- 5.5.2 Honey and propolis
- 5.5.3 Others
Chapter 6 Market Estimates & Forecast, By Type, 2021 - 2034 (USD Million) (Kilo Tons)
- 6.1 Key trend
- 6.2 Antioxidants
- 6.2.1 Polyphenols
- 6.2.2 Carotenoids
- 6.2.3 Vitamins
- 6.2.4 Others
- 6.3 Peptides and proteins
- 6.3.1 Collagen peptides
- 6.3.2 Signal peptides
- 6.3.3 Carrier peptides
- 6.3.4 Enzyme inhibitor peptides
- 6.3.5 Others
- 6.4 Polysaccharides
- 6.4.1 Hyaluronic acid
- 6.4.2 Alginates
- 6.4.3 Chitosan
- 6.4.4 Others
- 6.5 Lipids and fatty acids
- 6.5.1 Omega-3 fatty acids
- 6.5.2 Ceramides
- 6.5.3 Phospholipids
- 6.5.4 Others
- 6.6 Enzymes
- 6.6.1 Proteases
- 6.6.2 Lipases
- 6.6.3 Others
- 6.7 Vitamins and minerals
- 6.7.1 Vitamin A
- 6.7.2 Vitamin C
- 6.7.3 Vitamin E
- 6.7.4 Others
- 6.8 Others
Chapter 7 Market Estimates & Forecast, By Application, 2021 - 2034 (USD Million) (Kilo Tons)
- 7.1 Key trend
- 7.2 Anti-aging
- 7.3 Skin brightening & lightening.
- 7.4 UV protection
- 7.5 Moisturizing & hydration
- 7.6 Anti-acne
- 7.7 Hair care
- 7.8 Others
Chapter 8 Market Estimates & Forecast, By End Use, 2021 - 2034 (USD Million) (Kilo Tons)
- 8.1 Key trend
- 8.2 Skin care
- 8.2.1 Facial care
- 8.2.2 Body care
- 8.2.3 Sun care
- 8.2.4 Others
- 8.3 Hair care
- 8.3.1 Shampoos & conditioners
- 8.3.2 Hair oils & serums
- 8.3.3 Hair colorants
- 8.3.4 Others
- 8.4 Make-up & color cosmetics
- 8.4.1 Face make-up
- 8.4.2 Eye make-up
- 8.4.3 Lip products
- 8.4.4 Others
- 8.5 Fragrances
- 8.6 Oral Care
- 8.7 Others
Chapter 9 Market Estimates & Forecast, By Function, 2021 -2034 (USD Million) (Kilo Tons)
- 9.1 Key trend
- 9.2 Conventional
- 9.3 Encapsulated
- 9.3.1 Liposomes
- 9.3.2 Niosomes
- 9.3.3 Microemulsions
- 9.3.4 Solid Lipid Nanoparticles
- 9.3.5 Others
Chapter 10 Market Estimates & Forecast, By Region, 2021 - 2034 (USD Million) (Kilo Tons)
- 10.1 Key trends
- 10.2 North America
- 10.2.1 U.S.
- 10.2.2 Canada
- 10.3 Europe
- 10.3.1 Germany
- 10.3.2 UK
- 10.3.3 France
- 10.3.4 Italy
- 10.3.5 Spain
- 10.3.6 Rest of Europe
- 10.4 Asia Pacific
- 10.4.1 China
- 10.4.2 India
- 10.4.3 Japan
- 10.4.4 Australia
- 10.4.5 South Korea
- 10.4.6 Rest of Asia Pacific
- 10.5 Latin America
- 10.5.1 Brazil
- 10.5.2 Mexico
- 10.5.3 Argentina
- 10.5.4 Rest of Latin America
- 10.6 Middle East & Africa
- 10.6.1 Saudi Arabia
- 10.6.2 South Africa
- 10.6.3 UAE
- 10.6.4 Rest of Middle East & Africa
Chapter 11 Company Profiles
- 11.1 Active Concepts LLC
- 11.2 Ashland Global Holdings Inc.
- 11.3 BASF SE
- 11.4 BioSpectrum, Inc.
- 11.5 Clariant AG
- 11.6 Codif Technologie Naturelle
- 11.7 Croda International Plc
- 11.8 Evonik Industries AG
- 11.9 Gattefosse SAS
- 11.10 Givaudan SA
- 11.11 Laboratoires Expanscience
- 11.12 Lipotec S.A.U.
- 11.13 Lonza Group
- 11.14 Lucas Meyer Cosmetics (IFF)
- 11.15 Mibelle Biochemistry
- 11.16 Provital Group
- 11.17 Seppic SA
- 11.18 Silab
- 11.19 Symrise AG
- 11.20 Vytrus Biotech
 竹萃取物市場:2026-2032年全球市場預測(依產品形式、功能、原料、應用、通路和最終用戶分類)
 2026年全球酵素法土壤穩定劑市場報告生物基發泡體市場:依產品、原料、材料成分、終端用戶應用及通路分類-2026-2032年全球市場預測
 Ubaol市場規模、佔有率和成長分析:按產品類型、美容產品、年齡層、性別、分銷管道和地區分類-2026-2033年產業預測
 磺酸鹽市場規模、佔有率和成長分析:按化學鹽類型、應用、純度/等級、物理形態和地區分類-2026-2033年產業預測生化需氧量分析儀市場:2026-2032年全球市場預測(依樣品類型、分析儀類型、技術、應用、最終用戶及通路分類)2026年全球生物衍生化學品市場報告平台化學品市場:依產品類型、原料、製造流程及最終用途分類-2026-2032年全球預測全球複雜生物酵素產品市場(按應用、酵素類別、劑型、最終用戶和分銷管道分類)預測(2026-2032年)
 角鯊烷基乳化劑市場規模、佔有率和成長分析:按產品類型、配方類型、最終用途、分銷管道和地區分類-2026-2033年產業預測