


 |
市場調查報告書
商品編碼
1766274
生物活性成分市場機會、成長動力、產業趨勢分析及 2025 - 2034 年預測Bioactive Ingredients Market Opportunity, Growth Drivers, Industry Trend Analysis, and Forecast 2025 - 2034 |
||||||
2024年,全球生物活性成分市場規模達1,275億美元,預計2034年將以7.9%的複合年成長率成長,達到2,799億美元。生物活性成分是食品、補充劑和個人護理產品中天然存在的化合物,其健康益處遠超基本營養。這些成分包括多酚、益生菌、ω-3脂肪酸、植物萃取物和膳食纖維,有助於增強免疫力、促進消化和整體健康。消費者對健康保健意識的不斷提升、向預防性醫療保健的轉變以及對清潔標籤功能性產品日益成長的需求,共同推動著生物活性成分市場的擴張。
綠色萃取方法的技術進步也提高了生物活性成分的功效和永續性,進一步推動了市場成長。這些創新技術,例如超臨界流體萃取、超音波輔助萃取和酵素輔助萃取,不僅提高了產量和純度,還保留了多酚和歐米伽脂肪酸等熱敏性化合物的完整性。這確保了成分在最終應用中具有更高的生物利用度和更佳的功能性能。此外,綠色萃取最大限度地減少了有害溶劑的使用,降低了對環境的影響,這與產業向清潔標籤和環保生產的轉變相契合。因此,製造商擴大採用這些先進的方法,以滿足監管要求和消費者對安全、天然和永續健康保健解決方案日益成長的需求。
| 市場範圍 | |
|---|---|
| 起始年份 | 2024 |
| 預測年份 | 2025-2034 |
| 起始值 | 1275億美元 |
| 預測值 | 2799億美元 |
| 複合年成長率 | 7.9% |
2024年,脂肪酸市場佔19.1%,價值243億美元。該細分市場的主導地位得益於消費者對脂肪酸日益成長的需求,脂肪酸以其對心臟健康、認知功能和抗發炎支持等益處而聞名。壓力、疲勞、消化問題和維生素缺乏等與生活方式相關的健康狀況日益普遍,促使消費者尋求預防性醫療保健解決方案,從而推動了該細分市場的成長。
2024年,植物性來源市場佔比58.3%,預計到2034年將以6.8%的複合年成長率快速成長。這種主導地位源於全球對清潔標籤、天然和純素產品的需求不斷成長,尤其是在功能性食品、補充劑和個人護理領域。水果和蔬菜、穀物和穀類、香草和香料、油籽和豆類都是植物性生物活性物質的來源。這些成分中含有的抗氧化劑、維生素、多酚和纖維具有抗發炎、抗衰老和增強免疫力等健康益處。
2024年,亞太生物活性成分市場佔38.8%的市佔率。中國、印度和日本是亞太地區的主要貢獻者,其成長主要得益於消費者健康意識的提升、快速的城市化進程以及功能性食品和補充劑行業日益普及。政府支持營養補充劑的政策、日益成長的老齡化人口以及對植物性、草藥和傳統醫藥基生物活性成分的高需求,進一步推動了市場的發展。疫情過後,對增強免疫力的補充劑的需求不斷增加,從而引發了人們對功能性食品和營養保健品的濃厚興趣。
全球生物活性成分市場的主要參與者包括FMC Corporation、Ingredion Incorporated、Mazza Innovation Ltd.、Roquette、Sabinsa Corporation、Archer Daniels Midland、Cargill、BASF SE、Ajinomoto Co.和Arla Foods。這些公司專注於產品創新、策略合作夥伴關係以及擴大全球影響力,以鞏固其市場地位。生物活性成分市場中的公司正在採取多項關鍵策略來增強其影響力。產品創新是一項主要策略,在研發方面投入大量資金,從而推出新產品,以滿足食品飲料、膳食補充劑和個人護理等各個終端用戶行業對功能性成分日益成長的需求。
策略合作夥伴關係和收購也日益盛行,使企業能夠擴大產品組合和市場覆蓋範圍。例如,與區域合作夥伴的合作使企業能夠進入新興市場並利用當地專業知識。此外,企業正專注於永續發展,採用綠色萃取技術並負責任地採購原料,以滿足消費者對天然和有機產品日益成長的需求。
目錄
第1章:方法論與範圍
第2章:執行摘要
第3章:行業洞察
- 產業生態系統分析
- 供應商概況
- 利潤率
- 每個階段的增值
- 影響價值鏈的因素
- 中斷
- 產業衝擊力
- 成長動力
- 產業陷阱與挑戰
- 市場機會
- 成長潛力分析
- 監管格局
- 北美洲
- 歐洲
- 亞太地區
- 拉丁美洲
- 中東和非洲
- 波特的分析
- PESTEL分析
- 價格趨勢
- 按地區
- 按產品
- 未來市場趨勢
- 技術和創新格局
- 當前的技術趨勢
- 新興技術
- 專利態勢
- 貿易統計(HS編碼)(註:僅提供重點國家的貿易統計資料)
- 主要進口國
- 主要出口國
- 永續性和環境方面
- 永續實踐
- 減少廢棄物的策略
- 生產中的能源效率
- 環保舉措
第4章:競爭格局
- 介紹
- 公司市佔率分析
- 按地區
- 北美洲
- 歐洲
- 亞太地區
- 拉丁美洲
- MEA
- 按地區
- 公司矩陣分析
- 主要市場參與者的競爭分析
- 競爭定位矩陣
- 關鍵進展
- 併購
- 夥伴關係與合作
- 新產品發布
- 擴張計劃
第5章:市場估計與預測:依產品類型,2021 - 2034 年
- 主要趨勢
- 多酚
- 單一維生素
- 黃酮類化合物
- 酚酸
- 木脂素
- 芪類
- 其他
- 類胡蘿蔔素
- BETA-胡蘿蔔素
- 葉黃素
- 番茄紅素
- 蝦紅素
- 其他
- 益生元
- 接骨木
- 低聚果糖
- 低聚半乳糖
- 菊粉
- 其他
- 益生菌
- 乳酸桿菌
- 雙歧桿菌
- 鏈球菌
- 其他
- 脂肪酸
- Omega-3脂肪酸
- Omega-6脂肪酸
- 其他
- 蛋白質和胺基酸
- 植物性
- 動物性
- 生物活性胜肽
- 維生素
- 礦物質
- 纖維
- 其他
第6章:市場估計與預測:按來源,2021 - 2034 年
- 主要趨勢
- 植物性
- 水果和蔬菜
- 穀物和穀類
- 香草和香料
- 油籽和豆類
- 其他
- 動物性
- 乳製品
- 肉類和魚類
- 蛋
- 其他
- 微生物
- 細菌
- 真菌
- 藻類
- 其他
- 海洋
- 海藻
- 魚
- 其他
- 其他
第7章:市場估計與預測:按應用,2021 - 2034 年
- 主要趨勢
- 食品和飲料
- 功能性食品
- 功能性飲料
- 烘焙和糖果
- 乳製品
- 肉類和家禽產品
- 其他
- 膳食補充劑
- 片劑和膠囊
- 粉末
- 液體
- 其他
- 製藥
- 口服製劑
- 外用製劑
- 其他
- 化妝品和個人護理
- 保養品
- 護髮
- 其他
- 動物營養
- 其他
第 8 章:市場估計與預測:按提取技術,2021 年至 2034 年
- 主要趨勢
- 常規提取方法
- 溶劑萃取
- 浸漬
- 滲濾
- 其他
- 先進的萃取方法
- 表面流體萃取(SFE)
- 加壓液體萃取(PLE)
- 微波輔助萃取(MAE)
- 超音波輔助萃取(UAE)
- 酵素輔助萃取
- 其他
- 綠色萃取技術
- 深共熔溶劑(DES)
- 天然深層共熔溶劑(NADES)
- 其他
- 其他
第9章:市場估計與預測:按地區,2021 - 2034 年
- 主要趨勢
- 北美洲
- 美國
- 加拿大
- 歐洲
- 德國
- 英國
- 法國
- 西班牙
- 義大利
- 荷蘭
- 亞太地區
- 中國
- 印度
- 日本
- 澳洲
- 韓國
- 拉丁美洲
- 巴西
- 墨西哥
- 阿根廷
- 中東和非洲
- 沙烏地阿拉伯
- 南非
- 阿拉伯聯合大公國
第10章:公司簡介
- Nestle SA
- Fonterra Co-operative Group
- Arla Foods
- FrieslandCampina
- Glanbia Nutritionals
- Davisco Foods International
- DSM
- Cargill, Inc.
- Archer Daniels Midland Company
- DuPont
- BASF SE
- Ajinomoto Co., Inc.
- Chr. Hansen Holding A/S
- Kerry Group
- Ingredion Incorporated
- Tate & Lyle PLC
- Koninklijke DSM NV
- Roquette Freres
- Symrise AG
- Givaudan
- Naturex (now part of Givaudan)
- Frutarom (now part of IFF)
- Kemin Industries
- Kalsec Inc.
- Dohler GmbH
- Diana Group (now part of Symrise)
- Mazza Innovation Ltd.
- Sabinsa Corporation
- Indena SpA
- Martin Bauer Group
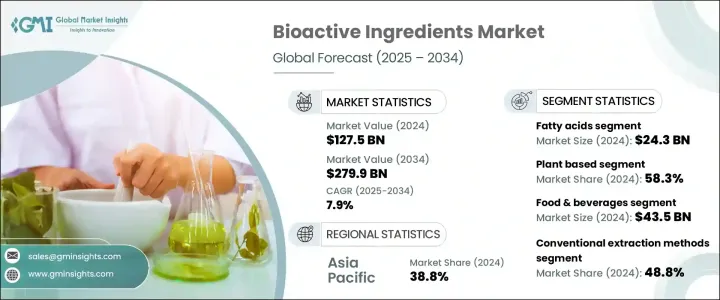
The Global Bioactive Ingredients Market was valued at USD 127.5 billion in 2024 and is estimated to grow at a CAGR of 7.9% to reach USD 279.9 billion by 2034. Bioactive ingredients are naturally occurring compounds found in foods, supplements, and personal care products that offer health benefits beyond basic nutrition. These include polyphenols, probiotics, omega-3 fatty acids, plant extracts, and fibers, which support immunity, digestion, and overall wellness. The market's expansion is driven by increasing consumer awareness of health and wellness, a shift toward preventive healthcare, and a growing demand for clean-label, functional products.
Technological advancements in green extraction methods have also enhanced the efficacy and sustainability of bioactive ingredients, further fueling market growth. These innovative techniques-such as supercritical fluid extraction, ultrasound-assisted extraction, and enzyme-assisted extraction-not only improve yield and purity but also preserve the integrity of heat-sensitive compounds like polyphenols and omega fatty acids. This ensures higher bioavailability and better functional performance of the ingredients in end-use applications. Moreover, green extraction minimizes the use of harmful solvents and reduces environmental impact, aligning well with the industry's shift toward clean-label, eco-friendly production. As a result, manufacturers are increasingly adopting these advanced methods to meet regulatory requirements and growing consumer demand for safe, natural, and sustainable health and wellness solutions.
| Market Scope | |
|---|---|
| Start Year | 2024 |
| Forecast Year | 2025-2034 |
| Start Value | $127.5 Billion |
| Forecast Value | $279.9 Billion |
| CAGR | 7.9% |
The fatty acids segment accounted for a 19.1% share in 2024, valued at USD 24.3 billion. This segment's dominance is attributed to rising consumer demand for these fatty acids, known for their benefits in heart health, cognitive function, and anti-inflammatory support. The increasing prevalence of lifestyle-related health conditions such as stress, fatigue, digestive issues, and vitamin deficiencies has led consumers to seek preventive healthcare solutions, thereby boosting this segment's growth.
Plant-based sources segment made up 58.3% share in 2024 and is expected to grow at a faster rate of 6.8% CAGR through 2034. This dominance is due to the rising global demand for clean-label, natural, and vegan products, especially in functional foods, supplements, and personal care. Fruits and vegetables, cereals and grains, herbs and spices, and oilseeds and pulses are among the sources of plant-based bioactives. Antioxidants, vitamins, polyphenols, and fibers present in these ingredients offer health benefits such as anti-inflammatory, anti-aging, and immunity-boosting properties.
Asia Pacific Bioactive Ingredients Market held a 38.8% share in 2024. China, India, and Japan are the leading contributors within the Asia Pacific region, with growth driven by rising consumer health awareness, rapid urbanization, and increasing popularity of functional foods and the supplement industry. Government policies supporting nutritional supplements, a growing aging population, and high demand for plant-based, herbal, and traditional medicine-based bioactives have further propelled the market. Post-pandemic, there has been an increased demand for immunity-enhancing supplements, leading to greater interest in functional foods and nutraceuticals.
Key players in the Global Bioactive Ingredients Market include FMC Corporation, Ingredion Incorporated, Mazza Innovation Ltd., Roquette, Sabinsa Corporation, Archer Daniels Midland, Cargill, BASF SE, Ajinomoto Co., and Arla Foods. These companies are focusing on product innovation, strategic partnerships, and expanding their global presence to strengthen their position in the market. Companies in the Bioactive Ingredients Market are adopting several key strategies to strengthen their presence. Product innovation is a primary tactic, with significant investments in research and development leading to the launch of new products that cater to the growing demand for functional ingredients across various end-user industries like food & beverage, dietary supplements, and personal care.
Strategic partnerships and acquisitions are also prevalent, allowing companies to expand their product portfolios and market reach. For instance, collaborations with regional partners enable companies to tap into emerging markets and leverage local expertise. Additionally, companies are focusing on sustainability by adopting green extraction technologies and sourcing raw materials responsibly to meet the increasing consumer demand for natural and organic products.
Table of Contents
Chapter 1 Methodology & Scope
- 1.1 Market scope and definition
- 1.2 Research design
- 1.2.1 Research approach
- 1.2.2 Data collection methods
- 1.3 Data mining sources
- 1.3.1 Global
- 1.3.2 Regional/Country
- 1.4 Base estimates and calculations
- 1.4.1 Base year calculation
- 1.4.2 Key trends for market estimation
- 1.5 Primary research and validation
- 1.5.1 Primary sources
- 1.6 Forecast model
- 1.7 Research assumptions and limitations
Chapter 2 Executive Summary
- 2.1 Industry 360° synopsis
- 2.2 Key market trends
- 2.2.1 Regional
- 2.2.2 Product
- 2.2.3 End Use
- 2.3 TAM Analysis, 2025-2034
- 2.4 CXO perspectives: Strategic imperatives
- 2.4.1 Executive decision points
- 2.4.2 Critical success factors
- 2.5 Future Outlook and Strategic Recommendations
Chapter 3 Industry Insights
- 3.1 Industry ecosystem analysis
- 3.1.1 Supplier Landscape
- 3.1.2 Profit Margin
- 3.1.3 Value addition at each stage
- 3.1.4 Factor affecting the value chain
- 3.1.5 Disruptions
- 3.2 Industry impact forces
- 3.2.1 Growth drivers
- 3.2.2 Industry pitfalls and challenges
- 3.2.3 Market opportunities
- 3.3 Growth potential analysis
- 3.4 Regulatory landscape
- 3.4.1 North America
- 3.4.2 Europe
- 3.4.3 Asia Pacific
- 3.4.4 Latin America
- 3.4.5 Middle East & Africa
- 3.5 Porter's analysis
- 3.6 PESTEL analysis
- 3.6.1 Technology and innovation landscape
- 3.6.2 Current technological trends
- 3.6.3 Emerging technologies
- 3.7 Price trends
- 3.7.1 By region
- 3.7.2 By product
- 3.8 Future market trends
- 3.9 Technology and innovation landscape
- 3.9.1 Current technological trends
- 3.9.2 Emerging technologies
- 3.10 Patent Landscape
- 3.11 Trade statistics (HS code) (Note: the trade statistics will be provided for key countries only)
- 3.11.1 Major importing countries
- 3.11.2 Major exporting countries
- 3.12 Sustainability and environmental aspects
- 3.12.1 Sustainable practices
- 3.12.2 Waste reduction strategies
- 3.12.3 Energy efficiency in production
- 3.12.4 Eco-friendly Initiatives
Chapter 4 Competitive Landscape, 2024
- 4.1 Introduction
- 4.2 Company market share analysis
- 4.2.1 By region
- 4.2.1.1 North America
- 4.2.1.2 Europe
- 4.2.1.3 Asia Pacific
- 4.2.1.4 LATAM
- 4.2.1.5 MEA
- 4.2.1 By region
- 4.3 Company matrix analysis
- 4.4 Competitive analysis of major market players
- 4.5 Competitive positioning matrix
- 4.6 Key developments
- 4.6.1 Mergers & acquisitions
- 4.6.2 Partnerships & collaborations
- 4.6.3 New Product Launches
- 4.6.4 Expansion Plans
Chapter 5 Market Estimates and Forecast, By Product Type, 2021 - 2034 (USD Million) (Kilo Tons)
- 5.1 Key trends
- 5.2 Polyphenols
- 5.2.1 Single vitamins
- 5.2.2 Flavonoids
- 5.2.3 Phenolic acids
- 5.2.4 Lignans
- 5.2.5 Stilbenes
- 5.2.6 Others
- 5.3 Carotenoids
- 5.3.1 Beta-carotene
- 5.3.2 Lutein
- 5.3.3 Lycopene
- 5.3.4 Astaxanthin
- 5.3.5 Others
- 5.4 Prebiotics
- 5.4.1 Elderberry
- 5.4.2 Fructo-oligosaccharides
- 5.4.3 Galacto-oligosaccharides
- 5.4.4 Inulin
- 5.4.5 Others
- 5.5 Probiotics
- 5.5.1 Lactobacillus
- 5.5.2 Bifidobacterium
- 5.5.3 Streptococcus
- 5.5.4 Others
- 5.6 Fatty Acids
- 5.6.1 Omega-3 fatty acids
- 5.6.2 Omega-6 fatty acids
- 5.6.3 Others
- 5.7 Proteins & Amino Acids
- 5.7.1 Plant-based
- 5.7.2 Animal-based
- 5.7.3 Bioactive Peptides
- 5.8 Vitamins
- 5.9 Minerals
- 5.10 Fibres
- 5.11 Others
Chapter 6 Market Estimates and Forecast, By Source, 2021 - 2034 (USD Million) (Kilo Tons)
- 6.1 Key trends
- 6.2 Plant based
- 6.2.1 Fruits & vegetables
- 6.2.2 Cereals & grains
- 6.2.3 Herbs & spices
- 6.2.4 Oilseeds & pulses
- 6.2.5 Others
- 6.3 Animal based
- 6.3.1 Dairy products
- 6.3.2 Meat & fish
- 6.3.3 Eggs
- 6.3.4 Others
- 6.4 Microbial
- 6.4.1 Bacteria
- 6.4.2 Fungi
- 6.4.3 Algae
- 6.4.4 Others
- 6.5 Marine
- 6.5.1 Seaweed
- 6.5.2 Fish
- 6.5.3 Others
- 6.6 Others
Chapter 7 Market Estimates and Forecast, By Application, 2021 - 2034 (USD Million) (Kilo Tons)
- 7.1 Key trends
- 7.2 Food & Beverages
- 7.2.1 Functional foods
- 7.2.2 Functional beverages
- 7.2.3 Bakery & confectionery
- 7.2.4 Dairy products
- 7.2.5 Meat & poultry products
- 7.2.6 Others
- 7.3 Dietary Supplements
- 7.3.1 Tablets & capsules
- 7.3.2 Powders
- 7.3.3 Liquid
- 7.3.4 Others
- 7.4 Pharmaceuticals
- 7.4.1 Oral formulations
- 7.4.2 Topical formulations
- 7.4.3 Others
- 7.5 Cosmetics & personal care
- 7.5.1 Skincare
- 7.5.2 Haircare
- 7.5.3 Others
- 7.6 Animal Nutrition
- 7.7 Others
Chapter 8 Market Estimates and Forecast, By Extraction Technology, 2021 - 2034 (USD Million) (Kilo Tons)
- 8.1 Key trends
- 8.2 Convention extraction methods
- 8.2.1 Solvent extraction
- 8.2.2 Maceration
- 8.2.3 Percolation
- 8.2.4 Others
- 8.3 Advanced extraction methods
- 8.3.1 Superficial fluid extraction (SFE)
- 8.3.2 Pressurized liquid extraction (PLE)
- 8.3.3 Microwave assisted extraction (MAE)
- 8.3.4 Ultrasound assisted extraction (UAE)
- 8.3.5 Enzyme assisted extraction
- 8.3.6 Others
- 8.4 Green extraction technologies
- 8.4.1 Deep eutectic solvents (DES)
- 8.4.2 Natural deep eutectic solvents (NADES)
- 8.4.3 Others
- 8.5 Others
Chapter 9 Market Estimates and Forecast, By Region, 2021 - 2034 (USD Million) (Kilo Tons)
- 9.1 Key trends
- 9.2 North America
- 9.2.1 U.S.
- 9.2.2 Canada
- 9.3 Europe
- 9.3.1 Germany
- 9.3.2 UK
- 9.3.3 France
- 9.3.4 Spain
- 9.3.5 Italy
- 9.3.6 Netherlands
- 9.4 Asia Pacific
- 9.4.1 China
- 9.4.2 India
- 9.4.3 Japan
- 9.4.4 Australia
- 9.4.5 South Korea
- 9.5 Latin America
- 9.5.1 Brazil
- 9.5.2 Mexico
- 9.5.3 Argentina
- 9.6 Middle East and Africa
- 9.6.1 Saudi Arabia
- 9.6.2 South Africa
- 9.6.3 UAE
Chapter 10 Company Profiles
- 10.1 Nestle S.A.
- 10.2 Fonterra Co-operative Group
- 10.3 Arla Foods
- 10.4 FrieslandCampina
- 10.5 Glanbia Nutritionals
- 10.6 Davisco Foods International
- 10.7 DSM
- 10.8 Cargill, Inc.
- 10.9 Archer Daniels Midland Company
- 10.10 DuPont
- 10.11 BASF SE
- 10.12 Ajinomoto Co., Inc.
- 10.13 Chr. Hansen Holding A/S
- 10.14 Kerry Group
- 10.15 Ingredion Incorporated
- 10.16 Tate & Lyle PLC
- 10.17 Koninklijke DSM N.V.
- 10.18 Roquette Freres
- 10.19 Symrise AG
- 10.20 Givaudan
- 10.21 Naturex (now part of Givaudan)
- 10.22 Frutarom (now part of IFF)
- 10.23 Kemin Industries
- 10.24 Kalsec Inc.
- 10.25 Dohler GmbH
- 10.26 Diana Group (now part of Symrise)
- 10.27 Mazza Innovation Ltd.
- 10.28 Sabinsa Corporation
- 10.29 Indena S.p.A.
- 10.30 Martin Bauer Group


