


 |
市場調查報告書
商品編碼
1766233
爆炸物處理 (EOD) 機器人市場機會、成長動力、產業趨勢分析及 2025 - 2034 年預測Explosive Ordnance Disposal (EOD) Robots Market Opportunity, Growth Drivers, Industry Trend Analysis, and Forecast 2025 - 2034 |
||||||
2024年,全球爆炸物處理機器人市場規模達18億美元,預計2034年將以15.1%的複合年成長率成長,達到73億美元。此類系統需求的激增,很大程度上源自於全球安全威脅日益頻繁以及各國政府國防投資的不斷增加。隨著威脅日益複雜,各國正優先開發和部署無人技術,以消除潛在危險,同時降低對人類生命的威脅。
將機器人技術融入爆炸物處理任務已不再是小眾技能,而是現代武裝部隊和安全機構的關鍵資產。這些機器人日益被視為在不可預測的情況下應對爆炸危險的一線解決方案,使其成為戰場和民用行動中不可或缺的一部分。它們的部署不僅增強了態勢感知和決策能力,還能大幅降低作戰成本和人員風險。因此,隨著軍隊適應非對稱威脅,執法部門尋求在城市環境中使用可靠的工具,機器人平台的採購量持續成長。
| 市場範圍 | |
|---|---|
| 起始年份 | 2024 |
| 預測年份 | 2025-2034 |
| 起始值 | 18億美元 |
| 預測值 | 73億美元 |
| 複合年成長率 | 15.1% |
市面上的排爆機器人依類型分為遙控型和自主/半自主型。 2024年,遙控機器人以11.4億美元的估值領先市場。其受歡迎程度源自於其可靠性和價格實惠,這使得包括戰術部隊和安全機構在內的廣泛用戶都能使用。在即時判斷至關重要的場景中,手動控制仍然必不可少,操作員更喜歡能夠立即響應人類指令的系統。這些平台也相對易於操作,所需的監管許可較少,並且在需要適應性和即時監控的部署中廣受歡迎。
就最終用途而言,國防和軍事領域是主要貢獻者,佔2024年全球市場佔有率的59%。這一主導地位源自於該領域高度依賴機器人系統執行簡易爆炸裝置(IED)拆除、戰術偵察以及敵對環境下的後勤支援等任務。全球武裝部隊正優先將機器人技術融入其國防戰略,以最大限度地減少士兵暴露風險並提高任務成功率。持續的部隊現代化投資,以及與指揮、控制、通訊、電腦、情報、監視和偵察(C4ISR)網路的更緊密結合,進一步鞏固了該領域的領先地位。
按作戰範圍細分,短程排爆機器人佔據市場主導地位,2024 年其價值達 8.217 億美元。這類機器人因其機動性強、適合快速反應部署,廣泛應用於城市任務、受限空間和民用作業。其緊湊的設計和高機動性使其成為執法部門、急救人員和拆彈小組的理想選擇,這些部門需要有效的工具來應對局部威脅。隨著人口稠密地區的安全挑戰日益嚴峻,預計在整個預測期內,對此類系統的需求將保持強勁。
移動性是另一個關鍵的細分領域,機器人可分為履帶式、輪式、腿部式和混合式。其中,履帶式機器人在2024年佔據了46.1%的市場。這些系統因其在不平坦或充滿碎石的地形上卓越的牽引力和穩定性而備受推崇,這使得它們在戰區和爆炸後環境中特別有用。其堅固的結構使其能夠承載更重的有效載荷並在惡劣條件下運行,使其成為軍事和戰術行動的首選。
美國在全球市場佔有重要佔有率,2024 年估值達 6.315 億美元。美國在該領域的領先地位得益於其高額的國防開支、持續的海外部署以及對軍事人員防護技術的戰略重視。美國對先進 EOD 系統的強勁需求也受到政府支持研究和採購的舉措的推動,尤其是透過國防部和國土安全部等機構。人工智慧和自動化技術的進步進一步推動了下一代機器人解決方案在國家安全框架內的應用。
排爆機器人市場的競爭格局既有成熟的全球企業,也有敏捷的區域製造商。排名前四名的公司——L3Harris Technologies, Inc.、QinetiQ、iRobot Corporation 和 Peraton——在 2024 年的市佔率總計達 41.4%。這些領先公司受益於長期的國防合約、廣泛的分銷網路以及持續的研發投入。與政府國防機構的緊密關係以及在無人系統領域的創新經驗鞏固了它們的主導地位。同時,新興企業正在透過提供針對執法和民用安全領域利基應用的專業化、經濟高效的解決方案來開拓市場。私人企業與公共國防組織的合作開發也正在加速產品創新,並重塑市場競爭格局。
目錄
第1章:方法論與範圍
第2章:執行摘要
第3章:行業洞察
- 產業生態系統分析
- 供應商格局
- 利潤率
- 成本結構
- 每個階段的增值
- 影響價值鏈的因素
- 中斷
- 川普政府關稅分析
- 對貿易的影響
- 貿易量中斷
- 報復措施
- 對產業的影響
- 供給側影響
- 價格波動
- 供應鏈重組
- 生產成本影響
- 需求面影響
- 價格傳導至終端市場
- 市佔率動態
- 消費者反應模式
- 供給側影響
- 受影響的主要公司
- 策略產業反應
- 供應鏈重組
- 定價和產品策略
- 政策參與
- 展望與未來考慮
- 對貿易的影響
- 產業衝擊力
- 成長動力
- 全球國防開支不斷增加
- 恐怖主義和簡易爆炸裝置威脅事件不斷增加
- 採用自主和人工智慧驅動的技術
- 擴大在民事執法和國土安全領域的應用
- 民事安全應用日益增多
- 產業陷阱與挑戰
- 購置及維護成本高
- 技術複雜性和可靠性問題
- 市場機會
- 成長動力
- 成長潛力分析
- 監管格局
- 北美洲
- 歐洲
- 亞太地區
- 拉丁美洲
- 中東和非洲
- 波特的分析
- PESTEL分析
- 技術和創新格局
- 當前的技術趨勢
- 新興技術
- 價格趨勢
- 按地區
- 按產品
- 定價策略
- 新興商業模式
- 合規性要求
- 消費者情緒分析
- 專利和智慧財產權分析
- 地緣政治與貿易動態
第4章:競爭格局
- 介紹
- 公司市佔率分析
- 按地區
- 北美洲
- 歐洲
- 亞太地區
- 市場集中度分析
- 按地區
- 關鍵參與者的競爭基準
- 財務績效比較
- 收入
- 利潤率
- 研發
- 產品組合比較
- 產品範圍廣度
- 科技
- 創新
- 地理位置比較
- 全球足跡分析
- 服務網路覆蓋
- 各區域市場滲透率
- 競爭定位矩陣
- 領導者
- 挑戰者
- 追蹤者
- 利基市場參與者
- 戰略展望矩陣
- 財務績效比較
- 2021-2024 年關鍵發展
- 併購
- 夥伴關係和合作
- 技術進步
- 擴張和投資策略
- 數位轉型舉措
- 新興/新創企業競爭對手格局
第5章:市場估計與預測:按類型,2021-2034
- 主要趨勢
- 遠端控制
- 自主/半自主
第6章:市場估計與預測:依移動性,2021-2034
- 主要趨勢
- 履帶式機器人
- 輪式機器人
- 腿式機器人
- 混合
第7章:市場估計與預測:依營運範圍,2021-2034 年
- 主要趨勢
- 短距離(<500公尺)
- 中距離(500公尺 – 2公里)
- 長距離(>2公里)
第8章:市場估計與預測:依最終用途,2021-2034
- 主要趨勢
- 國防與軍事
- 執法
- 國土安全
- 其他
第9章:市場估計與預測:按地區,2021-2034
- 主要趨勢
- 北美洲
- 美國
- 加拿大
- 歐洲
- 英國
- 德國
- 法國
- 義大利
- 西班牙
- 荷蘭
- 亞太地區
- 中國
- 印度
- 日本
- 韓國
- 澳洲
- 拉丁美洲
- 巴西
- 墨西哥
- MEA
- 南非
- 沙烏地阿拉伯
- 阿拉伯聯合大公國
第10章:公司簡介
- Boston Dynamics
- Elbit Systems Ltd.
- Foxtech Robotics
- ICOR Technology
- iRobot Corporation
- L3Harris Technologies, Inc.
- Nex Robotics
- Peraton
- PIAP
- QinetiQ
- Reamda Ltd.
- Roboteam
- Shark Robotics
- SuperDroid Robots
- Teledyne FLIR LLC
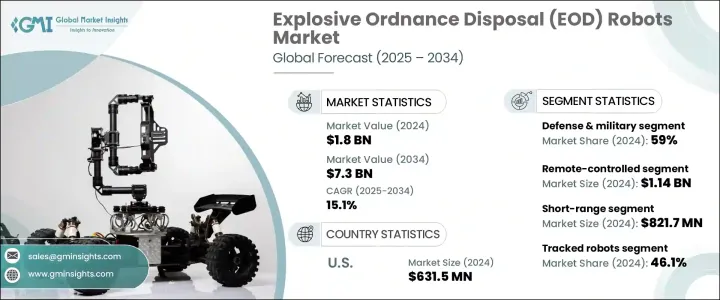
The Global Explosive Ordnance Disposal Robots Market was valued at USD 1.8 billion in 2024 and is estimated to grow at a CAGR of 15.1% to reach USD 7.3 billion by 2034. The surge in demand for these systems is largely tied to the growing frequency of security threats worldwide and rising defense investments by governments. As threats evolve in complexity, nations are prioritizing the development and deployment of unmanned technologies to neutralize potential dangers while reducing risk to human lives.
The integration of robotics in explosive ordnance disposal tasks is no longer a niche capability but a critical asset for modern armed forces and security agencies. These robots are increasingly viewed as a frontline solution for tackling explosive hazards in unpredictable scenarios, making them indispensable in both battlefield and civilian operations. Their deployment not only enhances situational awareness and decision-making but also significantly cuts operational costs and personnel risk. As a result, procurement of robotic platforms continues to rise as militaries adapt to asymmetric threats and law enforcement looks for reliable tools in urban environments.
| Market Scope | |
|---|---|
| Start Year | 2024 |
| Forecast Year | 2025-2034 |
| Start Value | $1.8 Billion |
| Forecast Value | $7.3 Billion |
| CAGR | 15.1% |
Within the market, EOD robots are categorized by type into remote-controlled and autonomous/semi-autonomous variants. In 2024, remote-controlled robots led the market with a valuation of USD 1.14 billion. Their popularity is rooted in their reliability and affordability, which makes them accessible to a wide range of users, including tactical units and security agencies. Manual control remains essential in scenarios where real-time judgment is crucial, and operators prefer systems that respond instantly to human commands. These platforms are also relatively easier to operate, demand minimal regulatory clearance, and are widely preferred in deployments that require adaptability and real-time oversight.
In terms of end use, the defense and military sector was the leading contributor, accounting for 59% of the global market share in 2024. This dominance is driven by the sector's substantial reliance on robotic systems for tasks such as improvised explosive device (IED) neutralization, tactical reconnaissance, and logistical support in hostile environments. Armed forces across the globe are prioritizing the integration of robotics into their defense strategies to minimize soldier exposure and improve mission success rates. Ongoing investments in force modernization, alongside greater alignment with command, control, communications, computers, intelligence, surveillance, and reconnaissance (C4ISR) networks, are further strengthening this segment's lead.
When segmented by operational range, short-range EOD robots dominated the market with a value of USD 821.7 million in 2024. These robots are widely used in urban missions, restricted spaces, and civil operations due to their ease of mobility and suitability for fast-response deployments. Their compact designs and high maneuverability make them ideal for law enforcement, first responders, and bomb squads who need effective tools for localized threats. As security challenges grow in densely populated areas, the demand for such systems is expected to remain strong throughout the forecast period.
Mobility is another key area of segmentation, with robots being divided into tracked, wheeled, legged, and hybrid formats. Among these, tracked robots accounted for a 46.1% market share in 2024. These systems are particularly valued for their superior traction and stability on uneven or debris-filled terrain, which makes them especially useful in combat zones and post-explosion environments. Their rugged construction allows them to carry heavier payloads and operate in harsh conditions, making them the preferred choice for both military and tactical operations.
The United States represented a significant share of the global market, with a valuation of USD 631.5 million in 2024. The country's leadership in this space is fueled by its high defense spending, continuous overseas deployments, and strategic focus on protective technologies for military personnel. The robust demand for advanced EOD systems in the U.S. is also driven by government initiatives that support research and procurement, particularly through agencies such as the Department of Defense and Department of Homeland Security. Technological advancements in artificial intelligence and automation are further propelling the adoption of next-generation robotic solutions within national security frameworks.
The competitive landscape of the EOD robots market features both established global players and agile regional manufacturers. The top four companies-L3Harris Technologies, Inc., QinetiQ, iRobot Corporation, and Peraton-collectively held a market share of 41.4% in 2024. These leading firms benefit from long-term defense contracts, broad distribution networks, and ongoing investment in R&D. Their dominance is reinforced by strong relationships with government defense bodies and a track record of innovation in unmanned systems. Meanwhile, emerging players are carving out their space by offering specialized, cost-effective solutions tailored to niche applications in law enforcement and civilian security. Collaborative development efforts between private firms and public defense organizations are also accelerating product innovation and reshaping the dynamics of market competition.
Table of Contents
Chapter 1 Methodology & Scope
- 1.1 Market scope and definition
- 1.2 Research design
- 1.2.1 Research approach
- 1.2.2 Data collection methods
- 1.3 Data mining sources
- 1.3.1 Global
- 1.3.2 Regional/Country
- 1.4 Base estimates and calculations
- 1.4.1 Base year calculation
- 1.4.2 Key trends for market estimation
- 1.5 Primary research and validation
- 1.5.1 Primary sources
- 1.6 Forecast model
- 1.7 Research assumptions and limitations
Chapter 2 Executive Summary
- 2.1 Industry 3600 synopsis
- 2.2 Key market trends
- 2.2.1 Type trends
- 2.2.2 Mobility trends
- 2.2.3 Operational range trends
- 2.2.4 End use trends
- 2.2.5 Regional trends
- 2.3 TAM Analysis, 2025-2034 (USD Million)
- 2.4 CXO perspectives: Strategic imperatives
- 2.4.1 Executive decision points
- 2.4.2 Critical success factors
- 2.5 Future Outlook and Strategic Recommendations
Chapter 3 Industry Insights
- 3.1 Industry ecosystem analysis
- 3.1.1 Supplier landscape
- 3.1.2 Profit margin
- 3.1.3 Cost structure
- 3.1.4 Value addition at each stage
- 3.1.5 Factor affecting the value chain
- 3.1.6 Disruptions
- 3.2 Trump administration tariffs analysis
- 3.2.1 Impact on trade
- 3.2.1.1 Trade volume disruptions
- 3.2.1.2 Retaliatory measures
- 3.2.2 Impact on the industry
- 3.2.2.1 Supply-side impact
- 3.2.2.1.1 Price volatility in
- 3.2.2.1.2 Supply chain restructuring
- 3.2.2.1.3 Production cost implications
- 3.2.2.2 Demand-side impact
- 3.2.2.2.1 Price transmission to end markets
- 3.2.2.2.2 Market share dynamics
- 3.2.2.2.3 Consumer response patterns
- 3.2.2.1 Supply-side impact
- 3.2.3 key companies impacted
- 3.2.4 strategic industry responses
- 3.2.4.1 Supply chain reconfiguration
- 3.2.4.2 Pricing and product strategies
- 3.2.4.3 Policy engagement
- 3.2.5 Outlook and future considerations
- 3.2.1 Impact on trade
- 3.3 Industry impact forces
- 3.3.1 Growth drivers
- 3.3.1.1 Rising global defense expenditures
- 3.3.1.2 Growing incidences of terrorism & IED threats
- 3.3.1.3 Adoption of autonomous & AI-driven technologies
- 3.3.1.4 Expanding use in civilian law enforcement & homeland security
- 3.3.1.5 Rising civil security applications
- 3.3.2 Industry pitfalls and challenges
- 3.3.2.1 High acquisition and maintenance costs
- 3.3.2.2 Technical complexity & reliability concerns
- 3.3.3 Market opportunities
- 3.3.1 Growth drivers
- 3.4 Growth potential analysis
- 3.5 Regulatory landscape
- 3.5.1 North America
- 3.5.2 Europe
- 3.5.3 Asia Pacific
- 3.5.4 Latin America
- 3.5.5 Middle East & Africa
- 3.6 Porter's analysis
- 3.7 PESTEL analysis
- 3.8 Technology and innovation landscape
- 3.8.1 Current technological trends
- 3.8.2 Emerging technologies
- 3.9 Price trends
- 3.9.1 By region
- 3.9.2 By product
- 3.10 Pricing strategies
- 3.11 Emerging business models
- 3.12 Compliance requirements
- 3.13 Consumer sentiment analysis
- 3.14 Patent and IP analysis
- 3.15 Geopolitical and trade dynamics
Chapter 4 Competitive Landscape, 2024
- 4.1 Introduction
- 4.2 Company market share analysis
- 4.2.1 By region
- 4.2.1.1 North America
- 4.2.1.2 Europe
- 4.2.1.3 Asia Pacific
- 4.2.2 Market concentration analysis
- 4.2.1 By region
- 4.3 Competitive benchmarking of key players
- 4.3.1 Financial performance comparison
- 4.3.1.1 Revenue
- 4.3.1.2 Profit margin
- 4.3.1.3 R&D
- 4.3.2 Product portfolio comparison
- 4.3.2.1 Product range breadth
- 4.3.2.2 Technology
- 4.3.2.3 Innovation
- 4.3.3 Geographic presence comparison
- 4.3.3.1 Global footprint analysis
- 4.3.3.2 Service network coverage
- 4.3.3.3 Market penetration by region
- 4.3.4 Competitive positioning matrix
- 4.3.4.1 Leaders
- 4.3.4.2 Challengers
- 4.3.4.3 Followers
- 4.3.4.4 Niche players
- 4.3.5 Strategic outlook matrix
- 4.3.1 Financial performance comparison
- 4.4 Key developments, 2021-2024
- 4.4.1 Mergers and acquisitions
- 4.4.2 Partnerships and collaborations
- 4.4.3 Technological advancements
- 4.4.4 Expansion and investment strategies
- 4.4.5 Digital transformation initiatives
- 4.5 Emerging/ startup competitors landscape
Chapter 5 Market Estimates & Forecast, By Type, 2021-2034 (USD Million & Units)
- 5.1 Key trends
- 5.2 Remote controlled
- 5.3 Autonomous/semi-autonomous
Chapter 6 Market Estimates & Forecast, By Mobility, 2021-2034 (USD Million & Units)
- 6.1 Key trends
- 6.2 Tracked robots
- 6.3 Wheeled robots
- 6.4 Legged robots
- 6.5 Hybrid
Chapter 7 Market Estimates & Forecast, By Operational Range, 2021-2034 (USD Million & Units)
- 7.1 Key trends
- 7.2 Short-range (<500 meters)
- 7.3 Medium-range (500m – 2 km)
- 7.4 Long-range (>2 km)
Chapter 8 Market Estimates & Forecast, By End Use, 2021-2034 (USD Million & Units)
- 8.1 Key trends
- 8.2 Defense & military
- 8.3 Law enforcement
- 8.4 Homeland security
- 8.5 Others
Chapter 9 Market Estimates & Forecast, By Region, 2021-2034 (USD Million & Units)
- 9.1 Key trends
- 9.2 North America
- 9.2.1 U.S.
- 9.2.2 Canada
- 9.3 Europe
- 9.3.1 UK
- 9.3.2 Germany
- 9.3.3 France
- 9.3.4 Italy
- 9.3.5 Spain
- 9.3.6 Netherlands
- 9.4 Asia Pacific
- 9.4.1 China
- 9.4.2 India
- 9.4.3 Japan
- 9.4.4 South Korea
- 9.4.5 Australia
- 9.5 Latin America
- 9.5.1 Brazil
- 9.5.2 Mexico
- 9.6 MEA
- 9.6.1 South Africa
- 9.6.2 Saudi Arabia
- 9.6.3 UAE
Chapter 10 Company Profiles
- 10.1 Boston Dynamics
- 10.2 Elbit Systems Ltd.
- 10.3 Foxtech Robotics
- 10.4 ICOR Technology
- 10.5 iRobot Corporation
- 10.6 L3Harris Technologies, Inc.
- 10.7 Nex Robotics
- 10.8 Peraton
- 10.9 PIAP
- 10.10 QinetiQ
- 10.11 Reamda Ltd.
- 10.12 Roboteam
- 10.13 Shark Robotics
- 10.14 SuperDroid Robots
- 10.15 Teledyne FLIR LLC


